| Issue |
A&A
Volume 689, September 2024
|
|
|---|---|---|
| Article Number | A336 | |
| Number of page(s) | 17 | |
| Section | Extragalactic astronomy | |
| DOI | https://doi.org/10.1051/0004-6361/202449708 | |
| Published online | 25 September 2024 | |
Revealing the burning and soft heart of the bright bare active galactic nucleus ESO 141-G55: X-ray broadband and SED analysis
1
Aix Marseille Univ, CNRS, CNES, LAM, Marseille, France
2
Department of Physics, Institute for Astrophysics and Computational Sciences, The Catholic University of America, Washington, DC 20064, USA
3
INAF, Osservatorio Astronomico di Brera, Via Bianchi 46, I-23807 Merate, LC, Italy
4
Centre for Extragalactic Astronomy, Department of Physics, University of Durham, South Road, Durham DH1 3LE, UK
5
European Space Agency (ESA), European Space Astronomy Centre (ESAC), E-28691 Villanueva de la Cañada, Madrid, Spain
6
Université de Strasbourg, CNRS, Observatoire Astronomique de Strasbourg, UMR 7550, 67000 Strasbourg, France
Received:
23
February
2024
Accepted:
19
June
2024
Abstract
Context. ESO 141-G55 is a nearby X-ray bright broad-line Seyfert 1 (BLS1) that has been classified as a bare active galactic nucleus (AGN) due to a lack of warm absorption along its line of sight, providing an unhampered view into its disc-corona system.
Aims. We aim to probe its disc-corona system thanks to the first simultaneous XMM-Newton and NuSTAR observation obtained October 1–2, 2022.
Methods. We carried out an X-ray broadband spectral analysis to determine the dominant process(es) at work as well as a spectral energy distribution (SED) analysis to determine the disc-corona properties.
Results. The simultaneous broadband X-ray spectrum of ESO 141-G55 is characterised by the presence of a prominent smooth soft X-ray excess, a broad Fe Kα emission line, and a significant Compton hump. The high-resolution reflection grating spectrometer spectra confirmed the lack of intrinsic warm-absorbing gas along our line of sight in the AGN rest frame, verifying that it is still in a bare state. However, soft X-ray emission lines were observed, indicating substantial warm gas out of our line of sight. The intermediate inclination of the disc-corona system (∼43°) may offer us a favourable configuration to observe ultra-fast outflows from the disc, but none were found in this 2022 observation, contrary to a previous 2007 XMM-Newton one. We ruled out relativistic reflection alone on a standard disc based on the X-ray broadband analysis, while a combination of soft and hard Comptonisation by a warm and hot corona (RELAGN) plus relativistic reflection (REFLKERRD) reproduces the ESO 141-G55 SED quite well. The hot corona temperature is very hot, ∼140 keV, and much higher than about 80% of AGNs, whereas the warm corona temperature, ∼0.3 keV, is similar to the values found in other sub-Eddington AGNs. ESO 141-G55 is accreting at a moderate Eddington accretion rate (∼10–20%).
Conclusions. Our analysis points to a significant contribution of an optically thick warm corona to both the soft X-ray and UV emission in ESO 141-G55, adding to the growing evidence that the accretion of AGNs (even at a moderate accretion rate) appears to deviate from standard disc theory.
Key words: accretion / accretion disks / radiation mechanisms: general / galaxies: active / quasars: general / X-rays: individuals: ESO 141-G55
Corresponding author; This email address is being protected from spambots. You need JavaScript enabled to view it. .
© The Authors 2024
 Open Access article, published by EDP Sciences, under the terms of the Creative Commons Attribution License (https://creativecommons.org/licenses/by/4.0), which permits unrestricted use, distribution, and reproduction in any medium, provided the original work is properly cited.
This article is published in open access under the Subscribe to Open model. This email address is being protected from spambots. You need JavaScript enabled to view it. to support open access publication.
1. Introduction
In the so-called bare active galactic nuclei (AGNs), the direct line of sight intercepts very little or no warm X-ray absorption. Thus, bare AGNs allow for a clean, unimpeded view into the innermost core of the nucleus. As a result, both the continuum (soft X-ray excess and Compton hump) and the emission lines can be measured safely, avoiding the complications introduced from modelling complex absorption and thus providing a robust probe of the disc-corona system.
Importantly, broadband X-ray spectra are crucial in order to determine the physical processes that produce the soft X-ray excess, which include relativistic reflection resulting from the illumination of the accretion disc by a hot corona, Comptonisation of seed photons from the accretion disc by a warm and a hot corona, or a combination thereof (e.g. Magdziarz et al. 1998; Porquet et al. 2004, 2018, 2019, 2021, 2024; Crummy et al. 2006; Bianchi et al. 2009; Fabian et al. 2012; Done et al. 2012; Gliozzi et al. 2013; Petrucci et al. 2018; Gliozzi & Williams 2020; Waddell & Gallo 2020). So far, only a handful of very bright bare AGN have been observed simultaneously by NuSTAR and XMM-Newton with a very high signal-to-noise ratio (Fairall 9, Ark 120, Mrk 110, and TON S180). These simultaneous observations allowed us to demonstrate that relativistic reflection alone onto a standard disc cannot reproduce their X-ray broadband spectra. Instead, a combination of soft and hard Comptonisation (by a warm and hot corona) and relativistic reflection reproduces their SEDs quite well (Matt et al. 2014; Porquet et al. 2018, 2021; Lohfink et al. 2016; Matzeu et al. 2020).
Here, our objective is to expand this important study to the broad-line Seyfert 1 (BLS1) bare AGN ESO 141-G55 (z = 0.0371) through the use of the first simultaneous XMM-Newton and NuSTAR observation performed October 1–2, 2022 (Table 1). Its supermassive black hole mass (log (M/M⊙) = 8.1 ± 0.1) and the inclination angle of its accretion disc (which ranges from 33° to 42° for a maximal and a non-spinning black hole, respectively) have been inferred from accretion disc fits to the UV continuum and the Hβ emission line (Rokaki & Boisson 1999). ESO 141-G55 shows a high bolometric luminosity of Lbol ∼ 3 × 1045 erg s−1 (L2 − 10 keV ∼ 1044 erg s−1), which corresponds to an Eddington accretion rate of 10–20%. It is one of the brightest hard X-ray AGNs seen by Swift-BAT (F14 − 195 keV ∼ 6 × 10⁻¹¹ erg cm−2 s−1), with so far a very moderate X-ray flux variability of ∼20% reported over four to five decades with Ariel-V (Cooke et al. 1978; Elvis et al. 1978), ASCA (Reynolds 1997), XMM-Newton (Gondoin et al. 2003), Swift (Oh et al. 2018), and NuSTAR (Ezhikode et al. 2020; Panagiotou & Walter 2020; Ghosh & Laha 2020; Akylas & Georgantopoulos 2021; Kang & Wang 2022). The hard X-ray spectrum of ESO 141-G55 exhibits a very high-energy cut-off of a few hundred kilo electron volts, as measured from a NuSTAR observation performed in 2016 (Table 1), showing the presence of a very hot corona (e.g. Ezhikode et al. 2020; Panagiotou & Walter 2020; Akylas & Georgantopoulos 2021; Kang & Wang 2022).
Observation log of the XMM-Newton and NuSTAR dataset for ESO 141-G55.
ESO 141-G55 has previously been observed five times by XMM-Newton with F0.3 − 10 keV = 5.0–6.3 × 10⁻¹¹ erg cm−2 s−1: once in 2001 and four times in 2007 (Table 1). For all of these observations, however, the full frame window mode was applied to the EPIC (MOS and pn) cameras, leading to very strong pile-up. Interestingly, in all of these observations, ESO 141-G55 exhibited a smooth prominent soft X-ray excess with no signature from warm absorbing gas in its rest frame based on the spectral analysis of the reflection grating spectrometer (RGS) data, thus allowing it to be classified it as a bare AGN (Gondoin et al. 2003; Boissay et al. 2016; Ghosh & Laha 2020). The only reported X-ray absorption from warm gas seen towards ESO 141-G55 arises from foreground N VI and O VII associated with our Galaxy with modest ionic columns (N(N VI) ∼ 4 × 1017 cm−2 and N(O VII) ∼ 1016 cm−2; Fang et al. 2015; Gatuzz et al. 2021).
The intermediate inclination of ESO 141-G55’s disc-corona system may offer a favourable configuration to intercept the blueshifted absorption signature(s) of a possible equatorial disc wind (ultra-fast outflows, UFOs) in the Fe K energy band (∼6−7 keV), as reported in at least about 40% of the local AGNs (e.g. Tombesi et al. 2010; Gofford et al. 2013). Indeed, during the 2001 XMM-Newton observation (see Table 1), an apparent absorption feature at 7.6 ± 0.1 keV, interpreted as an Fe Kα edge (τ = 0.3 ± 0.1), was observed with the MOS cameras. Unfortunately, no XMM-Newton-pn data were acquired, preventing any confirmation of this possible absorption feature with a better sensitivity above 6 keV. Moreover, the MOS data were obtained using the full frame window mode, leading to heavy pile-up. Applying an annulus extraction region (from 11″ and 86″) to minimise the pile-up effect significantly decreases the signal-to-noise ratio of the MOS spectrum (Gondoin et al. 2003). However, during the XMM-Newton-pn observation on October 30, 2007 (that is, the longest observation in 2007; Table 1, hereafter labelled 2007#4), after minimising the strong pile-up effect, a highly blueshifted absorption feature was reported at ∼8.4 keV with vout = −0.18 ± 0.01 c at a ≥4σ confidence level (de Marco et al. 2009). No absorption line was observed in the three other shorter XMM-Newton observations, which were only performed about three weeks earlier.
In this paper, our aim is to probe the disc-corona system of ESO 141-G55 and its close vicinity using its first simultaneous XMM-Newton and NuSTAR observation performed on October 1–2, 2022. We also performed, when relevant, some comparisons with the previous reprocessed 2007 XMM-Newton and 2016 NuSTAR observations. In Section 2, the data reduction and analysis methods of the datasets are presented. The X-ray spectral analysis is reported in Section 3 using the high-resolution XMM-Newton-RGS data as well as the XMM-Newton-pn and NuSTAR data. The SED analysis (UV to hard X-rays) is reported in Section 4. Finally, the main results are summarised and discussed in Section 5.
2. Observations, data reduction, and analysis method
The log of this first simultaneous XMM-Newton and NuSTAR observation of ESO 141-G55 (NuSTAR cycle-8; PI: D. Porquet) used in this work is reported in Table 1. Previous observations with XMM-Newton and NuSTAR are also listed.
2.1. XMM-Newton data reduction
XMM-Newton data were reprocessed with the Science Analysis System (SAS, version 20.0.0), applying the latest calibration available on April 25, 2023. Only the EPIC-pn (Strüder et al. 2001) data were used (selecting the event patterns 0–4, that is to say, single and double events) since they have a much better sensitivity above ∼6 keV than MOS data. Therefore, we did not use the 2001 observation. The 2022 EPIC pn observation was adequately operated in the small window mode, and then the pn data were not subject to pile-up. The 2022 pn spectrum was extracted from a circular region centred on ESO 141-G55 with a radius of 35″ to avoid the edge of the chip. The four 2007 pn spectra, in order to minimise the heavy pile-up due to the use of the full frame window mode, were extracted from an annulus region centred on the source with an outer radius of 35″ and with an inner radius of 11″ (ObsID: 0503750401), 12″ (ObsID: 0503750101), and 13″ (ObsIDs: 0503750301 and 0503750501). An annulus extraction region results in pn count rates about four times lower in 2007 compared to 2022 (Table 1) and thus also in a significant decrease of the signal-to-noise ratio for all 2007 pn spectra. We note that neglecting such an important pile-up effect would considerably impact the spectral analysis, for example, by producing an artificial ‘harder when brighter’ X-ray behaviour of the source. All background spectra were extracted from a rectangular region that contains no (or negligible) source photons. Total and net exposure times of the pn (obtained after correction for dead time and background flaring) are reported in Table 1. All redistribution matrix files (rmf) and ancillary response files (arf) were generated with the SAS tasks RMFGEN and ARFGEN, and they were binned in order to oversample the instrumental resolution by at least a factor of four, with no impact on the fit results. For the arf calculation, the recent option APPLYABSFLUXCORR = yes was applied, which allows for a correction of the order of 6–8% between 3 and 12 keV in order to reduce differences in the spectral shape between XMM-Newton-pn and NuSTAR spectra (F. Fürst 2022, XMM-CCF-REL-388, XMM-SOC-CAL-TN-0230)1. Finally, the background-corrected pn spectra were binned to have a signal-to-noise ratio greater than four in each spectral channel.
Figure 1 displays the 0.3–2 keV (top panel) and 2–10 keV (middle panel) pn count rate light curves during the 2022 campaign. The light curves were built using the epiclccorr SAS tool. A smooth decrease, most prominent in the soft X-ray band, of the source flux can be observed during the first half of the observation. However, there is only very little variation in the hard/soft ratio (bottom panel), mainly in the first 20 ks, where the AGN displays a slight ‘softer when brighter’ behaviour. Performing a simplified modelling of the pn spectra during the ‘high’ and ‘low’ fluxes, we found that the variability is solely driven by the flux change since no significant spectral shape variability is observed. The light curves for the four 2007 XMM-Newton-pn observations are reported in Fig. A.1. Even if in the first and third observations a notable count rate variability can be observed, the hardness ratio indicates no significant spectral variability during each observation. In this work, we used the time-averaged pn spectra for each epoch.
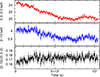 |
Fig. 1. XMM-Newton-pn light curves of ESO 141–G55 from 2022 with time bins of 500 s in the 0.3–2 keV (top panel) and 2–10 keV (middle panel) energy ranges and the corresponding hardness ratio, 2–10 keV/0.3–2 keV (bottom panel). |
The RGS spectra of ESO 141−G55, for the 2022 and the 2007#4 observations were reprocessed and analysed. The individual RGS 1 and RGS 2 spectra at each epoch were combined into a single merged spectrum using the SAS task RGSCOMBINE. This resulted in a total count rate from the combined RGS spectrum at each epoch of 1.288 ± 0.003 cts s−1 over an exposure time of 109.4 ks for 2022 and of 1.600 ± 0.005 cts s−1 over an exposure time of 79.3 ks for 2007#4. The spectra were binned to sample the RGS spectral resolution (den Herder et al. 2001) by adopting a constant wavelength binning of Δλ = 0.05 Å per spectral bin over the wavelength range from 6 to 36 Å. This binning also ensured a minimum signal-to-noise ratio per bin of ten over the RGS energy range, and thus χ2 minimisation was used for the spectral fitting procedure.
The UV data from the XMM-Newton Optical-UV Monitor (hereafter OM; Mason et al. 2001) were processed for the 2022 and 2007#4 observations using the SAS script OMICHAIN. This script takes into account all the necessary calibration processes (e.g. flat fielding) and runs a source detection algorithm before performing aperture photometry (using an extraction radius of 5.7″) on each detected source and combines the source lists from separate exposures into a single master list in order to compute the mean corrected count rates. In order to take into account the OM calibration uncertainty of the conversion factor between the count rate and the flux, we quadratically added a representative systematic error of 1.5%2 to the statistical error of the count rate (as done in Porquet et al. 2019, 2024).
2.2. NuSTAR data reduction
NuSTAR (Harrison et al. 2013) observed ESO 141-G55 with its two co-aligned X-ray telescopes with the corresponding focal plane modules A (FPMA) and B (FPMB) in July 2016 and October 2022 (see Table 1). The level 1 data products were processed with the NuSTAR Data Analysis Software (NuSTARDAS) package (version 2.1.2; February 16, 2022). Cleaned event files (level 2 data products) were produced and calibrated using standard filtering criteria with the NUPIPELINE task and the calibration files available in the NuSTAR calibration database (CALDB: 20230420). The extraction radii for the source and background spectra were 60″. The corresponding net exposure time for the observations with FPMA are reported in Table 1. The processed rmf and arf files are provided on a linear grid of 40 eV steps. As the full width at half maximum (FWHM) energy resolution of NuSTAR is 400 eV below ∼50 keV and increases to 1 keV at 86 keV (Harrison et al. 2013), we re-binned the rmf and arf files in energy and channel space by a factor of four to oversample the instrumental energy resolution by at least a factor of 2.5. The background-corrected NuSTAR spectra were finally binned in order to have a signal-to-noise ratio greater than four in each spectral channel. We allowed for cross-calibration uncertainties between the two NuSTAR spectra and the XMM-Newton-pn spectra by including in the fit a free cross-normalisation factor for the pair of NuSTAR FPMA (∼1.18) and FPMB (∼1.19) spectra with respect to the pn spectra.
2.3. Spectral analysis method
The XSPEC (v12.12.1) software package (Arnaud 1996) was used for spectral analysis. We used the X-ray absorption model TBNEW (VERSION 2.3.2) from Wilms et al. (2000), applying their interstellar medium (ISM) elemental abundances and the cross-sections from Verner et al. (1996). We used a χ2 minimisation throughout and errors were quoted with 90% confidence intervals for one interesting parameter (Δχ2 = 2.71). We assumed the default values of H0 = 67.66 km s−1 Mpc−1, Ωm = 0.3111, and ΩΛ = 0.6889 (Planck Collaboration VI 2020).
3. The X-ray broadband spectral analysis
To characterise the main X-ray components of the 2022 observation, we first fit the pn and NuSTAR spectra between 3 and 5 keV (AGN rest frame) using a power law with Galactic absorption with NH(Gal) = 5.7 × 1020 cm−2 as measured from the RGS spectral analysis (Sect. 3.1). We found a photon index of 1.93 ± 0.03 (χ2/d.o.f. = 119.4/119), consistent with BLS1s (Porquet et al. 2004; Zhou et al. 2010; Waddell & Gallo 2020; Gliozzi & Williams 2020). As illustrated in Fig. 2 (top panel), the fit extrapolation over the 0.3–79 keV energy range revealed a very prominent soft X-ray excess below 2 keV and, in the hard X-ray range, a significant well-resolved emission Fe Kα line and a Compton hump that both suggest a contribution from reflection.
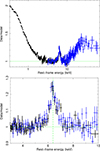 |
Fig. 2. Data-to-model ratio of the simultaneous 2022 XMM-Newton-pn (black) and NuSTAR (blue) spectrum of ESO 141-G55 fit with a Galactic (NH(Gal) = 5.7 × 1020 cm−2) absorbed power-law continuum model over the 3–5 keV energy range. Top panel: Extrapolation over the 0.3–79 keV broadband X-ray energy range. Bottom panel: Zoom-in on the Fe Kα line. The vertical dashed green line corresponds to 6.4 keV. |
3.1. Investigation into whether ESO 141-G55 was still in a bare state in 2022: The RGS data analysis
As suggested by the 2022 X-ray broadband CCD spectrum (Fig. 2 top panel), ESO 141-G55 displays an apparent smooth soft X-ray spectrum, as previously reported in the 2001 and 2007 XMM-Newton observations. Therefore, our aim is to probe any soft X-ray absorption and/or emission features at the AGN and Galactic rest frames through the use of the high-resolution RGS spectrum. The 2022 combined RGS spectrum was initially fitted by a simple neutral Galactic (z = 0) absorbed power-law model. The spectrum compared to this model is shown in Fig. 3 (top panel). The soft X-ray photon index obtained in the RGS energy band (of Γ = 2.28 ± 0.02) is much steeper compared to that obtained from the XMM-Newton and NuSTAR spectrum between 3 and 5 keV (Γ = 1.93 ± 0.03) due to the prominent soft X-ray excess present below 2 keV (Fig. 2 top panel). The neutral Galactic absorption column was measured to be NH(Gal) = 5.7 ± 0.2 × 1020 cm−2, just slightly higher than the predicted atomic H I column of NH(Gal) = 5.0 × 1020 cm−2 from 21 cm measurements (Kalberla et al. 2005), where the additional Galactic column could arise from molecular hydrogen (Willingale et al. 2013). Throughout this work, NH(Gal) was fixed to 5.7 ± 0.2 × 1020 cm−2.
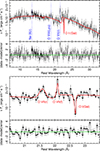 |
Fig. 3. RGS spectrum of ESO 141-G55 from 2022. Top panel: Fluxed spectrum over the full RGS bandpass. The solid red line corresponds to the baseline absorbed power-law continuum, and the vertical dotted lines mark the wavelengths of the emission lines. Bottom panel: Zoom-in on the O VII emission band (binning of Δλ = 0.1 Å). The broad component at 21.6 Å corresponds to the resonance line, and the narrow component at 22.1 Å corresponds to the forbidden line. The O I absorption line is due to our Galaxy. |
Although the absorbed power-law model provided an adequate description of the continuum over the RGS band, the overall fit statistic is relatively poor (χ2/d.o.f. = 784.8/618). An excess of emission is present in the spectral residuals near 21.6 Å in the AGN rest frame at the ∼5σ level, while two weaker excesses (at ∼3σ) are also present at 18.9 Å and 13.4 Å (Fig 3, upper panel). The rest-frame wavelengths coincide with the line emission of O VII for the stronger emission at 21.6 Å and with O VIII and Ne IX for the two weaker and shorter wavelength lines, respectively. To fit the emission, four Gaussian emission lines were added to the model, two of which are required to fit the O VII triplet emission, while single Gaussian components are adequate for the likely O VIII and Ne IX emission. The addition of the Gaussian lines significantly improved the fit statistic to χ2 = 709.6/608, while the best-fit line parameters are listed in Table 2.
Soft X-ray emission lines in the ESO 141-G55 rest frame observed in the 2022 RGS spectrum.
Figure 3 (bottom panel) shows a zoom-in around the O VII emission band, illustrating the two possible components of emission. The strongest feature statistically speaking (Δχ2 = 36.6 for three additional parameters) occurs at 21.60 ± 0.04 Å (574.1 ± 1.1 eV), corresponding to the expected laboratory frame wavelength of the O VII resonance line (e.g. Porquet et al. 2001). This line is broadened, with a fitted width of σ = 2.5 eV, corresponding to an FWHM velocity width of 3100
 km s−1, which is consistent with the Hα, Hβ, and Lyα line widths of 3010 km s−1; 3730 km s−1 (Stirpe 1990); and 3500 km s−1 (Turler & Courvoisier 1998), respectively, emitted by the broad-line region (BLR) but slightly smaller than the C IV line width (5250 km s−1; Turler & Courvoisier 1998).
The second O VII emission component occurs at 22.1 ± 0.1 Å (561.5 eV) and appears to be narrow, arising from just a single resolution bin in the RGS spectrum (see Fig. 3, bottom panel). It is statistically weaker (with Δχ2 = 5.7 for two additional parameters). If confirmed, this is likely to be associated with the emission of the forbidden line at an expected wavelength of 22.1 Å. As the line is not resolved, only an upper limit can be placed on its width, namely σ < 1 eV. Moreover, the lack of an intercombination line would point to an emitting region with a density lower than about 109 cm−3, which corresponds to the critical density value for O VII (Porquet & Dubau 2000; Porquet et al. 2010). Therefore, this narrow O VII emission component could be associated with a region located farther out, such as the narrow-line region (NLR). Finally, we note that the Ne IX emission is broadened (see Table 2), with a velocity width consistent with the O VII line (although less well determined), and its centroid wavelength is also consistent with the resonance line emission. In contrast, the H-like O VIII line appears unresolved. No other emission lines are detected in the RGS spectrum.
The RGS spectrum does not show strong absorption lines against the continuum, apart from the expected O I neutral absorption line associated with our Galaxy (e.g. Fig. 3, bottom panel). Nonetheless, we attempted to place limits on the column and ionisation of any warm absorbing gas associated with ESO 141-G55 or its host galaxy. To this end, an XSTAR (Kallman & Bautista 2001) multiplicative photoionised absorption table was added to the model, adopting a host galaxy redshift of z = 0.0371 and covering a range of ionisation from log ξ = −1.5 to 3.5 and for a turbulence velocity of 200 km s−1. The absorption column decreased to the lowest allowed column calculated in the XSTAR grid (of NH = 8 × 1019 cm−2) and the highest possible ionisation (log ξ = 3.5). Such an absorber does not produce any measurable absorption lines in the RGS spectrum or improve the fit statistic, given the very low opacity of the absorber. Formally, an upper limit to the column of NH < 4 × 1020 cm−2 was obtained and a corresponding lower limit to the ionisation parameter of log ξ > 2.9 was also obtained. Thus, there is no significant warm-absorbing gas in our line of sight towards this AGN, which is consistent with its classification as a bare Seyfert 1 galaxy.
3.2. Characterisation of the Fe Kα emission complex
To determine the origin of the Fe Kα complex (Fig. 2 bottom panel), we fit the 2022 pn spectrum between 3 and 10 keV with a Galactic absorbed power-law, adding two Gaussian lines: one broad component whose energy and width is allowed to vary as the main profile is well resolved and one narrow unresolved core component (E = 6.40 keV, σ = 0 eV) to account for possible neutral reflection from the outer BLR and/or molecular torus, as suggested by the Fe Kα peak line profile. The narrow core component was found to have a low equivalent width (EW) of 30 ± 10 eV, while the broad component (at 6.46 ± 0.09 keV) has a much larger EW of 140 ± 30 eV (χ2/d.o.f. = 382.9/343). The broad line width is σ = 450 eV, corresponding to an FWHM of 50 000
 km s−1. This line component is much broader than expected from the BLR (∼3000 km s−1, Sect. 3.1), pointing out that it originates from the accretion disc (Fig. 4). Therefore, we replaced the broad Gaussian line with a relativistic line profile using RELLINE (Dauser et al. 2010). The black hole spin was fixed to zero since it was not otherwise constrained by the model. We fixed the disc emissivity index value (q; with emissivity ∝R−q) to the canonical value of three and allowed the inner radius of relativistic reflection to vary, that is to say, Rin was no longer set by default to the inner stable circular orbit (ISCO). The line EWs are 180 ± 30 eV and 41 ± 9 eV for the relativistic line and the narrow line, respectively (χ2/d.o.f. = 374.9/343). We measured a disc inclination of θ = 43
 degrees, which is consistent with the value inferred from accretion disc fits to the UV continuum and the Hβ emission line for a non-spinning black hole (Rokaki & Boisson 1999). The inner radius value inferred from the relativistic reflection component, Rin = 11
 Rg, was found to be insensitive to the black hole spin value, which indicates that relativistic reflection occurs in the inner part of the accretion disc but not down to ISCO.
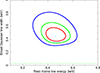 |
Fig. 4. Contour plot of the broad Gaussian line width (keV) versus its rest-frame energy (keV). The red, green, and blues curves show the confidence levels at 68% (Δχ2 = 2.3), 90% (Δχ2 = 4.61) and 99% (Δχ2 = 9.21), respectively. The horizontal dashed green line corresponds to an FWHM width of ∼3000 km s−1 (BLR). |
3.3. Search for an ultra-fast outflow signature and comparison with the 2007 XMM-Newton observations
As previously mentioned, a significant possible wind signature for ESO 141-G55 was reported on October 30, 2007 (2007#4). We then attempted to place limits on the presence of any UFO signature located in the Fe Kα energy band during the 2022 XMM-Newton observation. The 2022 pn spectrum was fitted with a Galactic absorbed power law by adding an xstar absorption table with a turbulence velocity of 1000 km s−1. The outflow velocity (vout) was allowed to vary between 0 and 0.3 c, and the ionisation parameter (log ξ) was varied over the range from three to five; these values are typical of other UFOs from photoionisation modelling (e.g. Tombesi et al. 2010; Gofford et al. 2015). The addition of a fast absorber did not improve the fit statistics, and only upper limits were found. For example, an upper limit to the column density of NH < 7 × 1021 cm−2 was found for an ionisation of log ξ = 3.5, with somewhat higher column densities allowed for a higher ionisation parameter, such as NH < 2 × 1022 cm−2 for log ξ = 4. Therefore, there is no evidence for the presence of UFOs in this 2022 very high signal-to-noise ratio X-ray spectrum of ESO 141-G55.
To provide a direct comparison between the 2022 and the 2007#4 observations, we reprocessed the 2007#4 pn spectra using the same calibration as used for the 2022 observation, but we used an annular extraction region to minimise the pile-up effect (see Sect. 2.1 for more details). The 2022 and 2007#4 pn observations were fitted over the 3–10 keV band with a Galactic absorbed power-law, adding two Gaussian (broad and narrow) line components with the same parameters as for the 2022 spectrum, to fit the Fe Kα emission. Figure 5 displays the residuals of both spectra, where the position of the absorption line is marked by a dotted line. This confirms that, as previously found by De Marco et al. (2013), the 2007 absorption feature stands out at about 4σ below the continuum, while there is nothing apparent at a similar energy in the 2022 observation. When fitting the absorption feature with a narrow Gaussian (σ = 10 eV) of negative normalisation, an EW of 77 ± 28 eV was found in the 2007#4 spectrum and a very small upper limit of < 6 eV in the 2022 data, assuming that it occurs at the same rest-frame energy of 8.34 ± 0.05 keV. The improvement in fit statistic for the 2007#4 feature is Δχ2 = 23.4. For the combined pn spectrum of the other three shorter 2007 observations performed between October 9 and 12, 2007 (Table 1), we measured an upper limit of the EW of < 48 eV for the absorption feature, assuming the same centroid energy as above. This is just barely inconsistent with the detection in the 2007#4 pn spectrum at the 90% confidence level. The absorption feature present in the 2007#4 spectrum was then modelled with the XSTAR absorber applied previously to the 2022 spectrum. The best fit of the UFO properties are NH = 3.8 × 1023 cm−2, log ξ = 4.5
 , and vout = −0.176 ± 0.006 c. In the case of ESO 141-G55, the absorption arises purely from Fe XXVI. Compared to the same velocity and ionisation as above, the upper limit to the column density for the 2022 observation is NH < 1.7 × 1022 cm−2, which is about an order of magnitude below what was found in the 2007#4 observation.
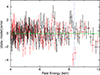 |
Fig. 5. Fit of the 2022 (black) and 2007#4 (red) 3−10 keV XMM-Newton-pn observations with a Galactic power-law plus two Gaussian lines: one broad and one narrow (see text). The 2007#4 spectrum displays an absorption feature (dotted line) at about 4σ below the continuum, while there is nothing apparent at a similar energy in the 2022 observation. |
3.4. The very hot corona and relativistic reflection properties at two epochs (2022 and 2016)
To determine the hot corona and relativistic reflection properties of ESO 141-G55, we focused on its hard X-ray shape using the simultaneous 2022 XMM-Newton and NuSTAR data above 3 keV to prevent the fit from being driven by the soft X-ray emission. We also included in this study, the previous NuSTAR observation of ESO 141-G55 performed in 2016 (Table 1; Ezhikode et al. 2020; Panagiotou & Walter 2020; Akylas & Georgantopoulos 2021; Kang & Wang 2022) in order to check for any variation in the temperature of the hot corona between the two epochs.
A simple power-law (Γ) continuum with an exponential cut-off at high energy (Ecut) and a broad Gaussian line cannot reproduce the Compton hump shape due to relativistic reflection on the accretion disc (Δχ2/d.o.f. = 1724.0/1197). Therefore, we considered the physical model REFLKERRD3 (version 2019; Niedźwiecki et al. 2019), which includes both the hot corona and relativistic reflection components. The reflection fraction ℛ is defined as the amount of reflection Ω/(2*π). We used a primary Comptonisation continuum shape, which is more physical and has a sharper high-energy roll-over compared to an exponential cut-off power law. Furthermore, such a model has the advantage of directly measuring the hot corona temperature (kThot). We note that previously only the cut-off energy was measured using the 2016 NuSTAR observation (Ezhikode et al. 2020; Panagiotou & Walter 2020; Akylas & Georgantopoulos 2021; Kang & Wang 2022). The hard X-ray shape of the reflected component of REFLKERRD was calculated using IREFLECT (the xspec implementation of the exact model for Compton reflection of Magdziarz & Zdziarski 1995 in the hard X-ray range) convolved with COMPPS. The COMPPS model (Poutanen & Svensson 1996) appears to be a better description of thermal Comptonisation than NTHCOMP (Zdziarski et al. 1996; Życki et al. 1999) when compared to Monte Carlo simulations (Zdziarski et al. 2020). In Appendix B, for comparison we report the fit results for the RELXILLCP models for which the hard Comptonisation (hot corona) X-ray shape is instead calculated using the NTHCOMP model.
We assumed a slab geometry for the hot corona with a single power-law disc emissivity index (q; with emissivity ∝R−q) that was allowed to vary. Indeed, a slab-like geometry seems to be favoured by X-ray spectro-polarimetry observations of AGN by the Imaging X-ray Polarimetry Explorer (IXPE; e.g. Gianolli et al. 2023). However, assuming a lamppost geometry gave similar results for the present study (Appendix B). Here, we allowed the disc emissivity index to vary and set the radius of the inner disc to the ISCO since it is not otherwise constrained due to the degeneracy between both parameters. This emissivity index value was later compared to the value required when fitting the whole 0.3–79 keV energy range. Since the spin value is not constrained, it was fixed at zero. We checked that assuming other spin values did not impact our results. The temperature of the thermal seed photons (kTbb) Comptonised by the hot corona is an explicit physical parameter of this model. We fixed it to 10 eV, corresponding to the expected maximum temperature of the accretion disc around a black hole mass of ∼1.3 × 10⁸ M⊙ accreting at a ∼10% Eddington rate. To take into account the unresolved (weak) core of the Fe Kα complex (Sect. 3.2), a narrow Gaussian line was added at 6.4 keV, as done in Sect. 3.2. We note that similar parameter values for the REFLKERRD model are inferred if a molecular torus model, such as BORUS12 (Baloković et al. 2018, 2019), is used instead of a narrow Gaussian line. Indeed, the narrow core of the Fe Kα component is weak for ESO 141-G55, meaning that any associated reflection contribution to the hard X-ray spectrum is negligible. We tied between both epochs the inclination angle and the iron abundance of the disc, which are not supposed to vary on year timescales. Moreover, the emissivity indices between both epochs were tied since they are found to be compatible. We found a good fit (Fig. 6) with the best-fit parameters reported in Table 3. Although the main value of the reflection fraction is higher in 2022, the increase is only at a 1.6σ confidence level when taking into account the error bars. The hot corona has consistent temperatures at both epochs (kThot ∼ 120 − 140 keV) within their error bars and was found to be optically thin (τhot ∼ 0.3 − 0.4).
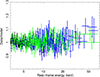 |
Fig. 6. Data-to-model ratio of the fit above 3 keV of the 2022 simultaneous XMM-Newton (black) and NuSTAR (blue) spectrum and of the 2016 NuSTAR (green) spectrum using the REFLKERRD relativistic reflection model with a primary Comptonisation continuum shape. |
The extrapolation of the 2022 fit down to 0.3 keV shows that the soft X-ray excess is not accounted for with relativistic reflection alone, leaving a huge positive residual below ∼2 keV (Fig. 7 top panel, χ2/d.o.f. = 96 229/924). We note that due to the lack of simultaneous XMM-Newton data in 2016 such an extrapolation was not possible. We then applied this model to the whole 0.3–79 keV X-ray range of the 2022 spectrum, here allowing for a broken power-law emissivity where q1 is the emissivity index at r < Rbr and q2 is the emissivity index at r > Rbr. The term Rbr is the breaking radius and is expressed in gravitational radius. The spin and the disc density values were free to vary. Though the χ2 value drastically decreases (χ2/d.o.f. = 1436.4/920), this model fails to both reproduce the soft and hard X-ray shapes (Fig. 7 lower panel). Indeed, the broadband fit is driven by the soft X-ray data, for which a very steep disc emissivity, q ∼ 7.8 below about 8 Rg, and a much higher reflection fraction, ℛ ∼ 4.3, would be required in order for relativistic reflection to reproduce it alone, contrary to the hard X-ray excess requiring q ∼ 2.0 and ℛ ∼ 0.8. We note that similar results are found for the RELXILLCP model (Dauser et al. 2013), as reported in Appendix B.
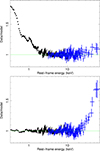 |
Fig. 7. Fits of the 2022 simultaneous XMM-Newton-pn (black) and NuSTAR (blue) spectrum of ESO 141-G55 with the REFLKERRD model. Top panel: Fit above 3 keV (Fig. 6, Table 3), which has been extrapolated down to 0.3 keV. Bottom panel: Fit over the entire 0.3–79 keV energy range. Here, we allowed for a broken power-law emissivity and the spin and the disc density values were free to vary. |
4. Disc-corona properties: SED (UV to hard X-rays) spectral analysis using the RELAGN model
As shown in the previous section, the relativistic reflection is unable to reproduce both the soft X-ray excess and the hard X-ray shape. Therefore, we explored the hybrid scenario where Comptonisation from both a warm and hot corona and relativistic reflection are present, as found for Ark 120 (Matt et al. 2014; Porquet et al. 2018, 2019), Fairall 9 (Lohfink et al. 2016), TON S180 (Matzeu et al. 2020), and Mrk 110 (Porquet et al. 2021, 2024).
As a very first step, we tested whether the soft X-ray excess can originate from a warm corona using a simple modelling with the COMPTT model (Titarchuk 1994) for which a slab geometry was assumed. We still used the REFLKERRD model to account for the emission from both the hot corona and the relativistic reflection (Sect. 3.4). For the relativistic reflection component, we assumed a canonical value of three for the emissivity index, but we allowed the inner radius (expressed in Rg) to be free to vary. As the spin value was not constrained by this modelling, it was set to zero, without a noticeable impact on the results. As illustrated in Fig. 8, this very simple modelling can broadly fit the X-ray spectrum, indicating that an optically thick warm corona (with kTwarm ∼ 0.3 keV and τwarm ∼ 12) could indeed explain the prominent soft X-ray excess in ESO 141-G55. The best fit parameters are reported in Table 4. The inner radius of the relativistic reflection of about 20 Rg, consistent within the error bars with the value found from the Fe Kα line study (Sect. 3.2), confirms that it occurs in the inner part of the disc-corona system but not down to ISCO.
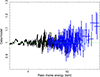 |
Fig. 8. Fit of the 2022 0.3–79 keV simultaneous XMM-Newton-pn (black) and NuSTAR (blue) spectrum of ESO 141-G55 using a simplistic hybrid model combining the COMPTT (warm corona) and REFLKERRD (hot corona and relativistic reflection) models (see Sect. 4 for details). |
Next, our aim was to determine with a more physical approach the properties of the disc-corona system of ESO 141-G55 using its spectral energy distribution (SED) from UV to hard X-rays. For this, we used the new RELAGN model, which is based on the AGNSED code of Kubota & Done (2018) but incorporates general relativistic ray tracing (Hagen & Done 2023a). The model consists of an inner hot corona (RISCO ≤ R ≤ Rhot), a warm Comptonised disc (Rhot ≤ R ≤ Rwarm), and an outer standard disc (Rwarm ≤ R ≤ Rout). An illustration of this disc-corona geometry is displayed in Fig. 2 from Kubota & Done (2018). The model parameters of RELAGN are nearly identical to those of AGNSED except that an additional parameter allows for a colour temperature correction to the standard outer disc (fcol). In AGNSED, the colour temperature correction is hardwired at unity. A detailed description of the RELAGN model is provided in Hagen & Done (2023a). As shown in the previous section, since a relativistic reflection is definitively present – but not included in the RELAGN model – we also added the REFLKERRD model. The emissivity indices were both fixed to the canonical value of three. The inner radius of the relativistic reflection component was set to the Rhot radius since the disc is truncated below this value. We also included the contribution of the weak narrow core of the Fe Kα line using a narrow Gaussian line, as done in Sect. 3.2. Our baseline model is TBNEW×REDDEN(RELAGN+REFLKERRD+ZGAUSSIAN).
Only the three shortest-wavelength UV filters with the OM (UVW2, UVM2, UVW1; effective wavelengths: 2120, 2310, 2910 Å, respectively) were used, as contamination by the host galaxy is negligible in these bands. The Galactic reddening value, E(B − V), of ESO 141-G55 is 0.096 (Schlafly & Finkbeiner 2011). For the colour correction of the outer disc, we applied the relation from Done et al. (2012) by setting the fcol parameter model to a negative value. The height of the vertical scale of the hot corona (hmax in Rg) was tied to the radius of the hot corona (Rhot). Since the SED fit is driven by the UV and soft X-ray data, we fixed the hot coronal temperature to 136 keV, which is robustly inferred from the fit above 3 keV (Sect. 3.4). We set the distance of ESO 141-G55 to 163.6 Mpc (Wright 2006; Planck Collaboration VI 2020), and its black hole mass to 1.3 × 10⁸ M⊙ (Rokaki & Boisson 1999). The inclination of the accretion disc was free to vary.
We obtained a satisfactory fit from UV to hard X-rays with the values of the physical parameters reported in Table 5, confirming a moderate Eddington accretion rate for ESO 141-G55 of approximately 12%. The warm corona temperature, kTwarm = 0.32 keV, is similar to that found when using the simplified COMPTT model above. The intermediate value for the inclination angle of the disc, ∼43°, is consistent with that found from the X-ray spectral analysis above 3 keV (∼44°, Sect. 3.4). The value for Rhot of 17 Rg corresponding to the inner radius of the disc-corona system is in very good agreement with the inner radius where relativistic reflection occurs as inferred from the Fe Kα profile (Sect. 3.2). The extension of the warm corona is about 2.5 times that of the hot corona. From this best-fit model, an upper limit of 0.2 was found for the black hole spin based on the classical Δχ2 = 2.706 criteria.
We checked whether different values of the spin can actually be definitively excluded or can be considered as unlikely by fixing it to values of 0, 0.5, 0.7, 0.9, 0.95, and 0.998. As shown in Table 6, the value of χ2 (d.o.f. = 924) increases with increasing spin value by about Δχ2 = +170 for a maximal spinning black hole. For a = 0.90, Δχ2 is only +38, but the corresponding inclination of the disc is no longer consistent with the value inferred from the fit of the Fe Kα relativistic line (Sect. 3.2) and from the fit above 3 keV, where the hot corona and the relativistic reflection dominate (Sect. 3.4). This is even more pronounced at a = 0.998, where the inclination angle tends to the minimal value allowed by the REFLKERRD model, that is, 9.1°. Therefore, we found spin values above about 0.9 to be very unlikely for the disc-corona system of ESO 141-G55. Figure 9 displays the data-model ratio of the fit for a non-spinning black hole (a = 0, top-left panel) and a maximal spinning black hole (a = 0.998, top-right panel), and it shows how the UV data are badly fitted for a maximal black hole spin. This is illustrated in the lower panels of Fig. 9, where the SED shapes corresponding to a non-spinning black hole (a = 0, Fig. 9 is bottom-left) and a maximal spinning black hole (a = 0.998 is bottom-right) are displayed. For a = 0.998, the peak emission of the outer disc (starting at Rwarm) shifts to a higher energy (or, in other words, it has a higher temperature) compared to a = 0, which is caused by the decrease of both the hot and warm corona radii. This is due to the energy balance used in RELAGN. Indeed, as the black hole spin increases, Rhot must decrease in order to account for the higher emitting area (due to the decrease of the ISCO) and higher accretion efficiency. This leads to a necessary decrease in Rwarm (Hagen & Done 2023a).
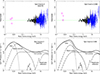 |
Fig. 9. SED fits from UV to hard X-rays of ESO 141-G55 using the RELAGN+REFLKERRD baseline model for the 2022 simultaneous XMM-Newton (pn: black; OM: magenta) and NuSTAR (blue) data, fixing the black hole spin to zero (left panels) and to 0.998 (right panels). The values of the best-fit parameters are reported in Table 6. Top panels: Data-to-model ratio. Bottom panels: Intrinsic SED corrected for reddening and Galactic absorption (solid curves), with the main individual emission components: outer disc (dotted curves), warm optically thick Comptonisation (dashed curves; warm corona), hot optically thin Comptonisation (dotted-dashed curves; hot corona), and relativistic reflection (three-dotted-dashed curves). For clarity, the weak narrow Gaussian line component is not displayed. |
Simultaneous SED fits of the 2022 simultaneous XMM-Newton-pn and NuSTAR spectra of ESO141-G55 with the baseline model RELAGN+REFLKERRD for different fixed black hole spin values.
5. Summary and discussion
We have presented the first ever broadband X-ray and SED analysis of the bright X-ray bare AGN ESO 141-G55 based on the simultaneous observation with XMM-Newton and NuSTAR performed on October 1−2, 2022. This XMM-Newton observation used the small window mode for the pn camera, which prevents pile-up for this bright X-ray source, in contrast to previous observations performed in 2001 and 2007 that suffer from very strong pile-up caused by the choice of the full frame window mode. Furthermore, the 2022 XMM-Newton and NuSTAR observation (∼124 ks) provides the highest signal-to-noise ratio so far for ESO 141-G55, from 0.3 to 79 keV. The simultaneous X-ray broadband spectrum of ESO 141-G55 is characterised by the presence of a prominent (absorption-free) smooth soft X-ray excess, a broad Fe Kα emission line, and a significant Compton hump.
5.1. Presence of warm gas outside our line of sight
The 2022 high-resolution XMM-Newton RGS spectra confirmed the lack of intrinsic warm-absorbing gas associated with ESO 141-G55, apart from the expected neutral absorption O I line associated with our Galaxy (Gondoin et al. 2003; Fang et al. 2015; Gatuzz et al. 2021). Therefore, ESO 141-G55 can still be classified as a bare AGN during this 2022 observation, with an upper limit of 4 × 1020 cm−2 for the column density of any warm absorbing gas in the AGN rest frame in our line of sight. Nevertheless, we report the presence of several soft X-ray emission lines in the RGS spectrum, associated with the AGN and arising from the He- and H-like ions of oxygen and neon. In particular, the He-like resonance line profiles of O VII and Ne IX appear to be velocity broadened, with a typical FWHM of ∼3000–4000 km s−1 consistent with optical-UV BLR lines, while the profile of the forbidden O VII line is unresolved and could be associated with a farther out region, such as the NLR. We note that the 2007#4 RGS spectrum (the longest 2007 observation, Table 1) is similar to that of 2022, with the presence of a broad resonance line and a narrow forbidden line from O VII (Fig. A.2). This adds evidence that bare AGNs are not intrinsically bare and that substantial X-ray-emitting gas is present but outside of the direct line of sight toward them, as also reported for the two prototype bare AGN Ark 120 (Reeves et al. 2016) and Fairall 9 (Emmanoulopoulos et al. 2011; Lohfink et al. 2016). We note that the presence of the resonance line would suggest a significant contribution of photoexcitation (Sako et al. 2000; Kinkhabwala et al. 2002; Porquet et al. 2010). Enhancement of the intensity of the broad O VII resonance line only (with no broad forbidden and/or intercombination lines observed) in a photoionised environment by continuum pumping would point to an emitting region with a column density of ∼1022–1023 cm−2 and a high ionisation parameter ξ, on a log scale, of ∼2–2.5 (Chakraborty et al. 2022), which is similar, for example, to a highly ionised gas located in the base of a radiatively driven disc wind at the outer BLR (Risaliti et al. 2011; Mehdipour et al. 2017). An alternative origin from a collisional plasma cannot be definitively ruled out, such as signatures from shocked outflowing gas, hot circumnuclear gas, and/or star-forming activity (Guainazzi et al. 2009; Pounds & Vaughan 2011; Braito et al. 2017; Grafton-Waters et al. 2021; Buhariwalla et al. 2023). However, in the collisional plasma scenario, the lack of any corresponding (broad) forbidden and/or intercombination line would be difficult to explain, since the (forbidden+intercombination)/resonance line ratio is expected to be about unity (Porquet et al. 2001, 2010). The quality of the present RGS data prevented us from discriminating between photoionised and collisional plasma as well as from probing resonance scattering through, for example, the detection of radiative recombination continua (RRC), Fe L (e.g. Fe XVII) emission line ratio and/or high order (n > 2) series emission lines (Hatchett et al. 1976; Liedahl et al. 1990; Kallman et al. 1996; Liedahl 1999; Sako et al. 2000; Kinkhabwala et al. 2002; Guainazzi & Bianchi 2007; Porquet et al. 2010). Only much higher signal-to-noise RGS spectra and/or observations with future soft X-ray spatial missions, such as the Line Emission Mapper (LEM) (Kraft et al. 2022), Arcus (Smith et al. 2016) and the Hot Universe Baryon Surveyor (HUBS; Bregman et al. 2023, would allow us to determine the origin of the O VII and Ne IX broad resonance lines in ESO 141-G55.
5.2. A possible sporadic UFO in ESO 141-G55
The intermediate inclination of the ESO 141-G55 disc-corona system, θ ∼ 43°, is a favourable configuration to intercept a possible disc wind, as suggested by the previous 2001 and 2007 XMM-Newton observations (Sect. 3.3). We therefore checked for a possible UFO signature in the high signal-to-noise observation of 2022, but we found no evidence for such a wind. In order to provide a direct and homogeneous comparison between the 2022 and the 2007 dataset, we reprocessed and reanalysed the 2007 pn spectrum as detailed in Sect. 3.3. We confirmed the presence, as first reported by de Marco et al. (2009), of a narrow absorption feature during the October 30, 2007 observation (2007#4) at 8.34 ± 0.05 keV and with an EW of 77 ± 28 eV. By modelling it with an XSTAR absorber, we inferred the following properties for the 2007#4 UFO: NH = 3.8 cm−2, log ξ = 4.5
 and an outflow velocity vout = −0.176 ± 0.006 c. These parameters are typical of other UFOs found in many AGNs (e.g. Tombesi et al. 2010; Gofford et al. 2013; Matzeu et al. 2023).
In the case of ESO 141-G55, the absorption arises purely from Fe XXVI, and thus it originates from very highly photoionised gas. In comparison, adopting the same velocity and ionisation as above, the upper limit to the column density for the 2022 observation is NH < 1.7 × 1022 cm−2, which is about an order of magnitude below what was found in the 2007#4 observation. It is worth noting that for the combined pn spectrum of the three shorter XMM-Newton observations performed between October 9 and October 12, 2007, which is only less than three weeks before the 2007#4 observation, only an EW upper limit of 48 eV was found for any UFO signature at the same energy. This could indicate a variable UFO on both short and long timescales in ESO 141-G55. Variable UFO signatures have been observed in other AGNs, such as PG 1211+143 (Reeves et al. 2018), PG 1448+273 (Reeves et al. 2023), and MCG-03-88-007 (Braito et al. 2022). Such a sporadic feature in ESO 141-G55, which has a moderate Eddington accretion rate, could be explained by a failed disc wind in the line-driven scenario (Proga & Kallman 2004; Proga 2005; Giustini & Proga 2019), as observed, for example, in the lower flux states of NGC 2992 (Marinucci et al. 2020; Luminari et al. 2023) when the wind is not able to launch. The wind variability could also be due to the specific intermediate inclination angle of the system of ESO 141-G55, ∼43°, which may only intercept the edge of the wind near its opening angle, rather than viewing deeper into the wind. Then occasionally a denser wind clump could be present in our line of sight, resulting in a sporadic UFO signature rather than a more persistent disc wind, as seen in some of the higher inclination systems above.
Intriguingly, the X-ray fluxes during these different XMM-Newton observations were similar, with only about 20% variability, making it somewhat unlikely that the change in the opacity of the absorption feature is due to a significant change in ionisation, as observed for example in PDS 456 during a major X-ray flare in 2018 (Reeves et al. 2021). Furthermore, the SED shapes from the UV to 10 keV are comparable too, although the UV emission was slightly lower in 2007#4 (Fig. C.1). As an illustration, we report the SED analysis of the 2007#4 observation using the baseline RELAGN+REFLKERRD model in Appendix C, which displays very similar disc-corona properties compared to the 2022 one, and we observed that there are no drastic differences in the disc-corona properties (Table C.1). The appearance of this possible variable UFO signature in ESO 141-G55 does not seem to be related to some specific properties of the disc-corona system. Only further monitoring with adequate sampling from day-to-month timescales of this source will allow us to understand the UFO duty cycle and origin.
5.3. Relativistic reflection from the inner part of the accretion disc and weak contribution from the molecular torus
The observed significantly broad Fe Kα line (6.46 ± 0.09 keV) and the Compton hump suggest a significant contribution from reflection. The Fe Kα line width (FWHM ∼ 50 000 km s−1) points to an origin from the inner part of the accretion disc, ∼10 Rg, but not down to the ISCO. We find that the EW of the narrow Fe Kα component (∼40 eV) is in the lower range of the values found for type-1 AGNs (∼30–200 eV; Liu & Wang 2010; Shu et al. 2010; Fukazawa et al. 2011; Ricci et al. 2014). This is consistent with the small torus covering factor of about 10% or less for ESO 141-G55 that was inferred by Esparza-Arredondo et al. (2021) from an infrared and X-ray study. Such a weak Fe Kα narrow component can be due to the ‘X-ray Baldwin’ effect (also called the ‘Iwasawa-Taniguchi’ effect), that is, the anti-correlation between the EW of the narrow neutral core Fe Kα line and the X-ray continuum luminosity related to the decrease of the covering factor of the molecular torus with the X-ray luminosity (e.g. Iwasawa & Taniguchi 1993; Page et al. 2004; Bianchi et al. 2007; Shu et al. 2010; Ricci et al. 2014). Indeed, according to the relationship between the EW of the Fe Kα narrow core and the 2–10 keV AGN luminosity obtained from a large AGN sample by Bianchi et al. (2007), an EW of about 50 eV is expected for ESO 141-G55 (L(2−10 keV) = 1.1 × 1044 erg s−1). This has also been observed in many bright individual X-ray AGNs with low or high Eddington accretion rates, such as Mrk 110 (Porquet et al. 2019), IC 4329A (Tortosa et al. 2024), PDS 456 (Reeves et al. 2021), I Zw 1 (Reeves & Braito 2019), and PG 1448+273 (Reeves et al. 2023).
5.4. The disc-corona system: Presence of an optically thin very hot corona and an optically thick warm corona
The hot corona temperature (kThot ∼ 120 − 140 keV) does not vary significantly between the 2016 and 2022 NuSTAR observations, where the flux increases only by about 10%. The hot-corona temperature was found to be hotter than about 80% of the known Seyfert 1s (Lubiński et al. 2016; Middei et al. 2019; Akylas & Georgantopoulos 2021). An intermediate value for the inclination angle of the disc-corona system was found, ∼43°, using complementary fitting methods: Fe Kα line profile (Sect. 3.2), relativistic reflection emission above 3 keV (Sect. 3.4), and SED (Sect. 4). Moreover, it is similar to the value inferred from accretion disc fits to the UV continuum and the Hβ emission line, ∼42° for a non-spinning black hole (Rokaki & Boisson 1999), all indicating a similar inclination at different spatial scales of the accretion disc and thus no significant warp.
We found that relativistic reflection alone, albeit significant, cannot reproduce the simultaneous 2022 X-ray broadband spectra of ESO 141-G55, as also found for the bare AGNs Ark 120 (Matt et al. 2014; Porquet et al. 2018, 2019); TON S180 (Matzeu et al. 2020); and Mrk 110 (Porquet et al. 2024). Indeed, to reproduce the soft X-ray excess shape, both a higher relativistic reflection fraction and a much steeper emissivity index are required compared to the hard X-ray energy range. This reinforces once again the importance of considering the simultaneous X-ray broadband spectra up to 79 keV when determining the processes at work in the disc-corona system, especially for the origin of the soft X-ray excess (Matt et al. 2014; Porquet et al. 2018, 2021; Matzeu et al. 2020).
The SED (from UV to X-rays) is nicely reproduced by a model that combines the emission from a warm and hot corona and outer disc (RELAGN; Hagen & Done 2023a) with relativistic reflection (REFLKERRD; Niedźwiecki et al. 2019). The best fit points to an upper limit of 0.2 for the black hole spin (at the 90% confidence level). The SED fit becomes significantly worse, particularly in the UV domain, as the spin increases towards its maximum value. Furthermore, the inferred values of the inclination angles of the disc are no more compatible for a ≥ 0.9 with that found from the fit above 3 keV (see above). The Eddington accretion rate was found to be moderate at about 10−20% (depending on the black hole spin). The ratio of the UV and X-ray peak emission (∼factor of ten) for ESO 141-G55 is much higher than the one found for Mrk 110 (Porquet et al. 2024), but it is comparable to that of Fairall 9 (Hagen & Done 2023b) and Ark 120 (Porquet et al. 2019).
The temperature (kTwarm ∼ 0.34 keV) and optical depth (τwarm ∼ 12) of the warm corona inferred for ESO 141-G55 are similar to what was found for other low- to moderate-Eddington accretion AGNs, that is kTwarm ∼ 0.2 − 1 keV and τwarm ∼ 10 − 30 (e.g. Porquet et al. 2004, 2018, 2019; Porquet et al. 2024; Bianchi et al. 2009; Petrucci et al. 2013; Mehdipour et al. 2015; Matt et al. 2014; Middei et al. 2019; Ursini et al. 2020). The physical existence of such an optically thick warm corona is strengthened by several recent theoretical models of the disc-corona structure (Petrucci et al. 2018; Ballantyne 2020; Ballantyne & Xiang 2020; Gronkiewicz et al. 2023; Kawanaka & Mineshige 2024). Importantly, the warm corona scenario (mainly or totally) can account for the soft X-ray excess as well as for a significant contribution to the observed UV emission (in addition to the thermal disc emission) of ESO 141-G55 (Fig. 9, lower panels). This confirms previous studies reported for the SOUX AGN sample (Mitchell et al. 2023) and individual AGNs (e.g. Mrk 590: Mehdipour et al. 2011; Ark 120: Porquet et al. 2019; Fairall 9: Hagen & Done 2023b; and Mrk 110: Porquet et al. 2024). Moreover, it can naturally explain the simultaneous and significant dimming of both the UV and soft X-ray excess emission observed in some AGNs, such as ESO 511-G030 (Middei et al. 2023) and Mrk 841 (Mehdipour et al. 2023). The optically thick warm corona scenario seriously challenges the standard disc theory in AGNs.
The usage notes as well as the full description of the models and their associated parameters are reported at https://users.camk.edu.pl/mitsza/reflkerr/reflkerr.pdf
Acknowledgments
The authors thank the anonymous referee for useful and constructive comments. The paper is based on observations obtained with the XMM-Newton, an ESA science mission with instruments and contributions directly funded by ESA member states and the USA (NASA). This work made use of data from the NuSTAR mission, a project led by the California Institute of Technology, managed by the Jet Propulsion Laboratory, and funded by NASA. This research has made use of the NuSTAR Data Analysis Software (NuSTARDAS) jointly developed by the ASI Science Data Center and the California Institute of Technology. This research has made use of the SIMBAD database, operated at CDS, Strasbourg, France. This research has made use of the NASA/IPAC Extragalactic Database (NED) which is operated by the California Institute of Technology, under contract with the National Aeronautics and Space Administration. This work was supported by the French space agency (CNES). This research has made use of the computing facilities operated by CeSAM data centre at LAM, Marseille, France. SH acknowledges support from the Science and Technology Facilities Council (STFC) through the studentship ST/V506643/1.
References
- Akylas, A., & Georgantopoulos, I. 2021, A&A, 655, A60 [NASA ADS] [CrossRef] [EDP Sciences] [Google Scholar]
- Arnaud, K. A. 1996, ASP Conf. Ser., 101, 17 [Google Scholar]
- Ballantyne, D. R. 2020, MNRAS, 491, 3553 [NASA ADS] [CrossRef] [Google Scholar]
- Ballantyne, D. R., & Xiang, X. 2020, MNRAS, 496, 4255 [NASA ADS] [CrossRef] [Google Scholar]
- Baloković, M., Brightman, M., Harrison, F. A., et al. 2018, ApJ, 854, 42 [Google Scholar]
- Baloković, M., García, J. A., & Cabral, S. E. 2019, Res. Notes Am. Astron. Soc., 3, 173 [Google Scholar]
- Bianchi, S., Guainazzi, M., Matt, G., & Fonseca Bonilla, N. 2007, A&A, 467, L19 [NASA ADS] [CrossRef] [EDP Sciences] [Google Scholar]
- Bianchi, S., Guainazzi, M., Matt, G., Fonseca Bonilla, N., & Ponti, G. 2009, A&A, 495, 421 [NASA ADS] [CrossRef] [EDP Sciences] [Google Scholar]
- Boissay, R., Ricci, C., & Paltani, S. 2016, A&A, 588, A70 [NASA ADS] [CrossRef] [EDP Sciences] [Google Scholar]
- Braito, V., Reeves, J. N., Bianchi, S., Nardini, E., & Piconcelli, E. 2017, A&A, 600, A135 [EDP Sciences] [Google Scholar]
- Braito, V., Reeves, J. N., Matzeu, G., et al. 2022, ApJ, 926, 219 [NASA ADS] [CrossRef] [Google Scholar]
- Bregman, J., Cen, R., Chen, Y., et al. 2023, Sci. China Phys. Mech. Astron., 66, 299513 [NASA ADS] [CrossRef] [Google Scholar]
- Buhariwalla, M. Z., Gallo, L. C., Mao, J., et al. 2023, MNRAS, 521, 2378 [NASA ADS] [CrossRef] [Google Scholar]
- Chakraborty, P., Ferland, G. J., Chatzikos, M., et al. 2022, ApJ, 935, 70 [NASA ADS] [CrossRef] [Google Scholar]
- Cooke, B. A., Ricketts, M. J., Maccacaro, T., et al. 1978, MNRAS, 182, 489 [CrossRef] [Google Scholar]
- Crummy, J., Fabian, A. C., Gallo, L., & Ross, R. R. 2006, MNRAS, 365, 1067 [Google Scholar]
- Dauser, T., Wilms, J., Reynolds, C. S., & Brenneman, L. W. 2010, MNRAS, 409, 1534 [Google Scholar]
- Dauser, T., Garcia, J., Wilms, J., et al. 2013, MNRAS, 430, 1694 [Google Scholar]
- de Marco, B., Iwasawa, K., Cappi, M., et al. 2009, A&A, 507, 159 [NASA ADS] [CrossRef] [EDP Sciences] [Google Scholar]
- De Marco, B., Ponti, G., Cappi, M., et al. 2013, MNRAS, 431, 2441 [Google Scholar]
- den Herder, J. W., Brinkman, A. C., Kahn, S. M., et al. 2001, A&A, 365, L7 [NASA ADS] [CrossRef] [EDP Sciences] [Google Scholar]
- Done, C., Davis, S. W., Jin, C., Blaes, O., & Ward, M. 2012, MNRAS, 420, 1848 [Google Scholar]
- Elvis, M., Maccacaro, T., Wilson, A. S., et al. 1978, MNRAS, 183, 129 [NASA ADS] [Google Scholar]
- Emmanoulopoulos, D., Papadakis, I. E., McHardy, I. M., et al. 2011, MNRAS, 415, 1895 [NASA ADS] [CrossRef] [Google Scholar]
- Esparza-Arredondo, D., Gonzalez-Martín, O., Dultzin, D., et al. 2021, A&A, 651, A91 [NASA ADS] [CrossRef] [EDP Sciences] [Google Scholar]
- Ezhikode, S. H., Dewangan, G. C., Misra, R., & Philip, N. S. 2020, MNRAS, 495, 3373 [CrossRef] [Google Scholar]
- Fabian, A. C., Zoghbi, A., Wilkins, D., et al. 2012, MNRAS, 419, 116 [Google Scholar]
- Fang, T., Buote, D., Bullock, J., & Ma, R. 2015, ApJS, 217, 21 [NASA ADS] [CrossRef] [Google Scholar]
- Fukazawa, Y., Hiragi, K., Mizuno, M., et al. 2011, ApJ, 727, 19 [NASA ADS] [CrossRef] [Google Scholar]
- Gatuzz, E., García, J. A., & Kallman, T. R. 2021, MNRAS, 504, 4460 [NASA ADS] [CrossRef] [Google Scholar]
- Ghosh, R., & Laha, S. 2020, MNRAS, 497, 4213 [NASA ADS] [CrossRef] [Google Scholar]
- Gianolli, V. E., Kim, D. E., Bianchi, S., et al. 2023, MNRAS, 523, 4468 [NASA ADS] [CrossRef] [Google Scholar]
- Giustini, M., & Proga, D. 2019, A&A, 630, A94 [NASA ADS] [CrossRef] [EDP Sciences] [Google Scholar]
- Gliozzi, M., & Williams, J. K. 2020, MNRAS, 491, 532 [Google Scholar]
- Gliozzi, M., Papadakis, I. E., Grupe, D., Brinkmann, W. P., & Räth, C. 2013, MNRAS, 433, 1709 [NASA ADS] [CrossRef] [Google Scholar]
- Gofford, J., Reeves, J. N., Tombesi, F., et al. 2013, MNRAS, 430, 60 [Google Scholar]
- Gofford, J., Reeves, J. N., McLaughlin, D. E., et al. 2015, MNRAS, 451, 4169 [Google Scholar]
- Gondoin, P., Orr, A., & Lumb, D. 2003, A&A, 398, 967 [NASA ADS] [CrossRef] [EDP Sciences] [Google Scholar]
- Grafton-Waters, S., Branduardi-Raymont, G., Mehdipour, M., et al. 2021, A&A, 649, A162 [NASA ADS] [CrossRef] [EDP Sciences] [Google Scholar]
- Gronkiewicz, D., Różańska, A., Petrucci, P.-O., & Belmont, R. 2023, A&A, 675, A198 [NASA ADS] [CrossRef] [EDP Sciences] [Google Scholar]
- Guainazzi, M., & Bianchi, S. 2007, MNRAS, 374, 1290 [Google Scholar]
- Guainazzi, M., Risaliti, G., Nucita, A., et al. 2009, A&A, 505, 589 [NASA ADS] [CrossRef] [EDP Sciences] [Google Scholar]
- Hagen, S., & Done, C. 2023a, MNRAS, 525, 3455 [NASA ADS] [CrossRef] [Google Scholar]
- Hagen, S., & Done, C. 2023b, MNRAS, 521, 251 [NASA ADS] [CrossRef] [Google Scholar]
- Harrison, F. A., Craig, W. W., Christensen, F. E., et al. 2013, ApJ, 770, 103 [Google Scholar]
- Hatchett, S., Buff, J., & McCray, R. 1976, ApJ, 206, 847 [NASA ADS] [CrossRef] [Google Scholar]
- Iwasawa, K., & Taniguchi, Y. 1993, ApJ, 413, L15 [NASA ADS] [CrossRef] [Google Scholar]
- Kalberla, P. M. W., Burton, W. B., Hartmann, D., et al. 2005, A&A, 440, 775 [NASA ADS] [CrossRef] [EDP Sciences] [Google Scholar]
- Kallman, T., & Bautista, M. 2001, ApJS, 133, 221 [Google Scholar]
- Kallman, T. R., Liedahl, D., Osterheld, A., Goldstein, W., & Kahn, S. 1996, ApJ, 465, 994 [NASA ADS] [CrossRef] [Google Scholar]
- Kang, J.-L., & Wang, J.-X. 2022, ApJ, 929, 141 [NASA ADS] [CrossRef] [Google Scholar]
- Kawanaka, N., & Mineshige, S. 2024, PASJ, 76, 306 [CrossRef] [Google Scholar]
- Kinkhabwala, A., Sako, M., Behar, E., et al. 2002, ApJ, 575, 732 [Google Scholar]
- Kraft, R., Markevitch, M., Kilbourne, C., et al. 2022, ArXiv e-prints [arXiv:2211.09827] [Google Scholar]
- Kubota, A., & Done, C. 2018, MNRAS, 480, 1247 [Google Scholar]
- Liedahl, D. A. 1999, in X-Ray Spectroscopy in Astrophysics, eds. J. van Paradijs, & J. A. M. Bleeker, 520, 189 [NASA ADS] [CrossRef] [Google Scholar]
- Liedahl, D. A., Kahn, S. M., Osterheld, A. L., & Goldstein, W. H. 1990, ApJ, 350, L37 [Google Scholar]
- Liu, T., & Wang, J.-X. 2010, ApJ, 725, 2381 [NASA ADS] [CrossRef] [Google Scholar]
- Lohfink, A. M., Reynolds, C. S., Pinto, C., et al. 2016, ApJ, 821, 11 [CrossRef] [Google Scholar]
- Lubiński, P., Beckmann, V., Gibaud, L., et al. 2016, MNRAS, 458, 2454 [Google Scholar]
- Luminari, A., Marinucci, A., Bianchi, S., et al. 2023, ApJ, 950, 160 [NASA ADS] [CrossRef] [Google Scholar]
- Magdziarz, P., & Zdziarski, A. A. 1995, MNRAS, 273, 837 [Google Scholar]
- Magdziarz, P., Blaes, O. M., Zdziarski, A. A., Johnson, W. N., & Smith, D. A. 1998, MNRAS, 301, 179 [NASA ADS] [CrossRef] [Google Scholar]
- Marinucci, A., Bianchi, S., Braito, V., et al. 2020, MNRAS, 496, 3412 [NASA ADS] [CrossRef] [Google Scholar]
- Mason, K. O., Breeveld, A., Much, R., et al. 2001, A&A, 365, L36 [NASA ADS] [CrossRef] [EDP Sciences] [Google Scholar]
- Matt, G., Marinucci, A., Guainazzi, M., et al. 2014, MNRAS, 439, 3016 [NASA ADS] [CrossRef] [Google Scholar]
- Matzeu, G. A., Nardini, E., Parker, M. L., et al. 2020, MNRAS, 497, 2352 [CrossRef] [Google Scholar]
- Matzeu, G. A., Brusa, M., Lanzuisi, G., et al. 2023, A&A, 670, A182 [Google Scholar]
- Mehdipour, M., Branduardi-Raymont, G., Kaastra, J. S., et al. 2011, A&A, 534, A39 [NASA ADS] [CrossRef] [EDP Sciences] [Google Scholar]
- Mehdipour, M., Kaastra, J. S., Kriss, G. A., et al. 2015, A&A, 575, A22 [NASA ADS] [CrossRef] [EDP Sciences] [Google Scholar]
- Mehdipour, M., Kaastra, J. S., Kriss, G. A., et al. 2017, A&A, 607, A28 [NASA ADS] [CrossRef] [EDP Sciences] [Google Scholar]
- Mehdipour, M., Kriss, G. A., Kaastra, J. S., Costantini, E., & Mao, J. 2023, ApJ, 952, L5 [NASA ADS] [CrossRef] [Google Scholar]
- Middei, R., Bianchi, S., Petrucci, P. O., et al. 2019, MNRAS, 483, 4695 [NASA ADS] [CrossRef] [Google Scholar]
- Middei, R., Petrucci, P. O., Bianchi, S., et al. 2023, A&A, 672, A101 [NASA ADS] [CrossRef] [EDP Sciences] [Google Scholar]
- Mitchell, J. A. J., Done, C., Ward, M. J., et al. 2023, MNRAS, 524, 1796 [NASA ADS] [CrossRef] [Google Scholar]
- Niedźwiecki, A., Szanecki, M., & Zdziarski, A. A. 2019, MNRAS, 485, 2942 [CrossRef] [Google Scholar]
- Oh, K., Koss, M., Markwardt, C. B., et al. 2018, ApJS, 235, 4 [Google Scholar]
- Page, K. L., O’Brien, P. T., Reeves, J. N., & Turner, M. J. L. 2004, MNRAS, 347, 316 [NASA ADS] [CrossRef] [Google Scholar]
- Panagiotou, C., & Walter, R. 2020, A&A, 640, A31 [NASA ADS] [CrossRef] [EDP Sciences] [Google Scholar]
- Petrucci, P.-O., Paltani, S., Malzac, J., et al. 2013, A&A, 549, A73 [NASA ADS] [CrossRef] [EDP Sciences] [Google Scholar]
- Petrucci, P.-O., Ursini, F., De Rosa, A., et al. 2018, A&A, 611, A59 [NASA ADS] [CrossRef] [EDP Sciences] [Google Scholar]
- Planck Collaboration VI. 2020, A&A, 641, A6 [NASA ADS] [CrossRef] [EDP Sciences] [Google Scholar]
- Porquet, D., & Dubau, J. 2000, A&AS, 143, 495 [NASA ADS] [CrossRef] [EDP Sciences] [Google Scholar]
- Porquet, D., Mewe, R., Dubau, J., Raassen, A. J. J., & Kaastra, J. S. 2001, A&A, 376, 1113 [NASA ADS] [CrossRef] [EDP Sciences] [Google Scholar]
- Porquet, D., Reeves, J. N., O’Brien, P., & Brinkmann, W. 2004, A&A, 422, 85 [NASA ADS] [CrossRef] [EDP Sciences] [Google Scholar]
- Porquet, D., Dubau, J., & Grosso, N. 2010, Space Sci. Rev., 157, 103 [Google Scholar]
- Porquet, D., Reeves, J. N., Matt, G., et al. 2018, A&A, 609, A42 [NASA ADS] [CrossRef] [EDP Sciences] [Google Scholar]
- Porquet, D., Done, C., Reeves, J. N., et al. 2019, A&A, 623, A11 [NASA ADS] [CrossRef] [EDP Sciences] [Google Scholar]
- Porquet, D., Reeves, J. N., Grosso, N., Braito, V., & Lobban, A. 2021, A&A, 654, A89 [NASA ADS] [CrossRef] [EDP Sciences] [Google Scholar]
- Porquet, D., Hagen, S., Grosso, N., et al. 2024, A&A, 681, A40 [NASA ADS] [CrossRef] [EDP Sciences] [Google Scholar]
- Pounds, K. A., & Vaughan, S. 2011, MNRAS, 415, 2379 [NASA ADS] [CrossRef] [Google Scholar]
- Poutanen, J., & Svensson, R. 1996, ApJ, 470, 249 [CrossRef] [Google Scholar]
- Proga, D. 2005, ApJ, 630, L9 [NASA ADS] [CrossRef] [Google Scholar]
- Proga, D., & Kallman, T. R. 2004, ApJ, 616, 688 [Google Scholar]
- Reeves, J. N., & Braito, V. 2019, ApJ, 884, 80 [NASA ADS] [CrossRef] [Google Scholar]
- Reeves, J. N., Porquet, D., Braito, V., et al. 2016, ApJ, 828, 98 [NASA ADS] [CrossRef] [Google Scholar]
- Reeves, J. N., Lobban, A., & Pounds, K. A. 2018, ApJ, 854, 28 [Google Scholar]
- Reeves, J. N., Braito, V., Porquet, D., et al. 2021, MNRAS, 500, 1974 [Google Scholar]
- Reeves, J. N., Braito, V., Porquet, D., et al. 2023, ApJ, 952, 52 [NASA ADS] [CrossRef] [Google Scholar]
- Reynolds, C. S. 1997, MNRAS, 286, 513 [NASA ADS] [CrossRef] [Google Scholar]
- Ricci, C., Ueda, Y., Ichikawa, K., et al. 2014, A&A, 567, A142 [NASA ADS] [CrossRef] [EDP Sciences] [Google Scholar]
- Risaliti, G., Nardini, E., Salvati, M., et al. 2011, MNRAS, 410, 1027 [Google Scholar]
- Rokaki, E., & Boisson, C. 1999, MNRAS, 307, 41 [CrossRef] [Google Scholar]
- Sako, M., Kahn, S. M., Paerels, F., & Liedahl, D. A. 2000, ApJ, 543, L115 [Google Scholar]
- Schlafly, E. F., & Finkbeiner, D. P. 2011, ApJ, 737, 103 [Google Scholar]
- Shu, X. W., Yaqoob, T., & Wang, J. X. 2010, ApJS, 187, 581 [NASA ADS] [CrossRef] [Google Scholar]
- Smith, R. K., Abraham, M. H., Allured, R., et al. 2016, SPIE Conf. Ser., 9905, 99054M [Google Scholar]
- Stirpe, G. M. 1990, A&AS, 85, 1049 [NASA ADS] [Google Scholar]
- Strüder, L., Briel, U., Dennerl, K., et al. 2001, A&A, 365, L18 [Google Scholar]
- Titarchuk, L. 1994, ApJ, 434, 570 [NASA ADS] [CrossRef] [Google Scholar]
- Tombesi, F., Cappi, M., Reeves, J. N., et al. 2010, A&A, 521, A57 [NASA ADS] [CrossRef] [EDP Sciences] [Google Scholar]
- Tortosa, A., Ricci, C., Shablovinskaia, E., et al. 2024, A&A, 687, A51 [NASA ADS] [CrossRef] [EDP Sciences] [Google Scholar]
- Turler, M., & Courvoisier, T. J. L. 1998, A&A, 329, 863 [NASA ADS] [Google Scholar]
- Ursini, F., Petrucci, P. O., Bianchi, S., et al. 2020, A&A, 634, A92 [NASA ADS] [CrossRef] [EDP Sciences] [Google Scholar]
- Verner, D. A., Ferland, G. J., Korista, K. T., & Yakovlev, D. G. 1996, ApJ, 465, 487 [Google Scholar]
- Waddell, S. G. H., & Gallo, L. C. 2020, MNRAS, 498, 5207 [NASA ADS] [CrossRef] [Google Scholar]
- Willingale, R., Starling, R. L. C., Beardmore, A. P., Tanvir, N. R., & O’Brien, P. T. 2013, MNRAS, 431, 394 [Google Scholar]
- Wilms, J., Allen, A., & McCray, R. 2000, ApJ, 542, 914 [Google Scholar]
- Wright, E. L. 2006, PASP, 118, 1711 [NASA ADS] [CrossRef] [Google Scholar]
- Zdziarski, A. A., Johnson, W. N., & Magdziarz, P. 1996, MNRAS, 283, 193 [NASA ADS] [CrossRef] [Google Scholar]
- Zdziarski, A. A., Szanecki, M., Poutanen, J., Gierliński, M., & Biernacki, P. 2020, MNRAS, 492, 5234 [NASA ADS] [CrossRef] [Google Scholar]
- Zhou, X.-L., Zhang, S.-N., Wang, D.-X., & Zhu, L. 2010, ApJ, 710, 16 [NASA ADS] [CrossRef] [Google Scholar]
- Życki, P. T., Done, C., & Smith, D. A. 1999, MNRAS, 309, 561 [Google Scholar]
Appendix A: XMM-Newton observations from 2007
Here, we present the analysis of the four 2007 XMM-Newton observations (see Table 1), which are relevant for our comparison with the 2022 observation. The extraction of all 2007 pn light curves (Sect. A.1) and of the 2007#4 pn spectra were built using an annulus extraction region to minimise the effect of heavy pile-up due to the use of the full frame window mode (see Sect. 2.1). The reprocessing and extraction method for the 2007#4 RGS spectra are reported as well in Sect. 2.1.
A.1. XMM-Newton-pn light curves from 2007
The count rate light curves of the four XMM-Newton-pn observations have been built using the EPICLCCORRSAS tool. Figure A.1 shows the corresponding light curves in the 0.3–2 keV and 2–10 keV energy bands, and the hardness ratio, 2-10 keV/0.3–2 keV. While the observation performed on 09/10/2007 and 12/10/12/2007 exhibit some variability, mainly in the soft X-rays similar to the 2022 observation, no significant spectral variability is reported from the hardness ratio at each epoch.
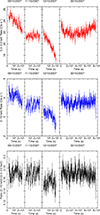 |
Fig. A.1. XMM-Newton-pn light curves of ESO 141–G55 from 2007, with time bins of 500 s, in the 0.3–2 keV (top panel) and 2-10 keV (middle panel) energy ranges and the corresponding hardness ratio, 2–10 keV/0.3–2 keV (bottom panel). |
A.2. RGS spectrum of the 2007#4 observation
Figure A.2 displays a zoom-in on the O VII triplet obtained from the 2007#4 (longest 2007 observation) RGS spectrum using an absorbed power-law model for the continuum as done for the 2022 RGS spectrum (Sect. 3.1). Similar to the observation in 2022, a broad resonance line and a narrow forbidden line are present. The parameters are also consistent with the 2022 observation; here the resonance line is centred at E = 574.0 ± 1.7 eV, with an EW of 1.4 ± 0.5 eV, while the line is somewhat broadened with an FWHM velocity width of about 3000 km s−1. The forbidden line is centred at E = 561.8 ± 1.7 eV, with an EW of 1.0 ± 0.6 eV and is unresolved.
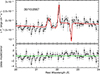 |
Fig. A.2. Zoom-in on the O VII emission band of the fluxed 2007#4 RGS spectrum of ESO 141-G55 fitted with a baseline absorbed power-law continuum. Similar to the 2022 RGS spectrum (Fig. 3 bottom panel) the broad component at 21.6 Å corresponds to the resonance line and the narrow component at 22.1 Å corresponds to the forbidden line. The absorption line at about 22.6 Å is due to O I from our Galaxy. |
Appendix A: Hot corona and relativistic properties inferred from the relxill models: 2022 and 2016 epochs
We report the pn and NuSTAR spectral analysis above 3 keV using the RELXILLCP model (Dauser et al. 2013). As mentioned in Sect. 3.4, the RELXILLCP model uses the NTHCOMP model (Zdziarski et al. 1996; Życki et al. 1999) to reproduce the hot corona (hard Comptonisation) spectral shape, while for the REFLKERRD model (Sect. 3.4), the hard Comptonisation is calculated using IREFLECT convolved with COMPPS (Poutanen & Svensson 1996). As done in Sect. 3.4, the single power-law disc emissivity index (q; with emissivity ∝R−q) is allowed to vary, while the inner disc radius was set to the ISCO. Since the spin value is not constrained, we fixed it at zero. The best-fit parameters are reported in Table B.1. Even if the fit is statistically satisfactory, a noticeable positive residual is present above ∼40 keV for the 2022 observation (Fig. B.1) and only lower limits for the hot corona temperature are found at both epochs. This could be due to the use of NTHCOMP model to reproduce the hard Comptonisation shape. As for the REFLKERRD model, the extrapolation of the RELXILLCP fit down to 0.3 keV shows that the soft X-ray excess is not accounted for, leaving a huge positive residual below 2 keV (Fig. B.2, top panel). When this model is applied to the whole 0.3–79 keV X-ray broadband range, it fails to reproduce both the soft and hard X-ray shapes (Fig. B.2, lower panel). Similar results are found if a lamppost geometry is assumed for the hot corona using the RELXILLLPCP model.
Simultaneous fits above 3 keV, using the RELXILLCP relativistic reflection model, of the October 2022 XMM-Newton+NuSTAR and July 2016 NuSTAR observations of ESO 141-G55.
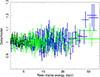 |
Fig. B.1. Data-to-model ratio of the fit above 3 keV of the 2022 simultaneous XMM-Newton (black) and NuSTAR (blue) spectrum and of the 2016 NuSTAR (green) spectrum using the RELXILLCP relativistic reflection model with a primary Comptonisation continuum shape. |
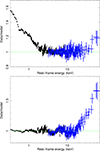 |
Fig. B.2. Residuals in term of data-to-model ratio for the fits of the 2022 simultaneous XMM-Newton-pn (black) and NuSTAR (blue) spectrum of ESO 141-G55 with the RELXILLCP model. Top panel: Fit above 3 keV (Table B.1), which has been extrapolated down to 0.3 keV. Bottom panel: Fit over the full 0.3–79 keV energy range. |
Appendix A: SED analysis of the October 30, 2007 XMM-Newton observation
We present the SED analysis of the 2007#4 XMM-Newton (OM-UV plus pn) observation using the baseline model RELAGN+REFLKERRD (Sect. 4). Our aim is to check for any significant difference of the properties of the disc-corona system, compared to those inferred from the 2022 observation, which could explain the presence of the narrow UFO signature reported during the 2007#4 observation (Sect. 3.3). The black hole spin value was fixed to zero. We set the values of the disc inclination and the iron abundance to those inferred from the 2022 SED analysis (see Table 6), since they are not supposed to vary on year timescales. Due to the lack of 2007 data above 10 keV, we fixed the hot corona temperature to 136 keV as found in 2022, since, as shown in Sect. 3.4 this parameter does not show any significant change for 10–20% X-ray flux variation. The best-fit parameters are reported in Table C.1 and shows that the disc-corona properties are very comparable at both epochs taking into account error bars of the parameter values. Figure C.1 shows, for illustration purposes, a comparison of the intrinsic SED at both epochs. Therefore, the appearance of a UFO signature during the 2007#4 observation does not seem to be related to specific disc-corona properties.
SED fits (UV to 10 keV) of the 2007#4 XMM-Newton-pn spectrum of ESO141-G55 with the baseline model RELAGN+REFLKERRD.
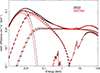 |
Fig. C.1. Intrinsic SED of ESO 141-G55 inferred from the RELAGN+REFLKERRD baseline model for the 2007#4 XMM-Newton observation (red). The best-fit parameter values are reported in Table C.1. For comparison, the 2022 intrinsic SED is also displayed (black). These intrinsic SEDs are corrected for both reddening and Galactic absorption (solid curves). The main individual emission components are displayed: outer disc (dotted curves), warm optically thick Comptonisation (dashed curves; warm corona), hot optically thin Comptonisation (dotted-dashed curves; hot corona), and relativistic reflection (three-dotted-dashed curves). |
All Tables
Soft X-ray emission lines in the ESO 141-G55 rest frame observed in the 2022 RGS spectrum.
Simultaneous SED fits of the 2022 simultaneous XMM-Newton-pn and NuSTAR spectra of ESO141-G55 with the baseline model RELAGN+REFLKERRD for different fixed black hole spin values.
Simultaneous fits above 3 keV, using the RELXILLCP relativistic reflection model, of the October 2022 XMM-Newton+NuSTAR and July 2016 NuSTAR observations of ESO 141-G55.
SED fits (UV to 10 keV) of the 2007#4 XMM-Newton-pn spectrum of ESO141-G55 with the baseline model RELAGN+REFLKERRD.
All Figures
|
Fig. 1. XMM-Newton-pn light curves of ESO 141–G55 from 2022 with time bins of 500 s in the 0.3–2 keV (top panel) and 2–10 keV (middle panel) energy ranges and the corresponding hardness ratio, 2–10 keV/0.3–2 keV (bottom panel). |
| In the text | |
|
Fig. 2. Data-to-model ratio of the simultaneous 2022 XMM-Newton-pn (black) and NuSTAR (blue) spectrum of ESO 141-G55 fit with a Galactic (NH(Gal) = 5.7 × 1020 cm−2) absorbed power-law continuum model over the 3–5 keV energy range. Top panel: Extrapolation over the 0.3–79 keV broadband X-ray energy range. Bottom panel: Zoom-in on the Fe Kα line. The vertical dashed green line corresponds to 6.4 keV. |
| In the text | |
|
Fig. 3. RGS spectrum of ESO 141-G55 from 2022. Top panel: Fluxed spectrum over the full RGS bandpass. The solid red line corresponds to the baseline absorbed power-law continuum, and the vertical dotted lines mark the wavelengths of the emission lines. Bottom panel: Zoom-in on the O VII emission band (binning of Δλ = 0.1 Å). The broad component at 21.6 Å corresponds to the resonance line, and the narrow component at 22.1 Å corresponds to the forbidden line. The O I absorption line is due to our Galaxy. |
| In the text | |
|
Fig. 4. Contour plot of the broad Gaussian line width (keV) versus its rest-frame energy (keV). The red, green, and blues curves show the confidence levels at 68% (Δχ2 = 2.3), 90% (Δχ2 = 4.61) and 99% (Δχ2 = 9.21), respectively. The horizontal dashed green line corresponds to an FWHM width of ∼3000 km s−1 (BLR). |
| In the text | |
|
Fig. 5. Fit of the 2022 (black) and 2007#4 (red) 3−10 keV XMM-Newton-pn observations with a Galactic power-law plus two Gaussian lines: one broad and one narrow (see text). The 2007#4 spectrum displays an absorption feature (dotted line) at about 4σ below the continuum, while there is nothing apparent at a similar energy in the 2022 observation. |
| In the text | |
|
Fig. 6. Data-to-model ratio of the fit above 3 keV of the 2022 simultaneous XMM-Newton (black) and NuSTAR (blue) spectrum and of the 2016 NuSTAR (green) spectrum using the REFLKERRD relativistic reflection model with a primary Comptonisation continuum shape. |
| In the text | |
|
Fig. 7. Fits of the 2022 simultaneous XMM-Newton-pn (black) and NuSTAR (blue) spectrum of ESO 141-G55 with the REFLKERRD model. Top panel: Fit above 3 keV (Fig. 6, Table 3), which has been extrapolated down to 0.3 keV. Bottom panel: Fit over the entire 0.3–79 keV energy range. Here, we allowed for a broken power-law emissivity and the spin and the disc density values were free to vary. |
| In the text | |
|
Fig. 8. Fit of the 2022 0.3–79 keV simultaneous XMM-Newton-pn (black) and NuSTAR (blue) spectrum of ESO 141-G55 using a simplistic hybrid model combining the COMPTT (warm corona) and REFLKERRD (hot corona and relativistic reflection) models (see Sect. 4 for details). |
| In the text | |
|
Fig. 9. SED fits from UV to hard X-rays of ESO 141-G55 using the RELAGN+REFLKERRD baseline model for the 2022 simultaneous XMM-Newton (pn: black; OM: magenta) and NuSTAR (blue) data, fixing the black hole spin to zero (left panels) and to 0.998 (right panels). The values of the best-fit parameters are reported in Table 6. Top panels: Data-to-model ratio. Bottom panels: Intrinsic SED corrected for reddening and Galactic absorption (solid curves), with the main individual emission components: outer disc (dotted curves), warm optically thick Comptonisation (dashed curves; warm corona), hot optically thin Comptonisation (dotted-dashed curves; hot corona), and relativistic reflection (three-dotted-dashed curves). For clarity, the weak narrow Gaussian line component is not displayed. |
| In the text | |
|
Fig. A.1. XMM-Newton-pn light curves of ESO 141–G55 from 2007, with time bins of 500 s, in the 0.3–2 keV (top panel) and 2-10 keV (middle panel) energy ranges and the corresponding hardness ratio, 2–10 keV/0.3–2 keV (bottom panel). |
| In the text | |
|
Fig. A.2. Zoom-in on the O VII emission band of the fluxed 2007#4 RGS spectrum of ESO 141-G55 fitted with a baseline absorbed power-law continuum. Similar to the 2022 RGS spectrum (Fig. 3 bottom panel) the broad component at 21.6 Å corresponds to the resonance line and the narrow component at 22.1 Å corresponds to the forbidden line. The absorption line at about 22.6 Å is due to O I from our Galaxy. |
| In the text | |
|
Fig. B.1. Data-to-model ratio of the fit above 3 keV of the 2022 simultaneous XMM-Newton (black) and NuSTAR (blue) spectrum and of the 2016 NuSTAR (green) spectrum using the RELXILLCP relativistic reflection model with a primary Comptonisation continuum shape. |
| In the text | |
|
Fig. B.2. Residuals in term of data-to-model ratio for the fits of the 2022 simultaneous XMM-Newton-pn (black) and NuSTAR (blue) spectrum of ESO 141-G55 with the RELXILLCP model. Top panel: Fit above 3 keV (Table B.1), which has been extrapolated down to 0.3 keV. Bottom panel: Fit over the full 0.3–79 keV energy range. |
| In the text | |
|
Fig. C.1. Intrinsic SED of ESO 141-G55 inferred from the RELAGN+REFLKERRD baseline model for the 2007#4 XMM-Newton observation (red). The best-fit parameter values are reported in Table C.1. For comparison, the 2022 intrinsic SED is also displayed (black). These intrinsic SEDs are corrected for both reddening and Galactic absorption (solid curves). The main individual emission components are displayed: outer disc (dotted curves), warm optically thick Comptonisation (dashed curves; warm corona), hot optically thin Comptonisation (dotted-dashed curves; hot corona), and relativistic reflection (three-dotted-dashed curves). |
| In the text | |
Current usage metrics show cumulative count of Article Views (full-text article views including HTML views, PDF and ePub downloads, according to the available data) and Abstracts Views on Vision4Press platform.
Data correspond to usage on the plateform after 2015. The current usage metrics is available 48-96 hours after online publication and is updated daily on week days.
Initial download of the metrics may take a while.