Fig. 3.
Download original image
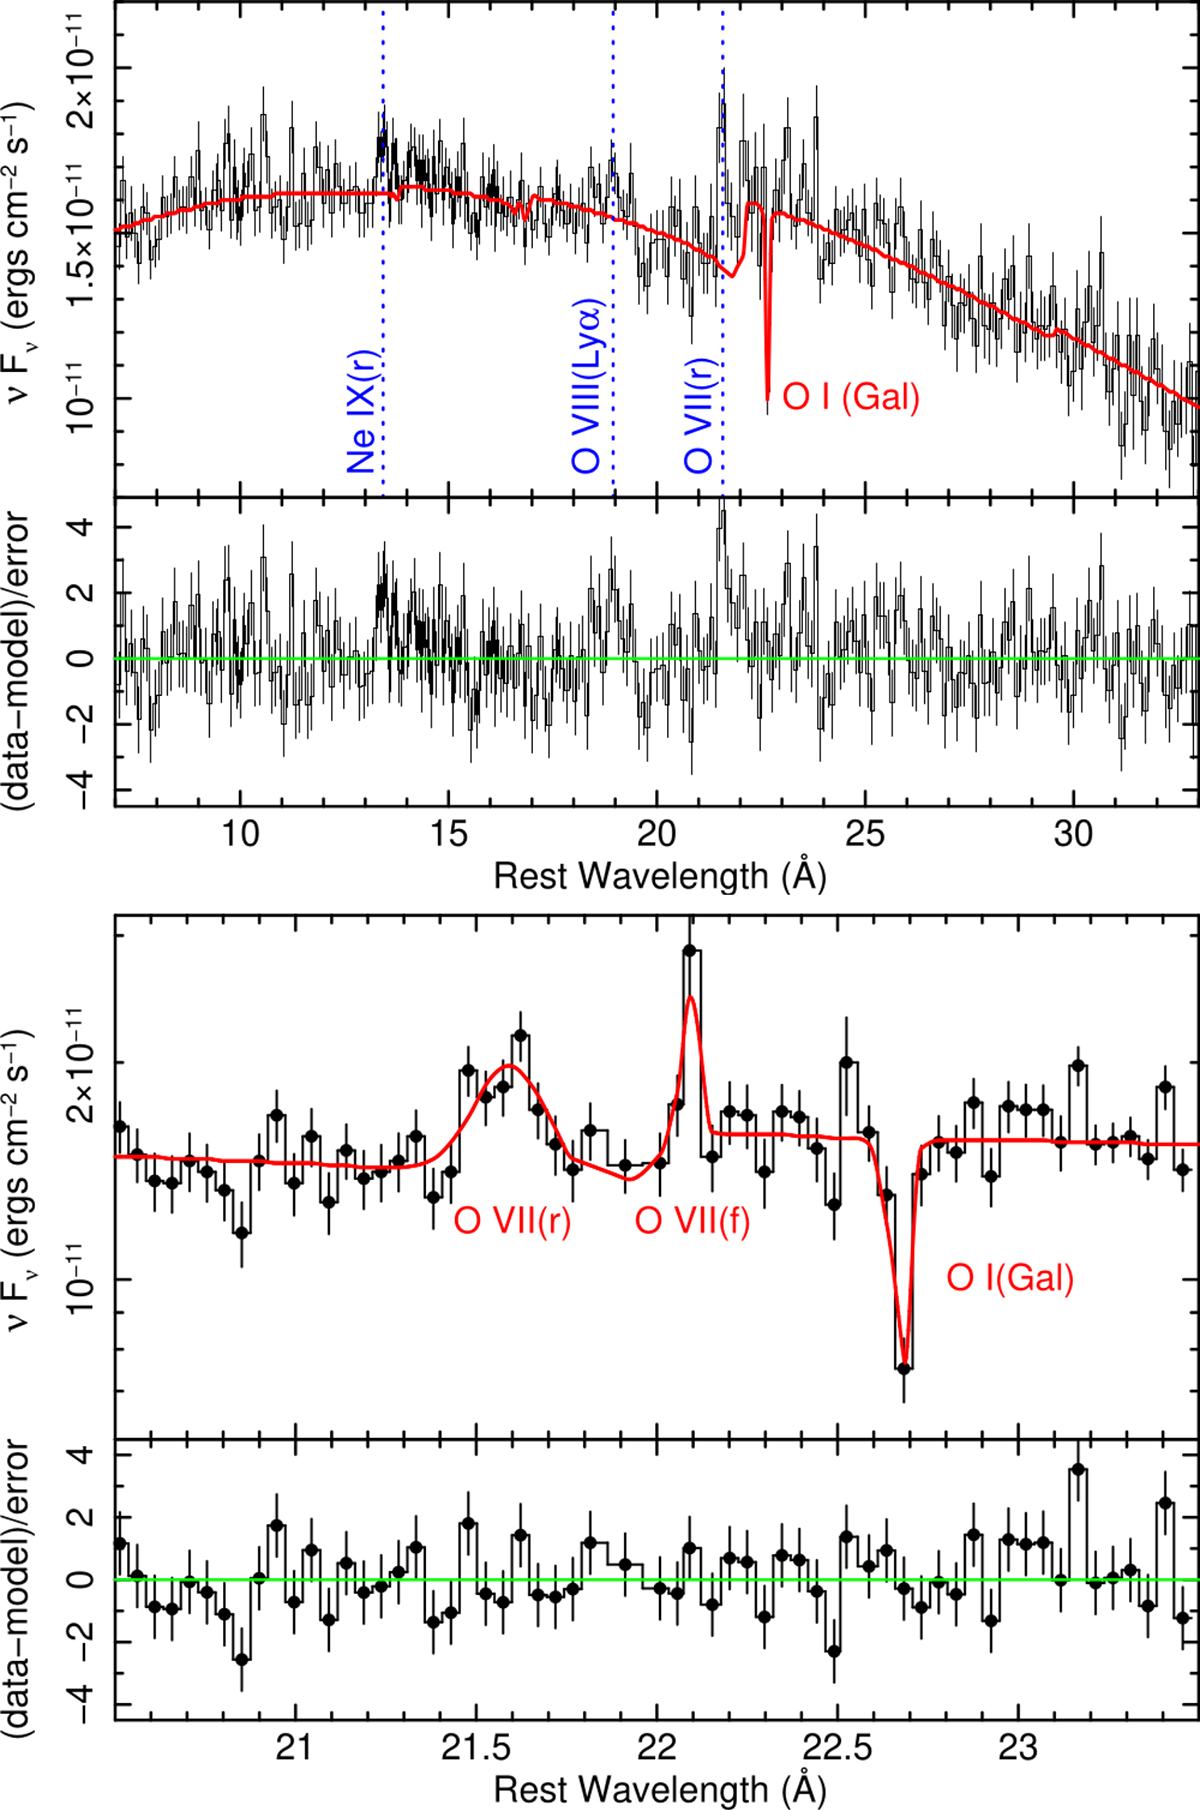
RGS spectrum of ESO 141-G55 from 2022. Top panel: Fluxed spectrum over the full RGS bandpass. The solid red line corresponds to the baseline absorbed power-law continuum, and the vertical dotted lines mark the wavelengths of the emission lines. Bottom panel: Zoom-in on the O VII emission band (binning of Δλ = 0.1 Å). The broad component at 21.6 Å corresponds to the resonance line, and the narrow component at 22.1 Å corresponds to the forbidden line. The O I absorption line is due to our Galaxy.
Current usage metrics show cumulative count of Article Views (full-text article views including HTML views, PDF and ePub downloads, according to the available data) and Abstracts Views on Vision4Press platform.
Data correspond to usage on the plateform after 2015. The current usage metrics is available 48-96 hours after online publication and is updated daily on week days.
Initial download of the metrics may take a while.