Fig. 1.
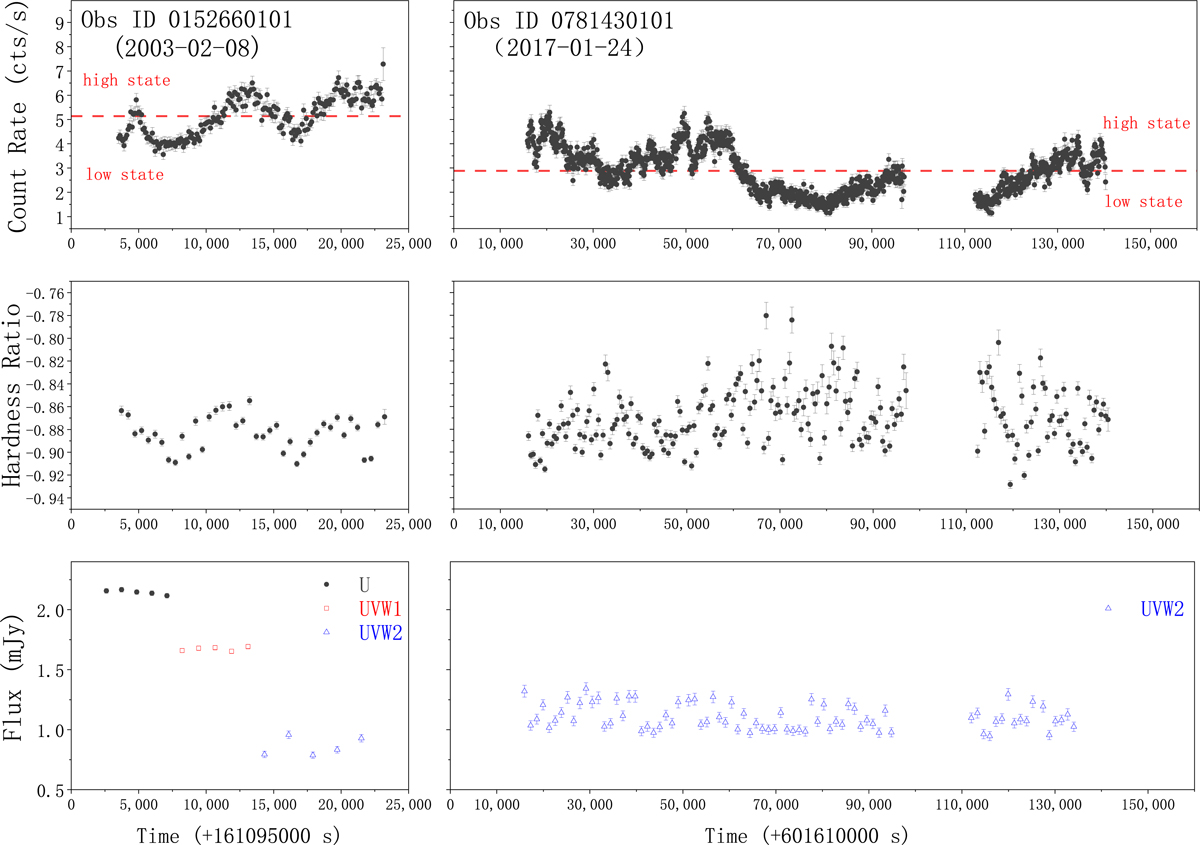
Light curves of PG 1447+273. Top panel: light curve of PG 1447+273 in the X-ray band (0.2–10 keV). Middle panel: X-ray hardness ratio over time. Bottom panel: light curves of PG 1447 + 273 in the optical/ultraviolet band. The time and ID of the observation are denoted in the top panel. The red lines in the top panel represent the average X-ray fluxes during the corresponding observation period. According to the respective average X-ray fluxes, as shown in the figure, the single observation is further divided into high and low states.
Current usage metrics show cumulative count of Article Views (full-text article views including HTML views, PDF and ePub downloads, according to the available data) and Abstracts Views on Vision4Press platform.
Data correspond to usage on the plateform after 2015. The current usage metrics is available 48-96 hours after online publication and is updated daily on week days.
Initial download of the metrics may take a while.