Fig. 8.
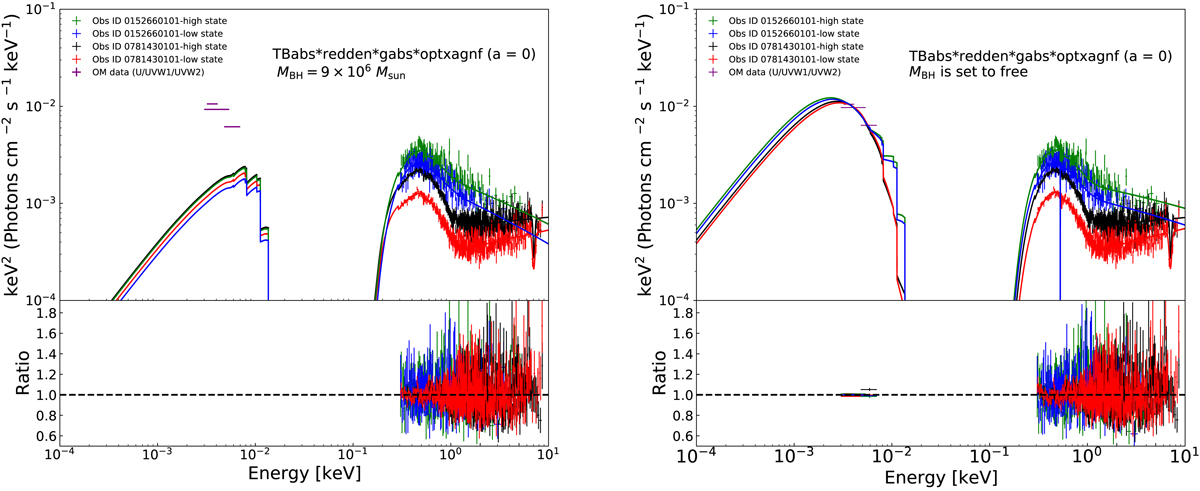
X-ray spectra of PG 1448+273 with the optical/UV data from the OM. Left panel: the lines of different colour represent the best-fitting warm corona models obtained by fitting the corresponding colour X-ray data under the condition of a = 0 and MBH = 9 × 10⁶ M⊙. These best-fitting models are extrapolated to the optical/UV band to compare the observed optical/UV data, and the observed optical/UV fluxes significantly exceed the extrapolated value of the models. Right panel: the lines of different colours represent the best-fitting warm coronal model obtained by simultaneously fitting the corresponding colour X-ray and optical/UV data under the condition of a = 0 and a free black hole mass.
Current usage metrics show cumulative count of Article Views (full-text article views including HTML views, PDF and ePub downloads, according to the available data) and Abstracts Views on Vision4Press platform.
Data correspond to usage on the plateform after 2015. The current usage metrics is available 48-96 hours after online publication and is updated daily on week days.
Initial download of the metrics may take a while.