Fig. 6.
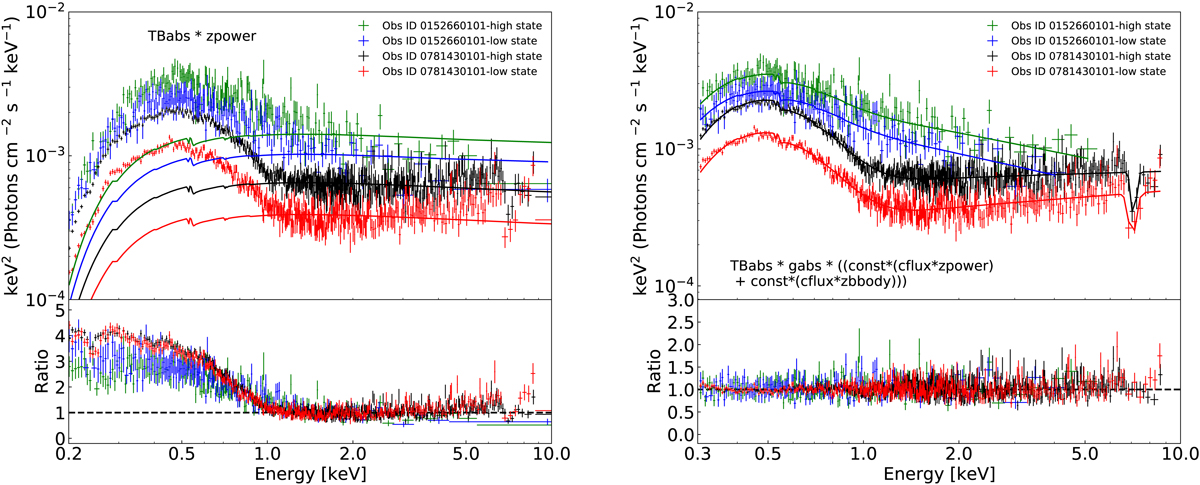
Fitting results of the phenomenological models for the spectra of PG 1448+273. Left panel: the fitting results and data/model ratio plots of a Galactic absorption modified power-law model. The spectral index of the model is tied between all the spectra to examine the spectral variability, and the fitted models are extrapolated to the 0.2–2 keV and 6–10 keV to examine the spectral features. Right panel: the fitting results and data/model ratio plots of the TBabs * gabs* ((cflux*zpower) plus const*(cflux*zbbody)) model. The observation ID and status corresponding to different colour data are denoted in the top panel, and the model used for fitting is also indicated in each panel.
Current usage metrics show cumulative count of Article Views (full-text article views including HTML views, PDF and ePub downloads, according to the available data) and Abstracts Views on Vision4Press platform.
Data correspond to usage on the plateform after 2015. The current usage metrics is available 48-96 hours after online publication and is updated daily on week days.
Initial download of the metrics may take a while.