Fig. 5.
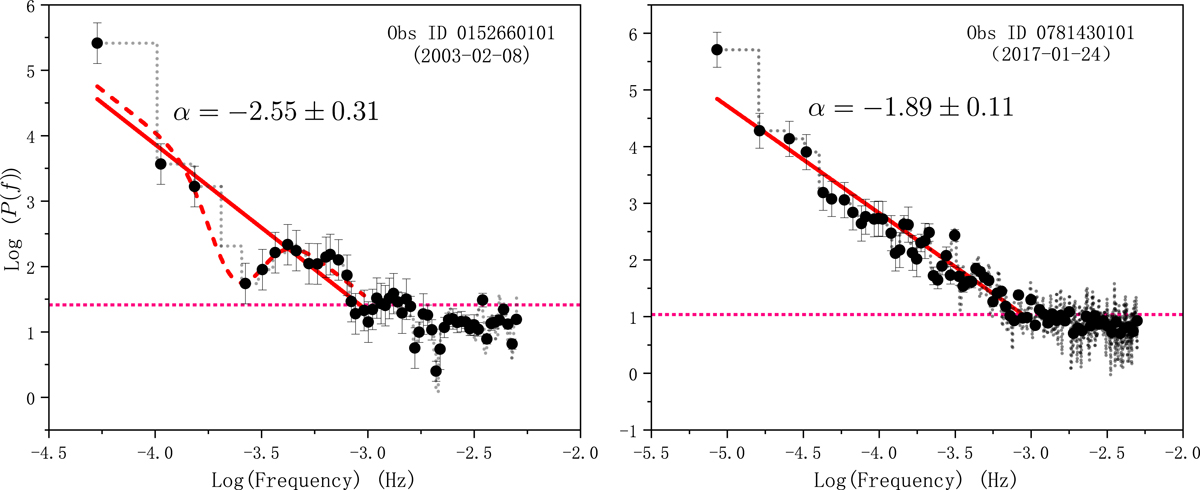
PSDs of light curves in 2003 (right panel) and 2017 (right panel). The red solid lines indicate the fitting results of the power law, and the corresponding spectral indexes α are denoted in the panel. The pink horizontal lines represent the power level of the noise floor. There is an obvious dip (oscillation) feature at the ν ∼ 10−3.6 Hz of the PSD in 2003, and the red dotted line indicates the fitting result after adding a Gaussian component to be responsible for the dip feature.
Current usage metrics show cumulative count of Article Views (full-text article views including HTML views, PDF and ePub downloads, according to the available data) and Abstracts Views on Vision4Press platform.
Data correspond to usage on the plateform after 2015. The current usage metrics is available 48-96 hours after online publication and is updated daily on week days.
Initial download of the metrics may take a while.