| Issue |
A&A
Volume 650, June 2021
First science highlights from SRG/eROSITA
|
|
|---|---|---|
| Article Number | A42 | |
| Number of page(s) | 18 | |
| Section | Astronomical instrumentation | |
| DOI | https://doi.org/10.1051/0004-6361/202040265 | |
| Published online | 03 June 2021 | |
The ART-XC telescope on board the SRG observatory
1
Space Research Institute,
84/32 Profsouznaya str.,
Moscow
117997, Russian Federation
e-mail: This email address is being protected from spambots. You need JavaScript enabled to view it.
2
Lavochkin Association,
24 Leningradskaya str.,
Khimki
141400,
Moscow Region, Russian Federation
3
Russian Federal Nuclear Center - All-Russian Scientific Research Institute of Experimental Physics (RFNC-VNIIEF),
37 Mira Ave,
Sarov
607188,
Nizhny Novgorod region, Russian Federation
4
Universities Space Research Association,
Huntsville,
AL 35805, USA
5
NASA/Marshall Space Flight Center,
Huntsville,
AL 35812
USA
6
Max-Planck-Institut für Astrophysik,
Karl-Schwarzschild-Straße,
85741
Garching, Germany
7
State Space Corporation Roscosmos,
42 Schepkina str.,
Moscow
107996, Russian Federation
Received:
31
December
2020
Accepted:
22
March
2021
Abstract
Astronomical Roentgen Telescope – X-ray Concentrator (ART-XC) is the hard X-ray instrument with grazing incidence imaging optics on board the Spektr-Roentgen-Gamma (SRG) observatory. The SRG observatory is the flagship astrophysical mission of the Russian Federal Space Program, which was successively launched into orbit around the second Lagrangian point (L2) of the Earth-Sun system with a Proton rocket from the Baikonur cosmodrome on 13 July 2019. The ART-XC telescope will provide the first ever true imaging all-sky survey performed with grazing incidence optics in the 4–30 keV energy band and will obtain the deepest and sharpest map of the sky in the energy range of 4–12 keV. Observations performed during the early calibration and performance verification phase as well as during the ongoing all-sky survey that started on 12 December 2019 have demonstrated that the in-flight characteristics of the ART-XC telescope are very close to expectations based on the results of ground calibrations. Upon completion of its four-year all-sky survey, ART-XC is expected to detect approximately 5000 sources (~3000 active galactic nuclei, including heavily obscured ones, several hundred clusters of galaxies, ~1000 cataclysmic variables and other Galactic sources), and to provide a high-quality map of the Galactic background emission in the 4–12 keV energy band. ART-XC is also well suited for discovering transient X-ray sources. In this paper, we describe the telescope, the results of its ground calibrations, the major aspects of the mission, the in-flight performance of ART-XC, and the first scientific results.
Key words: space vehicles: instruments / X-rays: general / surveys
© ESO 2021
1 Introduction
The Mikhail Pavlinsky1 Astronomical Roentgen Telescope – X-ray Concentrator (ART-XC, Pavlinsky et al. 2011, 2016) is one of two X-ray telescopes of the Spektr-Roentgen-Gamma (SRG) observatory, the flagship astrophysical project of the Russian Federal Space Program (Sunyaev et al. 2021). ART-XC is designed to produce true images of the X-ray sky using the grazing incidence imaging X-ray optics technique. ART-XC can also be used in a mode with a much larger effective field of view but without good angular resolution (“concentrator mode”). The ART-XC and eROSITA (the other instrument of the SRG observatory, Predehl et al. 2021) telescopes complement each other, being sensitive in the 4–30 keV and 0.2–8 keV energy bands, respectively.
The only all-sky survey carried out previously with a grazing incidence X-ray telescope is the ROSAT all-sky survey (RASS) in the 0.1–2.4 keV energy band (Voges et al. 1999). At higher energies, all-sky X-ray surveys have been performed either with collimator instruments (e.g. UHURU, Forman et al. 1978, and HEAO1, Wood et al. 1984) or with coded-mask aperture telescopes (e.g. INTEGRAL/IBIS and Swift/BAT, see below). The sensitivity of these surveys was strongly limited by their poor angular resolution. The ART-XC telescope will provide the first ever true imaging all-sky survey performed with grazing incidence optics in the 4–30 keV energy band, that is, at significantly higher energies compared to RASS. ART-XC is optimised for conducting surveys in the 4–12 keV band with maximum sensitivity at around 8–10 keV.
ART-XC was developed by the Space Research Institute (IKI, Moscow) and the Russian Federal Nuclear Center – All-Russian Scientific Research Institute for Experimental Physics (RFNC-VNIIEF, Sarov). The development of the X-ray optics for ART-XC proceeded independently at VNIIEF and NASA’s Marshall Space Flight Center (MSFC). The VNIIEF mirror systems were installed in the qualification model of ART-XC, which was subjected to vibration and endurance tests. This led to a significant reduction of the execution time of the ART-XC project. The flight models of ART-XC X-ray mirror systems were simultaneously developed, fabricated, and calibrated by MSFC. It is important to note that the great experience gained by IKI in the development and operation of the ART-P telescope on board the GRANAT observatory (see, e.g., Sunyaev et al. 1993; Pavlinsky et al. 1994) and of the instruments of the Roentgen observatory on board the MIR space station (see, e.g. Syunyaev et al. 1991) played a significant role in the creation of ART-XC and formulation of its scientific tasks.
ART-XC is the first Wolter grazing incidence X-ray telescope developed and launched into space by Russia.
 |
Fig. 1 ART-XC telescope. Upper left panel: face-on view of the seven MSs looking towards the detectors. Lower left panel: side view of the detector block prior to assembly; there are seven detectors located in the detector block that align with the seven MSs. Above the detector block, in the direction toward the MSs, are collimators for each detector each with a calibration source block. Right panel: complete telescope housing all seven MSs (far left in the image) and the detector block (near right) and associated hardware, including elements of the thermal control system: radiator and heat pipes. The electronic blocks in the foreground are to be mounted on a thermally stabilised platform for flight (not shown). The star tracker is located at the MS end of the carbon and copper telescope tube (hidden from view in this image). |
2 The ART-XC telescope
2.1 Structure
ART-XC consists of the telescope itself and four separate electronics units that are mounted on a thermo-stabilised platform located 0.5 m under the telescope (Fig. 1, Pavlinsky et al. 2012).
The telescope has a weight of about 350 kg, is 3.5 m in height and 0.9 m in diameter, and has a power consumption of 150 W. The main elements of the telescope are seven X-ray mirror systems (MSs) and corresponding X-ray detectors. Each ‘mirror system–detector’ pair forms a ‘telescope module’. These modules are co-aligned and are referred to below as T1 to T7. The MSs are mounted on a platform situated in the upper part of the telescope structure. The seven X-ray detectors compose a focal plane assembly. The detectors and mirrors are enclosed in a carbon fiber conic housing. The upper part of the conic housing is covered with a copper shield that blocks the side aperture stray light, which would otherwise significantly increase the overall detector X-ray background.This issue was investigated in detail by Madsen et al. (2017) for the NuSTAR orbital telescope (Harrison et al. 2013).
The telescope has an onboard calibration system, which is used to determine detector gain and energy resolution, and a thermal control system. The calibration system contains a drive control unit and seven calibration X-ray source blocks, one for each detector. The calibration X-ray source consists of 241Am and 55Fe and is pulled out of the lead box using a stepper motor.
The telescope is a rather complex object from the point of view of ensuring its thermal stability. The telescope’s thermal control system consists of 36 active elements, that is, heaters mounted in different places on the telescope’s structure (Semena et al. 2014). The instrument has two strictly thermally stabilised zones: X-ray mirrors and detectors. A stable temperature of mirror shells in the range of 20 ± 2°C is provided by the heated outer mirror shell and the thermal mirror baffle. The lower part of the outer mirror shell has a temperature of 27 °C, while the upper part has 28 °C. The temperature of the thermal mirror baffle is 22 °C with the time stability of 0.01 °C. The characteristic temperatures of the detector units are discussed below. The separate electronics units are the information collection and control unit, two blocks of electronics for detectors, and the thermal control unit. A BOKZ-MF star tracker is mounted on the MS platform next to the MSs.
Below we describe the systems and components of the ART-XC telescope in detail. Key parameters of the instrument are summarised in Table 1. The quoted values take into account the results of extensive ground calibrations, which are discussed in Sect. 3 below. As further discussed in Sect. 6, in-flight calibrations have generally confirmed the preflight parameters of ART-XC.
ART-XC characteristics.
2.2 Mirror systems
The design of the ART-XC X-ray optics was developed independently at VNIIEF and MSFC based on specifications by IKI. The MSFC used the classical parabolic/hyperbolic shape of Wolter type I mirrors instead of a conical approximation of the Wolter I geometry used by VNIIEF. The major characteristics, such as mass and effective area, of the MSs are similar, but the modules produced byMSFC have a significantly better angular resolution. VNIIEF fabricated seven MSs. All of them were installed in the qualificationmodel of ART-XC which was subjected to vibration and endurance tests. The MSFC fabricated, tested, and calibrated eight identical X-ray MSs for ART-XC (see Fig. 2) (Gubarev et al. 2012, 2014, Krivonos et al. 2017); seven of them were installed in the flight model of the telescope and the eighth became a spare.
Each MS (see Fig. 3) contains 28 Wolter-I nested mirror shells. The shells were fabricated using an electroformed-nickel-replication technique. The shells have diameters ranging from 49 to 145 mm. Their thickness varies with radius from 250 to 350 μm. The outer shells are made thicker, which increases their rigidity, and hence improves the angular resolution of the MS. The inner surface of the ART-XC nickel-cobalt mirrors is coated with a ~ 10 nm layer of 90%bulk density iridium (Ir). This metal has an X-ray reflective index higher than that of gold at energies above 10 keV. The upper ends of the shells are glued into a supporting “spider”.
The weight of each ART-XC MS is about 17 kg. The nominal focal length of the MSs is 2700 mm. During installation into the telescope (Fig. 4), the MSs were defocused by 7 mm to provide a more uniform angular resolution across the field of view(see Fig. 5, Gubarev et al. 2014). Thus, the distance from the MS to the detector plane is 2693 mm.
 |
Fig. 2 One mirror system being prepared for testing at the MSFC Stray Light Test Facility. |
 |
Fig. 3 Cross-section of the mirror system. The inner baffle tube (for stray light reduction) and the heaters are not shown. |
 |
Fig. 4 Mirror systems installed at the assembly stand. |
 |
Fig. 5 Half-power diameter of the mirror system for the nominal focus (2700 mm) and for two defocus positions of − 7 mm and − 15 mm. The HPD was measured at 8.1 keV for MS1 at the MSFC Stray Light Test Facility. |
2.3 X-ray detectors system
The ART-XC focal plane X-ray detectors (Pavlinsky et al. 2016; Levin et al. 2016) were developed in IKI specifically for the SRG mission.
The ART-XC detector system consists of seven units of roentgen detectors (URDs with numbers from 01 to 07 according tothe number of telescope modules), two blocks of electronics (BE), and one serial interface connection block (CB; Levin et al. 2014). The power consumption of the detector assembly is 42 W, and the total mass budget is 39.6 kg. The two BEs consist of seven identical modules (four in BE01 and three in BE02). One BE module services one URD. Each module is connected to the supply distribution network and receives two pulse commands from the spacecraft control system. The BE module includes a primary power supply switcher, an electromagnetic interference filter, a set of low-voltage DC-to-DC converters, a high-voltage regulated DC-to-DC converter, and a current measure and protection circuit. The BE module provides all necessary low and high voltages to the URD and protects the latter from high current consumption. The CB is used for distribution of command/housekeeping and time synchronisation interfaces. Both interfaces are based on the RS-485 standard with galvanic isolation.
The URDs and BEs are separated in order to lower the power dissipation inside the URD. One detection channel (one URD and one BE module) consumes 6 W from the onboard supply network. A power of 3.5 W is dissipated inside the URD and another 2.5 W is dissipated in the BE. The two BEs are placed on the thermally stabilised platform of the spacecraft. The seven URDs and CB are situated inside the ART-XC telescope tube (Fig. 6).
The URD performs the following tasks: receiving and processing commands from the subsystem storing onboard information (SSOI), processing time synchronisation signals, providing all necessary biases to the detector, amplification and analogue-to-digital conversion of the detector output signals, processing the digitised data, finding the areas with registered events, packing data to housekeeping frames, and transmitting housekeeping frames to the SSOI.
The X-ray detector, situated inside the URD, is a big hybrid integrated circuit (Fig. 7). The sensitive elements of the detectors are high-quality CdTe dies (Kishi et al. 2008), manufactured by Acrorad (Japan). The size of the die is 29.95 × 29.95 × 1.00 mm. The electrode structure of the die is: (top) Au/Pt/CdTe/Al/Ti/Au (bottom). The structure CdTe/Al on the bottom electrode forms a Schottky barrier (Toyama et al. 2004). A high-purity CdTe with the Schottky barrier provides a very low-leakage current. To operate in a double side strip detector configuration, the top and bottom electrodes of the die are patterned by photolithography. On the top side, 48 parallel strips are formed, which are surrounded by a guard ring. The same pattern is formed on the bottom side, but it is rotated by 90° relative to the top side,which enables the reconstruction of two coordinates of an incoming event on the detector plane. The width of the strips is 520 μm, and the gaps between strips are 75 μm. The sensitive area of the detector is 28.48 × 28.48 mm. Given the focal length of the MS (~2700 mm), the angular size of the strip is about 45′′.
The strips of the die are connected to the inputs of two application-specific integrated circuits (ASIC) VA64TA1 (Tanaka et al. 2006), manufactured by Ideas (Norway). One ASIC services the top side, and the other services the bottom. The spectrometric channel of VA64TA1 consists of a charge-sensitive amplifier, a fast CR-RC shaper, a discriminator, a slow CR-RC shaper, and a sample and hold unit. Each ASIC has 64 spectrometric channels, but only 48 are used. Because of some features of the VA64TA1 architecture, it has only one output trigger signal, and the triggered channel is determined using software. The URD can operate in two modes. In the first mode, it stores the time of an event as well as six amplitudes registered in three strips in the top layer and three strips in the bottom layer where the event was detected. This is the basic observation mode. In this mode, the URD produces one housekeeping frame (1024 bytes) per 81 events. In the second mode, the URD stores 96 amplitudes from all the strips in the top and bottom layers. In this mode, the URD produces one housekeeping frame (1024 bytes) per three events. Due to the high information content, the second mode is used for detector tests only.
The dead time of the detectors is less than 0.8 ms. The event registration time error relative to the spacecraft time synchronisation signals is less than 23 μs.
During the flight, the thermal regime of the URDs and X-ray detectors is kept by the thermal control unit of ART-XC. The operation temperature of the detectors is between − 22 and − 19 °C. The stability of the temperature of the detectors is better than ± 0.2 °C per month.
The high voltage provided by the BE module can be regulated from 0 to − 360 V, but the operating voltage used is − 100 V. Such a relatively low biasing voltage is selected for three reasons: the ART-XC working energy range is below 30 keV in order to lower the leakage current of the die and to derate the voltage regime of the components servicing the high-voltage side of the CdTe die.
Due to the well-known polarisation effect in CdTe Schottky devices, we regularly switch the high voltage applied to the CdTe die on and off. At the commissioning stage, we tested all the detectors for two days of continuous operation and find only negligible symptoms of polarisation (≲1%). Considering the low operation temperature of CdTe dies for a long time, we decided to perform a depolarisation once per day. The high voltageis applied to the detectors 23 h 50 min per day and the detectors perform observations 23 h 44 min per day. When the operating mode of one detector changes from observation to depolarisation, all other detectors stay in observation mode. As soon as the depolarised detector returns to observation, we perform depolarisation of the next detector and so on. The total time for depolarisation of all the detectors is 1 h 52 min. During operation, we monitor the leakage currents of all dies. We can measure only the total current through the volume of the die and guard rings together. One detector (in URD02) has a leakage current of less than 850 pA, two detectors less than 400 pA, and four detectors less than 100 pA. Figure 8 shows the dependence of the leakage currents of the detector in URD02 versus time for one day of operation (zero is the time when high voltage switches on). After one year in flight, the leakage current has slightly reduced.
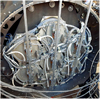 |
Fig. 6 Seven URDs in the ART-XC telescope focal plane assembly (view of the back of the detectors). |
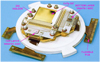 |
Fig. 7 X-ray detector hybrid integrated circuit (model SD-01). |
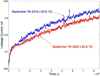 |
Fig. 8 Leakage current vs. time for one-day operation of the CdTe detector at − 100 V. |
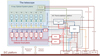 |
Fig. 9 Flowchart of the systems, units, and interfaces of ART-XC. |
2.4 Telescope electronics
The ART-XC electronics includes several functional parts (see Fig. 9): X-ray detectors system; data processing unit (DPU, Russian abbreviation SSOI); star tracker (Russian abbreviation BOKZ-MF); thermal-control unit; calibration source electronics.
The SSOI continuously collects and stores data from the detectors, transmits data to the onboard radio system (radiocomplex) during ground contacts, and provides electrical and logical interfaces with the S/C control system.
The thermal-control unit works continuously, controlling the electrical heaters of ART-XC. As was mentioned above, there are 36main and 36 redundant heaters in the telescope, and the same number of sensors. Each heater is controlled by its own sensor independently using a PID algorithm. Platinum Pt100 type temperature sensors are used.
All the electronic components have passed the necessary screening and additional tests, including radiation tests and destructive physical analysis.
2.5 Onboard data handling structure
The data processing unit (SSOI) of ART-XC performs data collection and storage from the seven detectors, receives and stores orientation data and quaternions from the star trackers and gyros, surveys the instrument’s sensors (analog and digital) by the S/C telemetry system, synchronises subsystems and data binding to the timeline, uploads telecommands for the instrument, downloads scientific and housekeeping data.
Scientific data recorded by the seven detectors and data from the thermal-control unit are transmitted via the ART-XC data bus (UART/RS-485) to SSOI. The latter also receives orientation data and quaternions from the S/C gyros and star trackers (BOKZ-MF and SED-26), which are transmitted by the S/C control system (see Fig. 10). The typical volume of the ART-XC data is 90–120 MB per day.
The FLASH-based SSOI solid-state mass-memory has a capacity of 512 MB. This amount is enough to save scientific data for up to 5 days. Data is stored in memory using ECC Hamming codes, which makes it possible to correct single errors and detect double ones.
The SSOI has a high-speed interface based on the LVDS (Low-Voltage Differential Signaling) physical standard with the onboard radiocomplex. The data structure of packets corresponds to CCSDS (Consultative Committee for Space Data Systems) 133.0-B-1. The radio system uses additional turbo-codes or convolution codes for transmitting to the radio line. This ensures reliable data transmission during ground contacts.
Telecommands for operation of the instrument are sent to SSOI from the S/C control system (SCCS) by the payload data bus (MIL-STD-1553). Telecommands can be time-tagged (stored in the SCCS memory), deferred, or directly executed. The SSOI performs the function of transferring commands from the payload data bus (MIL-STD-1553) to the ART-XC bus (UART/RS-485). The regular volume of commands for ART-XC uploaded onboard during ground contacts is about 1–2 Kbytes per day.
Data synchronisation to the time line is implemented by transmitting the onboard time code (OTC) via information buses (MIL-STD-1553 and RS-485), as well as issuing 1 Hz synchro pulses (1PPS type) via the electrical interfaces to the detectors. The short-term stability of the onboard clock generator is around 10−7, which results in a stable shifting of OTC of 10 ms per day. The OTC is adjusted periodically by special commands to S/C during ground contacts.
2.6 Calibration X-ray sources
All the detectors of the ART-XC telescope are calibrated approximately every two months. For these purposes, the X-ray source (241 Am+55Fe) moves into the field of view of the detector by means of the source-calibration block, which includes a linear actuator. When the detector is observing, the calibration X-ray source is inside the lead box (Fig. 11). To calibrate the detector, necessary commands are sent to the spacecraft. All the calibration sources work independently.
 |
Fig. 10 Onboard data handling structure. |
 |
Fig. 11 Calibration source stowed within a cylindrical lead box attached to each collimator of each telescope module (a). The lead box ensures no flux from the calibration source is measurable during astrophysical observations. The calibration source can be inserted into the collimator, as shown in the right panel b, where it illuminates its detector. |
2.7 Star tracker
The ART-XC star tracker BOKZ-MF is mounted on the MS platform next to the MSs and is aligned with the telescope’s optical axis. BOKZ-MF may be used as a redundant star tracker in the S/C attitude control system. The main parameters of BOKZ-MF are presented in Table 2.
There are also two SED-26 star trackers by SODERN aboard the spacecraft, whose attitude information is available to ART-XC. These star trackers are mounted on the optical bench of eROSITA and belong to the S/C control system.
BOKZ-MF star tracker characteristics.
3 Ground calibrations
Ground calibrations of ART-XC took place from 2014 to 2018, with three test facilities involved at different stages: the NASA/MSFC Stray Light Test Facility (USA), the IKI X-ray test facility (Russia), and the PANTER X-ray test facility (Germany).
First, the ART-XC flight MSs were calibrated at the NASA/MSFC Stray Light Test Facility (Gubarev et al. 2014; Krivonos et al. 2017). For each mirror system, the half-power diameter (HPD), the point-spread function (PSF) with high resolution, and the effective area at various off-axis angles and azimuths were measured. Figure 12 shows average PSF images obtained at different offset angles for one of the MSs. The HPD values at energies of 8.1 and 20 keV for several off-axis angles are shown in Fig. 13. Table 3 lists the key derived parameters for each of the eight MSs at an energy of 8.1 keV. Seven of them have fairly similar characteristics and were installed in the ART-XC flight model. One MS (MS6) showed somewhat poorer angular resolution and therefore became the spare.
Based on these MS calibration data, an ART-XC PSF model was constructed, which is used in application to ART-XC data for X-ray source detection and characterisation. We note that the effective ART-XC PSF in survey and scanning modes is obtained through the convolution of the real MS PSF with a square window of the detector pixel size (45′′). The resulting PSF model for various source positions in the telescope’s field of view is shown in Fig. 14.
As a next step, the ART-XC flight MSs together with the detector units were calibrated at the IKI 60 m X-ray test facility in Moscow, Russia. For various reasons, the time allocated for the calibration of flight systems was severely limited. Therefore, additional, more detailed studies were carried out using the spare mirror system (MS6) and one of the spare detector units (URD29; Pavlinsky et al. 2018, 2019a,b). The main purpose of these tests was to determine the characteristics of the ART-XC X-ray detectors, to verify the mathematical model of the ART-XC mirror system based on ray-tracing simulations, and to evaluate the telescope performance.
Figure 15 shows the measured energy resolution ΔE (FWHM) of the ART-XC spare detector unit URD29 as a function of energy. A significant deviation from the expected FWHM  dependence of energy resolution observed for URD29 at 5.9 keV is associated with a peculiarity of the ASIC VA64TA1 architecture. The ASIC circuit does not have a peak detector, which leads to a ‘stretching’ of the peak shape towards low energies when processing signals with an amplitude close to the threshold.
Figure 16 shows the efficiency of the ART-XC spare detector, as measured at the IKI X-ray test facility. The efficiency reaches 50% at 4.6 keV and exceeds 90% at energies above 9.5 keV.
The final stage of the ART-XC ground calibration campaign took place at the PANTER X-ray test facility of the Max-Plank-Institute for Extraterrestrial Physics in Neuried, Germany, in October 2018 (Fig. 17). For these tests, we used the ART-XC spare mirror system and detector unit as well as the PANTER TroPIC pnCCD camera, which was also used for ground calibrations of the eROSITA mirror systems.
During these calibrations, the on-axis effective area of the ART-XC spare mirror was measured for the ART-XC spare detector and for the TRoPIC camera. The results at the same energies are in good mutual agreement (see Table 4). Figure 18 shows the effective area of the ART-XC spare mirror system as a function of the offset angle measured by the TRoPIC pnCCD camera. The parameters of the on-axis PSF are given in Table 5.
Assuming that all seven ART-XC flight detector units have approximately the same efficiency as measured for spare detector URD29 and adopting the well-calibrated model for the effective area of the MSs, the on-axis effective area and grasp of the ART-XC telescope have been estimated as a function of energy (Pavlinsky et al. 2019a,b). Figure 19 shows our estimates of the effective area of the ART-XC telescope. The on-axis effective area at 8.1 keV is ~ 385 cm2.
Key parameters of the ART-XC mirror systems at 8.1 keV.
 |
Fig. 12 Samples of the MS1 PSF for different offset angles at 8.1 keV (Krivonos et al. 2017). The PSF was obtained by averaging measurements at four azimuth angles. The size of each image is 400′′ × 560′′. The colour scale is logarithmic. The MS was defocused by 7 mm. |
 |
Fig. 13 HPD of MS1 at energies of 8.1 and 20 keV for several off-axis angles, as measured at the MSFC Stray Light Test Facility. The MS was defocused by 7 mm. |
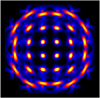 |
Fig. 14 ART-XC PSF model applicable to data of survey and scanning observations, for various source positions in the telescope field of view, at 8.1 keV. |
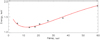 |
Fig. 15 Energy resolution (FWHM) of ART-XC spare detector URD29 as a function of energy. The red curve is the approximation by a cubic polynomial function of
|

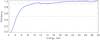 |
Fig. 16 Estimated efficiency of the spare ART-XC detector URD29 based on the model of the efficiency of a XR-100T-CdTe detector. |
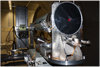 |
Fig. 17 Spare ART-XC mirror system MS6 and detector unit URD29 installed at the PANTER X-ray test facility. |
On-axis effective area of the ART-XC spare mirror system measured at the PANTER X-ray test facility.
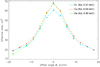 |
Fig. 18 Effective area of the ART-XC spare mirror system as a function of the offset angle measured by the TRoPIC pnCCD camera at the PANTER X-ray test facility. The measurements were performed in the Kα lines of Cr (5.41 keV, blue points), Cu (8.04 keV, orange points), and Ge (9.89 keV, green points). |
On-axis PSF parameters of the ART-XC spare mirror system obtained using the TRoPIC pnCCD camera at the PANTER X-ray test facility.
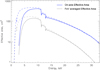 |
Fig. 19 ART-XC on-axis effective area and field of view averaged effective area for doubly reflected events in the 4–35 keV energy bandas a function of energy (solid curves). The ART-XC effective area is based on the simulated effective area of the mirror system (the dashed lines in this figure) and URD29 detector efficiency (Fig. 16). |
4 Mission
4.1 Mission planning and timeline
The SRG mission is operated by Lavochkin Association (also referred to as NPO Lavochkin or NPOL), the developer and creator of the Navigator platform. Mission planning is mainly done on a monthly basis. The plan of observations for the next month is prepared by IKI and checked by NPOL for possible observational constraints. The approved month observational program is normally divided into schedule blocks, which can be sent to the spacecraft on a daily basis during the ground contacts. This naturally sets the constraints for the SRG response time for possible transient events from one day to several days. The actual SRG observing schedule is available on a dedicated website2. Table 6 summarises major milestones for ART-XC from the SRG launch to the beginning of the all-sky survey.
Main events of the ART-XC flight from launch to the start of the survey.
4.2 ART-XC observing modes
There are three modes of observations with ART-XC aboard the spacecraft: (1) pointed observations mode, (2) survey mode, and (3) scan mode.
In the pointed observations mode, the optical axis of the telescope is fixed in a given direction. This mode is usually used for calibration observations. The survey mode is used during the all-sky survey. In this mode, the telescope’s optical axis is rotated with a period of 4 h around the spacecraft axis, pointed towards the Sun. This enables the full sky coverage in about 6 months. We can control movement parameters of the rotation axis by setting the plane of rotation, rotation speed, and initial direction. Typically, this is done once per week. During the first two surveys the rotation plane coincided with the ecliptic plane.
The scan mode is the third observing mode realised in the SRG mission, which enables observations of fairly large regions of the sky (12.5° × 12.5° maximum) with uniform exposure. In this mode, the optical axis of ART-XC performs a ‘snake scan’. The spacecraft control system automatically conducts a series of repeated consecutive rotations around two spacecraft axes with a set of predefined parameters; this set is called a ‘template’. Before being used, this template has to be checked by and agreed with the spacecraft control team.
The scan mode was widely used during the Calibration and Performance Verification phase as well as during additional calibration sessions, and provided excellent results (see Fig. 20).
 |
Fig. 20 Example of a scanning mode observation: Galactic Center scan on 10 Sept. 2019 (Galactic coordinates). |
4.3 Science operation centre
The ground science segment is shown schematically in Fig. 21. The main objectives of the science operation centre are the hardware state control, health monitoring, and telemetry dumping, as well as unpacking, verification, and primary processing of the science data. These operations are performed on a daily basis during the mission ground contacts. A typical daily routine includes the following stages:
Monitoring of the telescope hardware, including various thermal, current, and voltage sensor data, statuses of onboard hardware, amount of data available, and so on.
Massmemory dumping. The data volume is on average ~ 100 Mb day−1 in survey mode. All telemetry is transferred to the ground data receiving stations, then to the Mission operation centre and further to the Science operation centre.
Unpacking, verifying the integrity, and processing the data (including making quick-look products).
Analysing the detailed scientific hardware statuses.
Analysing the quick-look report for anomalies present in the data.
Holding real-time command control sessions (only in emergency cases, to be able to reconfigure hardware instantly during ground contact).
Scheduling the next day’s operation program.
The ART-XC ground segment operations take on average ~ 20% of the total ground contact time.
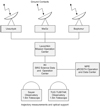 |
Fig. 21 Ground science segment. |
4.4 Science data centre
All SRG/ART-XC telescope science analysis and data archiving are hosted within the IKI science data centre. This includes data reduction, near real-time analysis, sky survey processing, optical ground support, and data archiving. Additionally, the IKI science data centre is responsible for the same tasks for the eROSITA telescope in the part of the Russian quota of the scientific data (Sunyaev et al. 2021).
4.4.1 Data reduction
The ART-XC data-reduction software provides tools for the creation of clean calibrated science products.
The software is organised as a number of independent command line tasks (Fig. 22). These tasks can be chained in sequences (using a control task or manually) for producing science data of different levels and extracting various scientific products. The data-processing scheme is shown in Fig. 22.
The data-processing levels are as follows:
RAW : raw telemetry data (binary formats).
L0 : telemetry data (FITS).
L1 : calibrated science data (FITS).
L2 : cleaned science data (FITS).
L3 : science products (images, light-curves, spectra, etc.).
SKYMAP : L2 and L3 all-sky survey data in sky tiles, including images, exposure, and background maps, X-ray source catalogues, and so on.
The telemetry stream received during a daily ground contact is verified for transmission errors and separated by detector and star tracker units using the ARTDAC tasks and tools. These RAW data are then processed by a preprocessor (ARTPREPROC), which reads the ART-XC telemetry, verifies its integrity and performs conversion into a standard FITS format. The L0 data are processed by a pipeline software (ARTPIPELINE), which at first produces calibrated data products (L1) and then cleaned science data (L2). Calibrated data products include event lists for each of the telescopes and spacecraft attitude data. For each event in the event list, a correct photon energy and celestial coordinates are calculated, time of arrival corrections are applied, and finally an event grade is assigned. A spacecraft attitude reconstruction is performed using orientation data available (BOKZ-MF, SED-26 star trackers and an inertial navigation system GYRO as well). Cleaned science data are suitable to be used in scientific analysis and result from a screening of event files by applying various criteria to attitude, orbital, and instrument parameters and event properties.
The cleaned science data are processed further (ARTPRODUCTS) to obtain science products (L3), including images, light curves, spectra, and so on. The all-sky survey data are organised in 4700 overlapping 3.6° × 3.6° sky tiles (ARTSKYMAP), which are updated on a daily basis to produce L3 data products, including X-ray source catalogues (see below). The majority of science data products at L3 are standard-compliant FITS files and may be used in standard X-ray analysis software (e.g. HEASOFT).
The appearance of sky survey products triggers a source detection procedure, which produces a source candidates catalogue. Source detection and characterisation are done by wavelet decomposition (wvdecomp, Vikhlinin et al. 1998), and matched filter and maximum likelihood fitting algorithms. These use a complete PSF model as a function of source offset angle, which was constructed using the results of ART-XC MSs calibrations at the MSFC (see Sect. 3). The source lists undergo cross-correlation and source identification procedures using various existing X-ray source catalogues and astronomy databases. The resulting sky survey data, source catalogues, and sky tile images are made accessible for authorised users through a dedicated web interface.
The end-user software will be made available to the public along with the ART-XC data. Details of the data-reduction scheme and software will be discussed in future publications.
 |
Fig. 22 ART-XC data-processing scheme. |
4.4.2 Near real-time analysis
The science data products obtained during the data reduction stage are analysed further by the automatic near-real-time analysis (NRTA) system. The system performs computation of the count rate (in the 4–12 keV energy band), and produces background and exposure maps of the sky segment covered during the previous day. A simple sliding-window source-detection algorithm is then applied to the science data products. Finally, the resulting ART-XC daily source candidates catalogue is cross-correlated with X-ray and general source catalogues available in the system and reported to the ART-XC transients group on a timescale of about an hour.
4.4.3 Ground support at optical telescopes
Optical telescopes included in the ground segment solve two important tasks. The first one is the trajectory measurements of the SRG spacecraft which provide further information on its position, which is especially important before and after the orbit corrections. Another task is the observations of potentially interesting astrophysical objects uncovered in X-rays by ART-XC in order to identify their nature, measure their redshifts, and so on. Such observations are, in particular, carried out at two dedicated optical telescopes, which are part of the SRG mission ground segment: the Sayan observatory 1.6-m telescope (AZT-33IK, Burenin et al. 2016), operated by the Institute of Solar-Terrestrial Physics of the Siberian branch of the Russian Academy of Sciences, and the Russian-Turkish 1.5-m telescope (RTT-150), operated jointly by the Kazan Federal University, the Space Research Institute (IKI, Moscow), and the TUBITAK National Observatory (TUG, Turkey).
5 Scientific goals and expectations
The main goal of ART-XC is to survey the whole sky in the medium X-ray energy range of 4–12 keV with the record-high sensitivity of ~ 10−12 erg s−1 cm−2 (~10−13 erg s−1 cm−2 near the ecliptic poles) and subarcminute angular resolution. The relatively hard energy band of ART-XC is particularly well suited for studying populations of astrophysical objects that are significantly affected by intrinsic X-ray photoabsorption, such as active galactic nuclei (AGN), high-mass X-ray binaries (HMXBs), and cataclysmic variables (CVs).
Over the last two decades, a number of all-sky (serendipitous) surveys have been performed in energy bands close to that of ART-XC. The RXTE Slew Survey (XSS) achieved a sensitivity of ~ 10−11 erg s−1 cm−2 and angular resolution of ~1° in the 3–20 keV energy band in the extragalactic sky (|b| > 10°) (Revnivtsev et al. 2004). A somewhat better sensitivity (~ 5 × 10⁻¹² erg s−1 cm−2) has been reached in the 4–10 keV energy band in the MAXI/GSC all-sky survey (Hori et al. 2018; Kawamuro et al. 2018), which similarly to XSS is conducted by a collimator instrument. A similar average depth in the 2–12 keV energy band, but with excellent angular resolution (thanks to the use of mirror X-ray optics), characterises the XMM-Newton Slew Survey (XMMSL; Saxton et al. 2008); however, XMMSL covered the sky very non-uniformly and not in its entirety (84%). In addition, hard X-ray (above 15 keV) all-sky (also serendipitous) surveys have been carriedout by the coded-mask INTEGRAL/IBIS and Swift/BAT instruments, which reached a depth of ~ 10−11 erg s−1 cm−2 at an angular resolution of ~ 5–10 arcmin (e.g. Krivonos et al. 2007, 2012, 2021; Cusumano et al. 2010; Bird et al. 2007, 2016; Mereminskiy et al. 2016; Oh et al. 2018).
The ART-XC all-sky survey will significantly improve on all of these surveys in terms of angular resolution, sensitivity, and uniformity, and will provide a rich astrophysical database for explorations of Galactic and extragalactic objects, as briefly outlined below.
5.1 Extragalactic objects
5.1.1 Active galactic nuclei
Because X-ray source detection is much less affected by photoabsorption in intervening gas in the 4–12 keV energy band compared to softer bands, the ART-XC survey will provide unique data for exploring the AGN population at z ≲ 0.3. Roughly half of all AGNs to be found by ART-XC are expected to be absorbed objects, including ≲ 103 heavily obscured ones (those seen through intrinsic absorption columns NH ≳ 1023 cm−2). Many of these objects will not be detected in softer X-rays by eROSITA, and therefore ART-XC will provide a crucial contribution to the SRG census of AGNs.
In preparation for the SRG mission, a series of simulations of ART-XC scanning observations were run based on preflight knowledge of the instrument’s characteristics. It was demonstrated (Mereminskiy et al. 2018) that the sensitivity of ART-XC observations should significantly depend on the intensity of charged particle background at the SRG orbit, preflight estimates of which varied by almost an order of magnitude. Accordingly, it was predicted that up to ~ 10 000 AGNs might be detected in the course of the all-sky survey. As discussed below (Sect. 6.3), the actual in-flight background intensity proved to be relatively high (although lower than the most pessimistic expectations), which together with the preliminary counts of sources detected during the first two scans of the sky performed in December 2019–December 2020 (see Sect. 6.4 below) suggests that ~ 3000 AGNs will be detected by ART-XC after completion of its four-year survey.
The resulting sample should significantly improve our understanding of AGN population properties. At the depth of ~ 10−12 erg s−1 cm−2, ART-XC can find Seyfert galaxies (with typical X-ray luminosities ≲ 1044 erg s−1) out to z ~ 0.3, as compared toz ≲ 0.1 accessible to current hard X-ray surveys by INTEGRAL (Malizia et al. 2020) and Swift (Koss et al. 2017). This will allow the evolution of AGNs (including obscured ones) to be traced over the last ~ 3 billion years.
The most interesting AGNs found by ART-XC will be studied in detail using follow-up observations in other wavebands and possibly pointed SRG observations after completion of the all-sky survey. Importantly, eROSITA and ART-XC together provide a broad spectral coverage from 0.2 to 30 keV for bright AGNs. Another unique capability of the SRG mission is frequent and quasi-regular monitoring (during the all-sky survey) of faint X-ray sources located near the ecliptic poles. ART-XC will probe AGNs out to z ~ 1 in these regions (with a total area of a few hundred sq. deg), in the objects’ rest-frame energy band ~ 8–24 keV.
5.1.2 Clusters of galaxies
It is expected that during the all-sky survey, ART-XC will confidently detect in the 4–12 keV energy band the approximately 500 most massive and hot low-redshift clusters of galaxies. For the approximately 100 brightest ones, it will be possible to measure fluxes in the 6–12 keV energy band with ≈ 10% precision. Combined with observations of the same clusters in the softer X-ray band, these hard-band measurements will significantly improve determinations of the intracluster gas temperatures. Moreover, ART-XC should provide a few-σ detections or tight upper limits on the hard X-ray flux for about 1000 clusters and unveil the possible presence of AGNs in their central galaxies. This will lead to more reliable and tighter constraints on the cosmological parameters inferred from the SRG all-sky survey.
Deep pointed and scanning observations of selected galaxy clusters and groups with ART-XC will enable mapping of their hard X-ray emission at much larger angular scales than possible with NuSTAR, and to search for non-thermal emission in clusters at these angular scales. This can be achieved thanks to the larger field of view (36′ in diameter) of ART-XC compared to NuSTAR (13′ × 13′) and the more uniform background3.
5.2 Galactic objects
5.2.1 X-ray binaries and cataclysmic variables
Upon completion of its all-sky survey, ART-XC is expected to uncover all sources with X-ray luminosity LX ≳ 1034 erg s−1 within 10 kpc from the Sun, that is, throughout the Galactic bulge and over roughly half of the Galactic disc. This will represent a leap forward with respect to previous X-ray surveys, which have probed the same volume only down to LX ~ 1035 erg s−1. There could be a sizeable Galactic population of low-mass and high-mass X-ray binaries with LX ~ 1034–1035 erg s−1. Despite significant progress in the study of such systems in recent decades (e.g. Revnivtsev et al. 2008; Lutovinov et al. 2013; Hong et al. 2016; Kretschmar et al. 2019; Sazonov et al. 2020; Papitto et al. 2020), their physical and statistical properties are still not known anywhere near as well as those of brighter X-ray binaries with LX ~ 1035–1038 erg s−1. ART-XC will make a census of such low-luminosity X-ray binaries for the first time. Using this unique sample, we hope to significantly improve our understanding of various regimes of accretion onto neutron stars and black holes. In addition, we expect to find a number of new significantly absorbed Galactic sources similar to those discovered with INTEGRAL (Walter et al. 2015).
The ART-XC all-sky survey is also expected to provide a major contribution to the study of cataclysmic variables (CVs). Such objects (accreting white dwarfs) are believed to be much more numerous than neutron-star and black-hole X-ray binaries but statistical studies of these objects have been severely limited by the insufficient sensitivity of previous X-ray surveys. We expect that up to ~ 103 CVs will be found by ART-XC compared to just several dozen present in existing X-ray-selected samples (e.g. Sazonov & Revnivtsev 2004; Pretorius et al. 2013; de Martino et al. 2020; Lutovinov et al. 2020). This, together with the availability of accurate distances for many of these objects from the Gaia mission (Gaia Collaboration 2018), will enable precise measurement of the X-ray luminosity function of CVs for the first time (Mereminskiy et al. 2019).
5.2.2 Supernova remnants
Supernova remnants (SNRs) are sources of thermal X-ray emission originating in shock-heated gas and non-thermal (synchrotron) emission caused by high-energy electrons moving in magnetic fields. Non-thermal X-ray emission provides important information about particle acceleration properties, magnetic field strengths, and turbulence near SNR shock fronts. ART-XC observations will enable high-quality morphology studies of Galactic SNRs to better constrain their thermal and non-thermalemission components.
5.3 Galactic X-ray background
Thanks to regular, multiply repeated scanning of the whole sky and stable particle background conditions at the L2 halo orbit, ART-XC will obtain a unique, high-quality map of the sky in the 4–12 keV energy band. Not only will this map be useful for detection of individual sources of various types, as discussed above, but it should also reveal the large-scale hard X-ray emission of the Galaxy in unprecedented detail. This so-called Galactic ridge X-ray emission (GRXE) is mostly the superposition of numerous unresolved faint X-ray sources such as CVs and stars with active coronae (Revnivtsev et al. 2006, 2009). There remain a number of open questions pertaining to the origin of the GRXE. In particular, we still poorly understand its composition and how it varies across the Galaxy (e.g. Koyama 2018; Perez et al. 2019). Another important issue is whether truly diffuse X-ray emission, associated with the hot phase of the interstellar medium, contributes significantly to the GRXE.
The ART-XC map will significantly improve on the currently best map of the GRXE obtained by the RXTE observatory (Revnivtsev et al. 2006). The latter has poor angular resolution (~ 1 deg), which greatly complicates the separation of the GRXE and individual moderately bright (~ 10−11 erg s−1 cm−2) X-ray sources. Thanks to ART-XC’s excellent angular resolution of ≲ 1 arcmin, it will be possible to single out individual sources brighter than ~ 10−12 erg s−1 cm−2 and to obtain a much cleaner and sharper map of the GRXE.
5.4 Transients
ART-XC is perfectly suited for discovering and monitoring transient and strongly variable sources of various types, from short (seconds to thousands of seconds) X-ray bursts and flares and gamma-ray bursts (GRBs) to long-lasting (hours to years) Galactic X-ray transients and strongly variable AGNs.
To monitor bright transient sources, we can use the fact that singly reflected events may fall onto the detector with offset angles up to ~ 50′. For this type of event, the ART-XC field of view is ~ 2 deg2. Of course, true images of sources cannot be obtained there, but it is possible to use ART-XC as a ‘concentrator’ and measure X-ray fluxes without imaging. In the survey mode, the SRG spacecraft is rotating with a period of 4 h around the Z axis, which is pointed towards the Sun and moving approximately 1 deg per day following the Sun. Any celestial source crosses the ⊘1.6 deg ART-XC field of view approximately ten times. Thus, in the concentrator mode, bright transient sources can be monitored for at least 28–32 h (see details in Pavlinsky et al. 2019b).
Although the probability of catching GRBs in the ART-XC field of view is not high, bright GRBs can penetrate through the shielding material of the telescope and induce a signal on the detectors. Therefore, ART-XC is expected to detect several GRBs per year and provide precise timing information for their localisation by means of triangulation with other space observatories.
 |
Fig. 23 Images of Cen X-3 obtained by the seven ART-XC modules in the 5–16 keV energy band (left) simultaneously with INTEGRAL/JEM-X (right). The phase curves of the pulsating signal with the period of 4.8 s are in good agreement for both instruments (green curves on each panel). |
5.5 Search for dark matter signals
The high efficiency of ART-XC for conducting X-ray surveys, in particular its ability to cover the whole sky, opens up a new opportunity for searching for X-ray lines from sterile neutrinos, a candidate constituent of dark matter. The prospects of the SRG mission in searches for the keV-mass sterile neutrino dark matter radiatively decaying into active neutrinos and photons have recently been investigated by Barinov et al. (2021). It was demonstrated that ART-XC data acquired in the energy range from 5 to 20 keV could provide more stringent constraints compared to those obtained with NuSTAR (Neronov et al. 2016; Perez et al. 2017; Ng et al. 2019; Roach et al. 2020). Therefore, the ART-XC telescope has great potential in testing the sterile neutrino dark matter hypothesis.
6 ART-XC in-flight performance
6.1 First light
On 30 July 2019, just 17 days after the launch, ART-XC was pointed toward its first target in the sky, the famous X-ray binary Cen X-3, consisting of a rapidly rotating neutron star and a massive normal star. The images obtained with all seven ART-XC modules in the 5–16 keV energy band (Fig. 23) confirmed the high sensitivity and imaging capabilities of the telescope.
These observations were also used to check the timing capabilities of ART-XC and the accuracy of the onboard timescale. For these purposes, simultaneous observations of Cen X-3 with the INTEGRAL observatory (Winkler et al. 2003) were organised. The data analysis showed the excellent operation of all ART-XC modules, which clearly detected the pulsed emission with a period of ≃ 4.8 s. The measured pulse period and profile in the 5–16 keV energy band proved to be in good agreement with those measured by the JEM-X telescope aboard INTEGRAL in the 5–20 keV energy band.
6.2 Calibration and performance verification phase
The tuning and commissioning of all seven ART-XC X-ray cameras (detectors) was completed on August 25 2019, after which a program of the ART-XC calibration and performance verification observations began. This CalPV phase lasted for approximately one and half months and was followed by the CalPV phase of eROSITA, during which ART-XC was also operating.
During the CalPV phase, a number of bright X-ray sources were observed with ART-XC in order to calibrate the telescope PSF, vignetting, effective area, timing capabilities, and so on. All in-flight ART-XC characteristics measured in these observations have proved to be close to those expected before launch (see details below). Moreover, ART-XC revealed the transient X-ray pulsar GRO J1008-57 in the state with the lowest observed luminosity and significantly detected pulsations during this state for the first time (Lutovinov et al. 2021).
Additionally, a substantial part of the observational program during the CalPV phase consisted of surveys of specific regions of the sky (Galactic and extragalactic). By design, most of these surveys are much deeper than the ART-XC four-year all-sky survey is expected to be and thus significantly enhance its scientific value.
6.2.1 Optical axes alignment and pointing accuracy
It was found that, as expected, the boresights of individual MSs differ from each other by values of the order of an arcminute or less. We developed calibration procedures to measure the appropriate correction matrices, which are used for the alignment of the data obtained from different modules during ground data processing. For the initial calculation of boresight correction matrices, about 20 different pointed observations of bright X-ray sources from the CalPV phase were used. The accuracy of the current version of boresight corrections is about 6′′. This means that, given star tracker data, we always know with 6 arcsec accuracy the position of a source in the field of view in any of the seven ART-XC detectors and we can project an ART-XC detector source image on the sky with this accuracy. The boresight corrections will be monitored and improved in the future.
Further analysis of CalPV data showed that the centres of the vignetting functions of the seven MSs do not coincide with the centres of the corresponding detectors. This implies that there is some misalignment between the optical axes of the MSs and that of the telescope. To measure the actual position of the telescope’s optical axis at the detectors, a series of pointed observations of the Crab nebula were used. This showed that the optical axis position averaged over the seven MSs is about 2 arcmin away from the centre of the detector. Observations in the pointed mode are usually planned in such a way that the observed target is projected onto this position rather than onto the centre of the detector.
6.2.2 Point spread function
The observations of bright X-ray sources during the CalPV phase demonstrated that the in-flight PSF is very close to the expected one. To illustrate this, we show in Fig. 24 a field containing X-ray bursters SLX 1744-299 and SLX 1744-300, located at a separation of ~ 2.7′, and the Mouse pulsar wind nebula, as observed by ART-XC during its ‘Galactic Bulge Survey’ in the 4–12 keV energy band. Theseobservations were carried out in scanning mode, and therefore the PSF in this image is effectively averaged over the whole field of view of ART-XC. Similar PSF averaging takes place during the ART-XC all-sky survey.
In Fig. 25, the PSF radial profile measured in scanning mode observations of a bright X-ray source (GX 3+1) near the Galactic centre is compared to the radial profile of the PSF measured during the calibrations of the MSs at the MSFC Stray Light Test Facility (Krivonos et al. 2017). To this end, the PSF measured at MSFC was convolved with a sliding box of the detector pixel size (45′′) and then averaged over the field of view taking in account the vignetting function inferred from ray-tracing simulations. In both cases, the part of the source’s flux at radii larger than 5′ was included in the background, which mimics the real situation corresponding to the detection of faint point sources.
The PSF profile measured in-flight during the CalPV phase and the one based on ground calibrations and simulations agree with each other within 10%, as demonstrated in Fig. 25. The ART-XC PSF FWHM for scanning and survey observing modes evaluated from the data of ground calibrations and simulations is ≈ 53′′. The actually measured in-flight PSF FWHM proves to be nearly the same.
 |
Fig. 24 X-ray bursters SLX 1744-299 and SLX 1744-300 and the Mouse pulsar wind nebula, obtained with the ART-XC telescope during the Galactic Bulge Survey (CalPV phase) in the 4–12 keV energy band. The angular distance between bursters is ~ 2.7′. |
 |
Fig. 25 PSF radial profiles averaged over the ART-XC field of view in scanning mode: red solid and dashed lines show the profiles observed for a bright X-ray source during the CalPV phase in the 4–12 keV and 10–20 keV bands, respectively, and the blue line shows the profile obtained from ground calibrations (at 8.1 keV, see above). Dotted line corresponds to the ART-XC angular resolution (Table 1). Uncertainties are shown by thin black lines. |
 |
Fig. 26 Calibration spectrum of the 241Am+55Fe source. The main calibration lines are indicated. The observed decrease in the intensity of the 5.9 keV line is related to the short half-life of Fe55. |
6.2.3 Effective area
The effective area and vignetting function of ART-XC were measured using ground calibrations of mirrors and detector units and extensive ray-tracing simulations (see Sect. 3 above). In order to verify these measurements, a series of observationsof the Crab nebula were carried out during the CalPV phase. The effective area was inferred to be very close to that obtained in simulations and ground calibrations. The analysis of these in-flight calibration data is ongoing.
6.2.4 Spectral resolution and energy scale
In order to monitor the health of the detectors and to calibrate their energy scale and spectral resolution during the flight, ART-XC uses its internal calibration source (see Sect. 2.6 for details). Calibrations are performed regularly, every few months.
Figure 26 shows the energy spectra obtained with one of the detectors in four such calibrations, performed on 25 August 2019, 22 December 2019, 22 February 2020, and 11 April 2020. Both the energy resolution and detector efficiency are in good agreement with the pre-flight measurements and do not change significantly with time and accumulated dose. The observed decrease of the intensity of the 5.9 keV line is related to the short half-life of Fe55 (2.737 yr).
As has already been noted, the ART-XC MSs provide non-zero effective area at energies as high as ≈ 35 keV. To illustrate this, in Fig. 27 we present the sum of seven detector spectra of the bright Galactic HMXB OAO 1657−415 accumulated over a 20 ks observation, along with the background extracted from an empty field. It is clearly seen that ART-XC detects the source up to 30 keV. While the overall spectral shape is determined by the MS response, the broad peak at ≈ 6.5 keV reveals the presence of a Fe Kα line in the source’s spectrum.
6.2.5 Timing capabilities
ART-XC has a high time resolution (see Table 1). To test the timing capabilities of the telescope, we exploited a series of Crab pulsar observations. Using the Jodrell Bank’s radio ephemerides we clearly detected ~ 33 ms pulsations from the source up to 30 keV. A further phase-connected analysis revealed that the frequency of the onboard clock is slightly lower than the nominal value, which leads to a lagging of the onboard clock relative to the Universal time at approximately 10 ms per day (see Fig. 28). This has also been confirmed based on measurements from the Ground Based Control Stations. By taking this systematic effect into account, ART-XC can be used to perform a phase-resolved spectroscopy of pulsars with periods down to a few milliseconds.
One of the unique features of the ART-XC telescope is the capability of its CdTe detectors and onboard electronics to process high photon fluxes. For example, during scanning observations of the very bright X-ray source Scorpion X-1 in September 2019 the ART-XC detectors registered a count rate ~ 500 cts s−1 without anysignificant pileup. However, the estimated loss of the count rate due to the dead time of the ART-XC detector (0.77 ms) was about 37% in this observation.
The count rate transferred from each detector in telemetry is 10–15 cts s−1. If there are no bright X-ray sources in the telescope’s field of view, the average count rate in the 4–100 keV energy band is 5.5 ± 0.5 cts s−1 per detector.
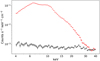 |
Fig. 27 Raw detector spectrum from a 20 ks observation of the bright Galactic HMXB OAO 1657−415. |
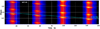 |
Fig. 28 Dynamically folded light curve of the Crab pulsar. The observed phase drift is caused by a deviation of the onboard clock frequency from the nominal value. |
6.3 Detector background at the L2 halo orbit
SRG is the first X-ray observatory near the L2 point, and there are no previous data on the background conditions in this location. Two main unknown factors could strongly affect the performance of X-ray telescopes such as ART-XC: (i) the mean background level, which limits the all-sky survey sensitivity, and (ii) background stability on short timescales, that is, the presence of flares, which are observed by many X-ray missions. Flares could spoil pointed observations and add a significant amount of noise for parts of the all-sky survey, making it less uniform.
The detectors of ART-XC work up to energies of ~ 100 keV, while the mirrors have almost zero effective area above 35 keV. This makes it possible to use the count rate above ~ 40 keV as a proxy for the flux of cosmic rays. Figure 29 shows the weekly average count rate in the 40–100 keV band during the period from September 2019 to September 2020 for two telescope modules T5 and T7. The background is extremely stable with week-to-week variations of just a few percent. There is also an indication of an upward trend, but more data are needed to characterise it in detail.
A preliminary analysis of all available data has revealed a lack of bright flares on short timescales. However, there were no major solar events during the first year of the SRG mission. With the onset of solar cycle 25 in the next few years the situation might change dramatically.
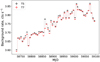 |
Fig. 29 Weekly-averaged rate of events in the 40–100 keV band, which is dominated by charged particles. Two telescope modules are shown. |
6.4 All-sky survey
Upon completion of the CalPV phase, on 12 December 2019 the SRG observatory started its four-year all-sky X-ray survey. By 10 June 2020 the entire sky had been covered by ART-XC for the first time and by 15 December 2020 for the second time.
Our preliminary analysis of the all-sky maps constructed from the ART-XC data of the first year of the survey has revealed approximately 700 sources detected in the 4–12 keV energy band and about 400 sources detected in the 7–12 keV energy band (of which about 100 sources are not detected in the softer 4–7 keV band). We note that at energies above 6–7 keV, ART-XC is more sensitive (in survey mode) than eROSITA (Sunyaev et al. 2021). Based on our current knowledge of the instrument and in-flight background conditions, we can predict that after completion of the four-year all-sky survey ART-XC will detect approximately 5000 sources in the 4–12 keV band.
Figure 30 shows a ~1000 sq. deg fragment of the all-sky map along the Galactic plane obtained by ART-XC in the 4–12 keV energy band during its first scan of the sky. It nicely demonstrates the unique characteristics (hard X-ray band, all-sky coverage, good angular resolution, high dynamic range, and uniformity) of the ongoing ART-XC survey.
7 Summary
The ART-XC telescope on board the SRG observatory has been operating in orbit for more than a year and a half at the time of writing, andits performance fully meets expectations. All the systems of the telescope are healthy and operating nominally. The series of observations performed during the early CalPV phase of the mission revealed that the in-flight characteristics of the ART-XC mirror systems and detectors are very close to the expectations based on the results of ground calibrations.
The all-sky survey that started on 12 December 2019 is continuing smoothly without interruptions, with scientific data being dumped to the ART-XC Science Data Center at IKI in Moscow on a daily basis. The first two ART-XC maps of the whole sky in the 4–12 keV energy band, based on the data of the first and second six-month surveys, as well as their sum, have already been obtained, and work is in progress on the first ART-XC catalogue of X-ray sources. ART-XC has already discovered a few dozen new X-ray sources (see, e.g. Semena et al. 2020, 2021; Mereminskiy et al. 2020; Zaznobin et al. 2021), and efforts are underway to identify them with the help of the optical telescopes belonging to the SRG mission ground segment.
The SRG all-sky survey is planned to be completed in December 2023, and there are good reasons to be optimistic that ART-XC will provide a uniquely deep and sharp map of the entire sky in the 4–12 keV energy band. However, that will not be the end of the mission, as the current SRG mission plan foresees the subsequent few years to be devoted to an extensive program of pointed observations of the selected astrophysical objects. During this post-survey phase, the full energy band of ART-XC (4–30 keV) will be fully exploited for the spectroscopy of X-ray sources. The data of the ART-XC all-sky survey will eventually be made public. The date of the first data release is currently under discussion.
 |
Fig. 30 Map of the Galactic plane region obtained during the first year of the SRG/ART-XC all-sky survey in the 4–12 keV energy band. The region shown is of ≈ 50° × 25° size, centred on Galactic l = 355°, b = 0°, Aitoff projection. Vignetting-corrected exposure vary approximately from 30 s to 60 s in different parts of the image because of the specific survey strategy. |
Acknowledgements
The Mikhail Pavlinsky ART-XC telescope is the hard X-ray instrument on board the SRG observatory, a flagship astrophysical project of the Russian Federal Space Program realized by the Russian Space Agency, in the interests of the Russian Academy of Sciences. The ART-XC team thanks the Russian Space Agency, Russian Academy of Sciences and State Corporation Rosatom for the support of the SRG project and ART-XC telescope. We thank the Lavochkin Association (NPOL) with partners for the creation and operation of the SRG spacecraft (Navigator) with an especial gratitude to E. Filippova, A. Pogodin and P. Merkulov. We thank the Acrorad Co., Ltd. (Japan), which manufactured the CdTe dies and Integrated Detector Electronics AS – IDEAS (Norway), which manufactured the ASICs for the X-ray detectors. We thank our colleagues who have provided a crucial contribution to the ART-XC telescope but to our great regret have passed away: Valery Akimov (IKI) – X-ray detectors scientist, Oleg Kozlov (IKI) – designer of X-ray detectors mechanical parts, and Mikhail Gubarev (MSFC) – designer of X-ray mirrors.
References
- Barinov, V. V., Burenin, R. A., Gorbunov, D. S., & Krivonos, R. A. 2021, Phys. Rev. D, 103, 063512 [Google Scholar]
- Bird, A. J., Malizia, A., Bazzano, A., et al. 2007, ApJS, 170, 175 [Google Scholar]
- Bird, A. J., Bazzano, A., Malizia, A., et al. 2016, ApJS, 223, 15 [NASA ADS] [CrossRef] [Google Scholar]
- Burenin, R. A., Amvrosov, A. L., Eselevich, M. V., et al. 2016, Astron. Lett., 42, 295 [Google Scholar]
- Cusumano, G., La Parola, V., Segreto, A., et al. 2010, A&A, 524, A64 [NASA ADS] [CrossRef] [EDP Sciences] [Google Scholar]
- de Martino, D., Bernardini, F., Mukai, K., Falanga, M., & Masetti, N. 2020, Adv. Space Res., 66, 1209 [Google Scholar]
- Forman, W., Jones, C., Cominsky, L., et al. 1978, ApJS, 38, 357 [Google Scholar]
- Gaia Collaboration (Brown, A. G. A., et al.) 2018, A&A, 616, A1 [NASA ADS] [CrossRef] [EDP Sciences] [Google Scholar]
- Gubarev, M., Ramsey, B., O’Dell, S. L., et al. 2012, SPIE Conf. Ser, 8443, 84431U [Google Scholar]
- Gubarev, M., Ramsey, B., Kolodziejczak, J. J., et al. 2014, SPIE Conf. Ser., 9144, 91444U [Google Scholar]
- Harrison, F. A., Craig, W. W., Christensen, F. E., et al. 2013, ApJ, 770, 103 [Google Scholar]
- Hong, J., Mori, K., Hailey, C. J., et al. 2016, ApJ, 825, 132 [Google Scholar]
- Hori, T., Shidatsu, M., Ueda, Y., et al. 2018, ApJS, 235, 7 [Google Scholar]
- Kawamuro, T., Ueda, Y., Shidatsu, M., et al. 2018, ApJS, 238, 32 [Google Scholar]
- Kishi, N., Mito, Y., Inui, W., & Ohno, R. 2008, in 2008 IEEE Nuclear Science Symposium Conference Record, 969 [Google Scholar]
- Koss, M., Trakhtenbrot, B., Ricci, C., et al. 2017, ApJ, 850, 74 [Google Scholar]
- Koyama, K. 2018, PASJ, 70, R1 [Google Scholar]
- Kretschmar, P., Fürst, F., Sidoli, L., et al. 2019, New Astron. Rev., 86, 101546 [Google Scholar]
- Krivonos, R., Revnivtsev, M., Lutovinov, A., et al. 2007, A&A, 475, 775 [NASA ADS] [CrossRef] [EDP Sciences] [Google Scholar]
- Krivonos, R., Tsygankov, S., Lutovinov, A., et al. 2012, A&A, 545, A27 [NASA ADS] [CrossRef] [EDP Sciences] [Google Scholar]
- Krivonos, R., Tkachenko, A., Burenin, R., et al. 2017, Exp. Astron., 44, 147 [Google Scholar]
- Krivonos, R. A., Bird, A. J., Churazov, E. M., et al. 2021, New Astron. Rev., 92, 101612 [Google Scholar]
- Levin, V., Pavlinsky, M., Akimov, V., et al. 2014, SPIE Conf. Ser., 9144, 914413 [Google Scholar]
- Levin, V., Pavlinsky, M., Akimov, V., et al. 2016, SPIE Conf. Ser., 9905, 990551 [Google Scholar]
- Lutovinov, A. A., Revnivtsev, M. G., Tsygankov, S. S., & Krivonos, R. A. 2013, MNRAS, 431, 327 [Google Scholar]
- Lutovinov, A., Suleimanov, V., Manuel Luna, G. J., et al. 2020, New Astron. Rev., 91, 101547 [Google Scholar]
- Lutovinov, A., Tsygankov, S., Molkov, S., et al. 2021, ApJ, 912, 17 [Google Scholar]
- Madsen, K. K., Christensen, F. E., Craig, W. W., et al. 2017, J. Astron. Telesc. Instrum. Syst., 3, 044003 [Google Scholar]
- Malizia, A., Sazonov, S., Bassani, L., et al. 2020, New Astron. Rev., 90, 101545 [Google Scholar]
- Mereminskiy, I. A., Krivonos, R. A., Lutovinov, A. e. A., et al. 2016, MNRAS, 459, 140 [Google Scholar]
- Mereminskiy, I. A., Filippova, E. V., Burenin, R. A., et al. 2018, Astron. Lett., 44, 67 [Google Scholar]
- Mereminskiy, I. A., Burenin, R. A., Krivonos, R. A., et al. 2019, Astron. Lett., 45, 62 [Google Scholar]
- Mereminskiy, I., Medvedev, P., Semena, A., et al. 2020, ATel, 13571, 1 [Google Scholar]
- Neronov, A., Malyshev, D., & Eckert, D. 2016, Phys. Rev. D, 94, 123504 [Google Scholar]
- Ng, K. C. Y., Roach, B. M., Perez, K., et al. 2019, Phys. Rev. D, 99, 083005 [Google Scholar]
- Oh, K., Koss, M., Markwardt, C. B., et al. 2018, ApJS, 235, 4 [Google Scholar]
- Papitto, A., Falanga, M., Hermsen, W., et al. 2020, New Astron. Rev., 91, 101544 [Google Scholar]
- Pavlinsky, M. N., Grebenev, S. A., & Sunyaev, R. A. 1994, ApJ, 425, 110 [Google Scholar]
- Pavlinsky, M., Akimov, V., Levin, V., et al. 2011, SPIE Conf. Ser., 8147, 814706 [Google Scholar]
- Pavlinsky, M., Akimov, V., Levin, V., et al. 2012, SPIE Conf. Ser., 8443, 84431T [Google Scholar]
- Pavlinsky, M., Akimov, V., Levin, V., et al. 2016, SPIE Conf. Ser., 9905, 99051J [Google Scholar]
- Pavlinsky, M., Tkachenko, A., Levin, V., et al. 2018, Exp. Astron., 45, 315 [Google Scholar]
- Pavlinsky, M., Tkachenko, A., Levin, V., et al. 2019a, Exp. Astron., 47, 1 [Google Scholar]
- Pavlinsky, M., Tkachenko, A., Levin, V., et al. 2019b, Exp. Astron., 48, 233 [Google Scholar]
- Perez, K., Ng, K. C. Y., Beacom, J. F., et al. 2017, Phys. Rev. D, 95, 123002 [Google Scholar]
- Perez, K., Krivonos, R., & Wik, D. R. 2019, ApJ, 884, 153 [Google Scholar]
- Predehl, P., Andritschke, R., Arefiev, V., et al. 2021, A&A, 647, A1 [EDP Sciences] [Google Scholar]
- Pretorius, M. L., Knigge, C., & Schwope, A. D. 2013, MNRAS, 432, 570 [Google Scholar]
- Revnivtsev, M., Sazonov, S., Jahoda, K., & Gilfanov, M. 2004, A&A, 418, 927 [NASA ADS] [CrossRef] [EDP Sciences] [Google Scholar]
- Revnivtsev, M., Sazonov, S., Gilfanov, M., Churazov, E., & Sunyaev, R. 2006, A&A, 452, 169 [NASA ADS] [CrossRef] [EDP Sciences] [Google Scholar]
- Revnivtsev, M., Lutovinov, A., Churazov, E., et al. 2008, A&A, 491, 209 [NASA ADS] [CrossRef] [EDP Sciences] [Google Scholar]
- Revnivtsev, M., Sazonov, S., Churazov, E., et al. 2009, Nature, 458, 1142 [Google Scholar]
- Roach, B. M., Ng, K. C. Y., Perez, K., et al. 2020, Phys. Rev. D, 101, 103011 [Google Scholar]
- Saxton, R. D., Read, A. M., Esquej, P., et al. 2008, A&A, 480, 611 [NASA ADS] [CrossRef] [EDP Sciences] [Google Scholar]
- Sazonov, S. Y., & Revnivtsev, M. G. 2004, A&A, 423, 469 [NASA ADS] [CrossRef] [EDP Sciences] [Google Scholar]
- Sazonov, S., Paizis, A., Bazzano, A., et al. 2020, New Astron. Rev., 88, 101536 [Google Scholar]
- Semena, N., Pavlinsky, M., Buntov, M., et al. 2014, SPIE Conf. Ser., 9144, 91444T [Google Scholar]
- Semena, A., Mereminskiy, I., Lutovinov, A., Molkov, S., & Pavlinsky, M. 2020, ATel, 13415, 1 [Google Scholar]
- Semena, A., Doroshenko, V., Arefiev, V., et al. 2021, ATel, 14357, 1 [Google Scholar]
- Syunyaev, R. A., Arefev, V. A., Borozdin, K. N., et al. 1991, Sov. Astron. Lett., 17, 409 [Google Scholar]
- Sunyaev, R. A., Markevitch, M., & Pavlinsky, M. 1993, ApJ, 407, 606 [Google Scholar]
- Sunyaev, R., Arefiev, V., Babyshkin, V., et al. 2021, A&A, submitted [arXiv:2104.13267] [Google Scholar]
- Tanaka, T., Watanabe, S., Takeda, S., et al. 2006, Nucl. Instrum. Methods Phys. Res. A, 568, 375 [Google Scholar]
- Toyama, H., Nishihira, A., Yamazato, M., et al. 2004, Japanese J. Appl. Phys., 43, 6371 [Google Scholar]
- Vikhlinin, A., McNamara, B. R., Forman, W., et al. 1998, ApJ, 502, 558 [Google Scholar]
- Voges, W., Aschenbach, B., Boller, T., et al. 1999, A&A, 349, 389 [NASA ADS] [Google Scholar]
- Walter, R., Lutovinov, A. A., Bozzo, E., & Tsygankov, S. S. 2015, A&ARv, 23, 2 [Google Scholar]
- Winkler, C., Courvoisier, T. J. L., Di Cocco, G., et al. 2003, A&A, 411, L1 [NASA ADS] [CrossRef] [EDP Sciences] [Google Scholar]
- Wood, K. S., Meekins, J. F., Yentis, D. J., et al. 1984, ApJS, 56, 507 [Google Scholar]
- Zaznobin, I. A., Uskov, G. S., Sazonov, S. Y., et al. 2021, Astron. Lett., 47, 89 [Google Scholar]
Mikhail Pavlinsky (1959-2020) was PI for the ART-XC telescope and Co-I for the SRG observatory. He made a decisive contribution to the successful realisation of this project and the creation in Russia of a modern school of space instrumentation. To our greatest regret, in July 2020, M. Pavlinsky passed away. In his memory it was decided to name the ART-XC telescope after M. Pavlinsky – the Mikhail Pavlinsky ART-XC telescope.
NuSTAR is known to suffer from stray light contamination (the light not focused by the optics), which produces a non-uniform background. This issue was properly taken into account during the ART-XC design, which helped to significantly suppress stray light (Sect. 2.1). Additionally, ART-XC scanning mode observations (Sect. 4.2) produce a very uniform exposure coverage compared to tiling NuSTAR surveys.
All Tables
On-axis effective area of the ART-XC spare mirror system measured at the PANTER X-ray test facility.
On-axis PSF parameters of the ART-XC spare mirror system obtained using the TRoPIC pnCCD camera at the PANTER X-ray test facility.
All Figures
|
Fig. 1 ART-XC telescope. Upper left panel: face-on view of the seven MSs looking towards the detectors. Lower left panel: side view of the detector block prior to assembly; there are seven detectors located in the detector block that align with the seven MSs. Above the detector block, in the direction toward the MSs, are collimators for each detector each with a calibration source block. Right panel: complete telescope housing all seven MSs (far left in the image) and the detector block (near right) and associated hardware, including elements of the thermal control system: radiator and heat pipes. The electronic blocks in the foreground are to be mounted on a thermally stabilised platform for flight (not shown). The star tracker is located at the MS end of the carbon and copper telescope tube (hidden from view in this image). |
| In the text | |
|
Fig. 2 One mirror system being prepared for testing at the MSFC Stray Light Test Facility. |
| In the text | |
|
Fig. 3 Cross-section of the mirror system. The inner baffle tube (for stray light reduction) and the heaters are not shown. |
| In the text | |
|
Fig. 4 Mirror systems installed at the assembly stand. |
| In the text | |
|
Fig. 5 Half-power diameter of the mirror system for the nominal focus (2700 mm) and for two defocus positions of − 7 mm and − 15 mm. The HPD was measured at 8.1 keV for MS1 at the MSFC Stray Light Test Facility. |
| In the text | |
|
Fig. 6 Seven URDs in the ART-XC telescope focal plane assembly (view of the back of the detectors). |
| In the text | |
|
Fig. 7 X-ray detector hybrid integrated circuit (model SD-01). |
| In the text | |
|
Fig. 8 Leakage current vs. time for one-day operation of the CdTe detector at − 100 V. |
| In the text | |
|
Fig. 9 Flowchart of the systems, units, and interfaces of ART-XC. |
| In the text | |
|
Fig. 10 Onboard data handling structure. |
| In the text | |
|
Fig. 11 Calibration source stowed within a cylindrical lead box attached to each collimator of each telescope module (a). The lead box ensures no flux from the calibration source is measurable during astrophysical observations. The calibration source can be inserted into the collimator, as shown in the right panel b, where it illuminates its detector. |
| In the text | |
|
Fig. 12 Samples of the MS1 PSF for different offset angles at 8.1 keV (Krivonos et al. 2017). The PSF was obtained by averaging measurements at four azimuth angles. The size of each image is 400′′ × 560′′. The colour scale is logarithmic. The MS was defocused by 7 mm. |
| In the text | |
|
Fig. 13 HPD of MS1 at energies of 8.1 and 20 keV for several off-axis angles, as measured at the MSFC Stray Light Test Facility. The MS was defocused by 7 mm. |
| In the text | |
|
Fig. 14 ART-XC PSF model applicable to data of survey and scanning observations, for various source positions in the telescope field of view, at 8.1 keV. |
| In the text | |
|
Fig. 15 Energy resolution (FWHM) of ART-XC spare detector URD29 as a function of energy. The red curve is the approximation by a cubic polynomial function of
|
| In the text | |
|
Fig. 16 Estimated efficiency of the spare ART-XC detector URD29 based on the model of the efficiency of a XR-100T-CdTe detector. |
| In the text | |
|
Fig. 17 Spare ART-XC mirror system MS6 and detector unit URD29 installed at the PANTER X-ray test facility. |
| In the text | |
|
Fig. 18 Effective area of the ART-XC spare mirror system as a function of the offset angle measured by the TRoPIC pnCCD camera at the PANTER X-ray test facility. The measurements were performed in the Kα lines of Cr (5.41 keV, blue points), Cu (8.04 keV, orange points), and Ge (9.89 keV, green points). |
| In the text | |
|
Fig. 19 ART-XC on-axis effective area and field of view averaged effective area for doubly reflected events in the 4–35 keV energy bandas a function of energy (solid curves). The ART-XC effective area is based on the simulated effective area of the mirror system (the dashed lines in this figure) and URD29 detector efficiency (Fig. 16). |
| In the text | |
|
Fig. 20 Example of a scanning mode observation: Galactic Center scan on 10 Sept. 2019 (Galactic coordinates). |
| In the text | |
|
Fig. 21 Ground science segment. |
| In the text | |
|
Fig. 22 ART-XC data-processing scheme. |
| In the text | |
|
Fig. 23 Images of Cen X-3 obtained by the seven ART-XC modules in the 5–16 keV energy band (left) simultaneously with INTEGRAL/JEM-X (right). The phase curves of the pulsating signal with the period of 4.8 s are in good agreement for both instruments (green curves on each panel). |
| In the text | |
|
Fig. 24 X-ray bursters SLX 1744-299 and SLX 1744-300 and the Mouse pulsar wind nebula, obtained with the ART-XC telescope during the Galactic Bulge Survey (CalPV phase) in the 4–12 keV energy band. The angular distance between bursters is ~ 2.7′. |
| In the text | |
|
Fig. 25 PSF radial profiles averaged over the ART-XC field of view in scanning mode: red solid and dashed lines show the profiles observed for a bright X-ray source during the CalPV phase in the 4–12 keV and 10–20 keV bands, respectively, and the blue line shows the profile obtained from ground calibrations (at 8.1 keV, see above). Dotted line corresponds to the ART-XC angular resolution (Table 1). Uncertainties are shown by thin black lines. |
| In the text | |
|
Fig. 26 Calibration spectrum of the 241Am+55Fe source. The main calibration lines are indicated. The observed decrease in the intensity of the 5.9 keV line is related to the short half-life of Fe55. |
| In the text | |
|
Fig. 27 Raw detector spectrum from a 20 ks observation of the bright Galactic HMXB OAO 1657−415. |
| In the text | |
|
Fig. 28 Dynamically folded light curve of the Crab pulsar. The observed phase drift is caused by a deviation of the onboard clock frequency from the nominal value. |
| In the text | |
|
Fig. 29 Weekly-averaged rate of events in the 40–100 keV band, which is dominated by charged particles. Two telescope modules are shown. |
| In the text | |
|
Fig. 30 Map of the Galactic plane region obtained during the first year of the SRG/ART-XC all-sky survey in the 4–12 keV energy band. The region shown is of ≈ 50° × 25° size, centred on Galactic l = 355°, b = 0°, Aitoff projection. Vignetting-corrected exposure vary approximately from 30 s to 60 s in different parts of the image because of the specific survey strategy. |
| In the text | |
Current usage metrics show cumulative count of Article Views (full-text article views including HTML views, PDF and ePub downloads, according to the available data) and Abstracts Views on Vision4Press platform.
Data correspond to usage on the plateform after 2015. The current usage metrics is available 48-96 hours after online publication and is updated daily on week days.
Initial download of the metrics may take a while.