Fig. 25
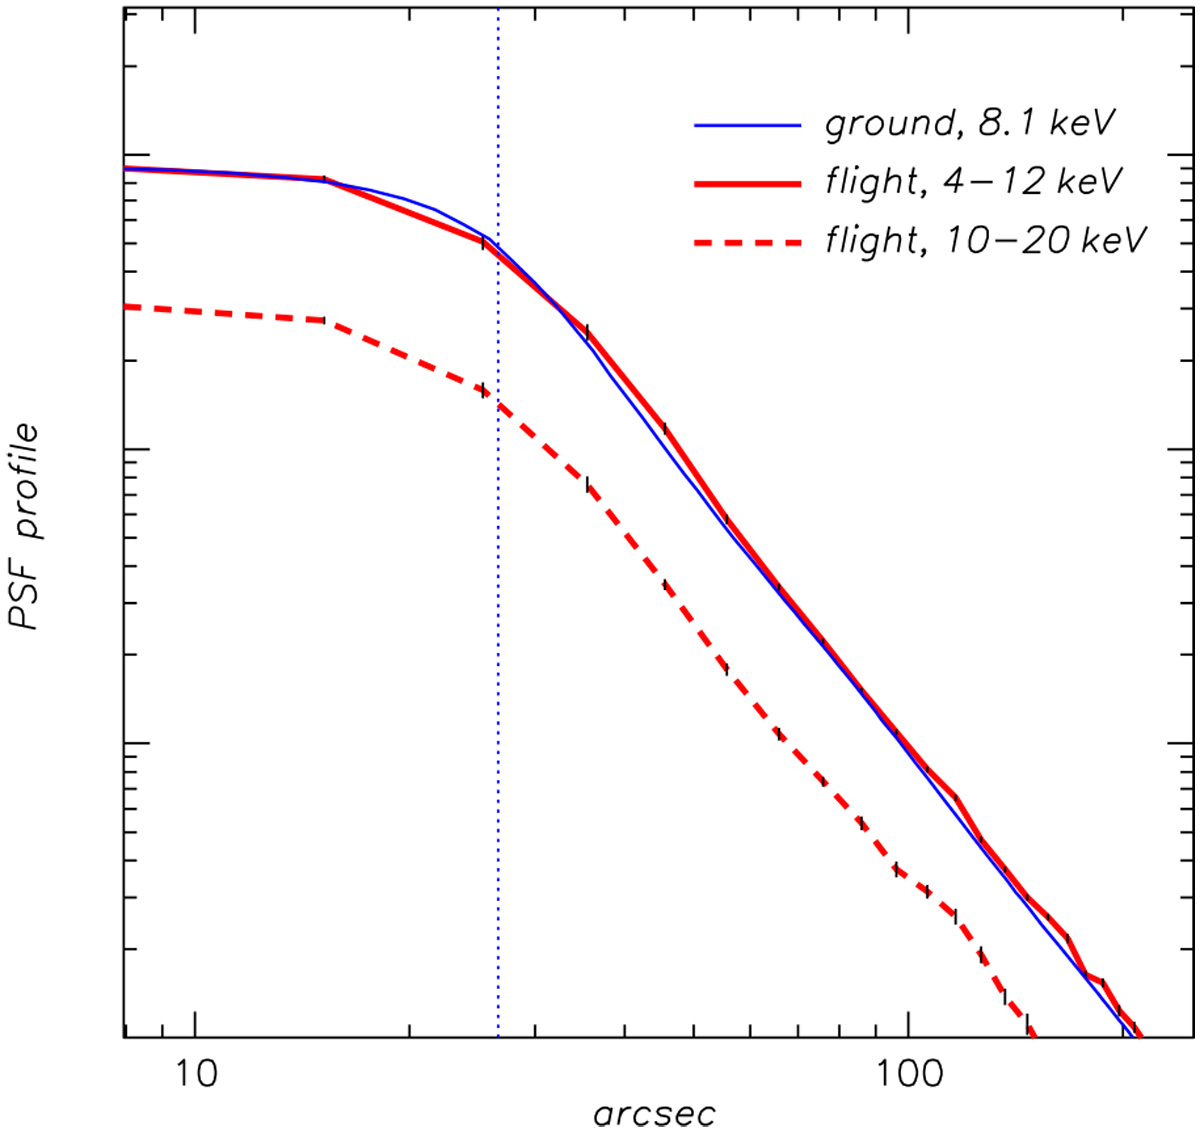
PSF radial profiles averaged over the ART-XC field of view in scanning mode: red solid and dashed lines show the profiles observed for a bright X-ray source during the CalPV phase in the 4–12 keV and 10–20 keV bands, respectively, and the blue line shows the profile obtained from ground calibrations (at 8.1 keV, see above). Dotted line corresponds to the ART-XC angular resolution (Table 1). Uncertainties are shown by thin black lines.
Current usage metrics show cumulative count of Article Views (full-text article views including HTML views, PDF and ePub downloads, according to the available data) and Abstracts Views on Vision4Press platform.
Data correspond to usage on the plateform after 2015. The current usage metrics is available 48-96 hours after online publication and is updated daily on week days.
Initial download of the metrics may take a while.