Free Access
Fig. 23
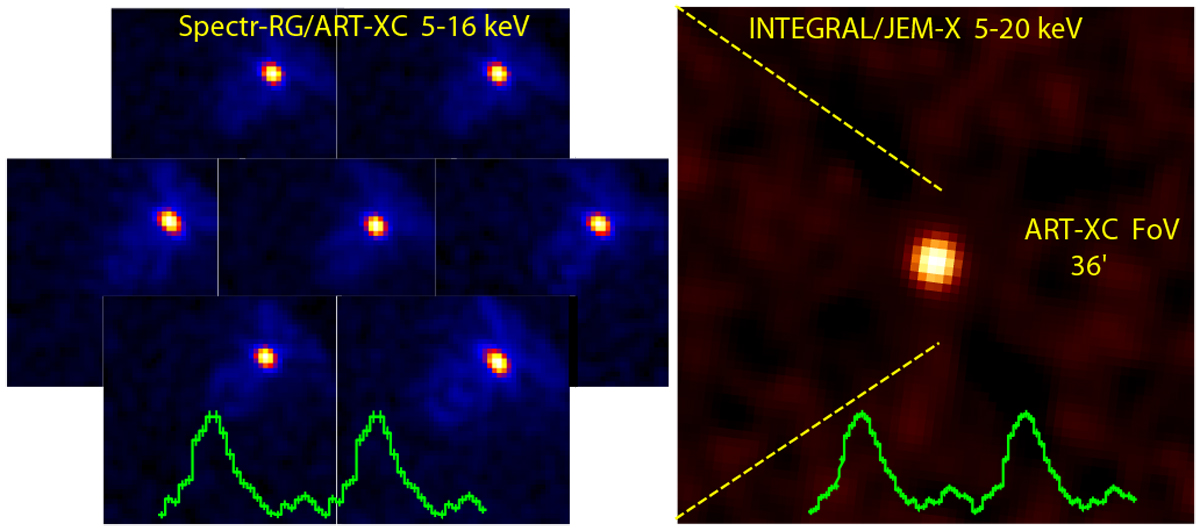
Images of Cen X-3 obtained by the seven ART-XC modules in the 5–16 keV energy band (left) simultaneously with INTEGRAL/JEM-X (right). The phase curves of the pulsating signal with the period of 4.8 s are in good agreement for both instruments (green curves on each panel).
Current usage metrics show cumulative count of Article Views (full-text article views including HTML views, PDF and ePub downloads, according to the available data) and Abstracts Views on Vision4Press platform.
Data correspond to usage on the plateform after 2015. The current usage metrics is available 48-96 hours after online publication and is updated daily on week days.
Initial download of the metrics may take a while.