| Issue |
A&A
Volume 650, June 2021
|
|
|---|---|---|
| Article Number | A55 | |
| Number of page(s) | 9 | |
| Section | Planets and planetary systems | |
| DOI | https://doi.org/10.1051/0004-6361/202039937 | |
| Published online | 04 June 2021 | |
ESPRESSO mass determination of TOI-263b: an extreme inhabitant of the brown dwarf desert
1
Instituto de Astrofísica de Canarias (IAC),
38200
La Laguna,
Tenerife,
Spain
e-mail: This email address is being protected from spambots. You need JavaScript enabled to view it.
2
Deptartamento de Astrofísica, Universidad de La Laguna (ULL),
38206
La Laguna,
Tenerife,
Spain
3
Centro de Astrobiología (CSIC-INTA),
Carretera de Ajalvir km 4,
28850
Torrejón de Ardoz,
Madrid,
Spain
4
Department of Earth and Planetary Science, The University of Tokyo,
7-3-1 Hongo,
Bunkyo,
Tokyo
113-0033,
Japan
5
Instituto de Astrofísica e Ciências do Espaço, Universidade do Porto, CAUP,
Rua das Estrelas,
4150-762
Porto,
Portugal
6
Institut für Astrophysik, Georg-August-Universität,
Friedrich- Hund-Platz 1,
37077
Göttingen,
Germany
7
Lund Observatory, Department of Astronomy & Theoretical Physics, Lund University,
Box 43,
221 00
Lund,
Sweden
8
Komaba Institute for Science, The University of Tokyo,
3-8-1 Komaba,
Meguro,
Tokyo
153-8902,
Japan
9
JST, PRESTO,
3-8-1 Komaba,
Meguro,
Tokyo
153-8902,
Japan
10
Astrobiology Center,
2-21-1 Osawa,
Mitaka,
Tokyo
181-8588,
Japan
Received:
18
November
2020
Accepted:
19
March
2021
Abstract
The TESS mission has reported a wealth of new planetary systems around bright and nearby stars amenable for detailed characterizations of planet properties and atmospheres. However, not all interesting TESS planets orbit around bright host stars. TOI-263 b is a validated ultra-short-period substellar object in a 0.56-day orbit around a faint (V = 18.97) M 3.5 dwarf star. The substellar nature of TOI-263 b was explored using multicolor photometry: a true radius of 0.87 ± 0.21 RJ was determined, establishing TOI-263 b ’s nature as somewhere between an inflated Neptune and a brown dwarf. The orbital period-radius parameter space occupied by TOI-263 b is quite unique, which prompted a further characterization of its true nature. Here, we report radial velocity measurements of TOI-263 obtained with three VLT units and the ESPRESSO spectrograph to retrieve the mass of TOI-263 b. We find that TOI-263 b is a brown dwarf with a mass of 61.6 ± 4.0 MJup. Additionally, the orbital period of the brown dwarf is found to be synchronized with the rotation period of the host star, and the system is found to be relatively active, possibly revealing a star–brown dwarf interaction. All these findings suggest that the system’s formation history might be explained via disk fragmentation and a later migration to close-in orbits. If the system is found to be unstable, TOI-263 will be an excellent target to test the migration mechanisms before the brown dwarf becomes “engulfed” by its parent star.
Key words: instrumentation: spectrographs / techniques: radial velocities / brown dwarfs / planets and satellites: formation / planets and satellites: fundamental parameters / planets and satellites: individual: TOI-263b
© ESO 2021
1 Introduction
The Transiting Exoplanet Survey Satellite (TESS) mission (Ricker et al. 2015) is dedicated to the search for transiting extrasolar planets around the brightest and closest stars in the sky. It was launched on April 18, 2018, and has recently completed its initial survey of (almost) the entire sky with 26 pointings over 2 yr. Many of the new exciting planets discovered by TESS are excellent targets for precise radial velocity (RV) follow-up to determine accurate masses and bulk properties, and to later explore the characterization of their atmospheres (Huang et al. 2018; Kostov et al. 2019; Vanderburg et al. 2019; Winters et al. 2019; Luque et al. 2019).
However, despite the thousands of planets discovered to date, many questions remain about their dominant formation mechanism(s) and the underlying statistical properties of the different exoplanet populations (Lissauer et al. 2011; Howard et al. 2012; Winn & Fabrycky 2015). Thus, new objects displaying extreme properties may deliver knowledge critical for the understanding of the formation and evolution of planetary systems. One of those extreme systems is TOI-263 b (Gaia DR2 5119203027983398656).
Parviainen et al. (2020) confirmed TOI-263 to be an M3.5 star, with an effective temperature of Teff = 3250 ± 140 K, a mass of M = 0.4 ± 0.1 M⊙, and a radius of R = 0.405 ± 0.077 R⊙. Furthermore, using ground-based multicolor photometry from MuSCAT2 at the Carlos Sanchez telescope (TCS; Narita et al. 2019), they excluded contamination from unresolved sources with a significant color difference from TOI-263 and validated TOI-263 b as a substellar object with a true radius value of 0.87 ± 0.21 RJ.
Only a few planets and brown dwarfs in short-period orbits are known and have their physical parameters measured (Deleuil et al. 2008; Moutou et al. 2013; Csizmadia et al. 2015; Persson et al. 2019, and reference therein). Any additional measurements are highly valuable for constraining the mass–radius relationship for brown dwarfs and testing substellar evolutionary models (Burrows et al. 1997; Chabrier et al. 2000; Saumon & Marley 2008). Mass measurements of a planet companion of such a faint object (V = 18.5 mag) would normally be outside the technical capabilities of current instrumentation; however, TOI-263 b has some unique properties. First, the planet/star mass ratio is large. The minimum mass scenario for TOI-263b is that of an inflated Neptune, with 1 MNep, which would produce an RV signal with an amplitude of about 35 m s−1. Larger amplitudes are expected for more massive planets. Second, the short orbital period not only makes this object unique froma formation perspective, but it helps enlarge the RV signal and allows observations to cover more than half of the orbital period of TOI-263b during a single night. Third, despite the faintness of the primary, ESPRESSO at the VLT (Pepe et al. 2014) can provide an RV that is precise enough to detect the minimum mass (1 MNep) of TOI-263b at the 5σ level.
Here, we report the outcome of such observations, which determined TOI-263b to be a brown dwarf. In Sect. 2 we detail the observing campaign with ESPRESSO. In Sect. 3 we refine the stellar properties of TOI-263, and the RV analysis is described in Sect. 4. Finally, in Sect. 5 we discuss the properties of TOI-263b and its possible formation history.
2 Observations
A time series of RV measurements were taken with ESPRESSO (Pepe et al. 2014) on the night of November 4, 2019, under program ID 105.20ND (principal investigator: E. Pallé). The observing plan was to uninterruptedly monitor TOI-263 from twilight to twilight, for nearly 9 hours, in the four-unit-telescope (4UT) mode, which allowed us to sample 70% of the orbital period. By carefully choosing the observing night, we arranged to cover the maximum and minimum RVs at phases 0.25 and 0.75 (the orbital period of TOI-263b is 13.5 hours). The continuous monitoring is important as stellar activity is known to hamper the signal of planets orbiting M stars (Reiners et al. 2010; Gomes da Silva et al. 2012). By continuously sampling the orbital period, we would normally be “freezing” the rotation-modulated activity of the star since it was expected on rather long timescales. Because of TOI-263b’s spectral type, a typical rotation period of > 20 days was presumed since no obvious photometric variability had been identified in the TESS light curves (Parviainen et al. 2020). We will see, however, that a more in-depth analysis of the TESS light curve reveals the star to be a fast rotator.
Unfortunately, our observing night was affected by adverse weather conditions and technical problems. At the beginning of the night, thick clouds prevented any data acquisition until about 1:301, when the telescopes were first opened. At that time, however, UT1 failed and, after some tests, we decided to continue observations for the night with only three UTs. Final science observations were taken from 2:10 through 8:48 and consisted of 12 consecutive spectra of 30 min of exposure time. There is a gap in the observations from roughly 4:00 to 4:30 as the object was crossing the meridian. The averaged signal-to-noise (S/N) of each individual spectrum is ~10 at 550 nm.
We reduced the raw spectral images using the ESPRESSO pipeline (version 2.0.0) within the EsoReflex environment (Freudling et al. 2013). The data were processed using standard procedures, and the extracted spectra were de-blazed, slice-merged, and order-merged. During the observations, the target was on fiber A, while fiber B pointed to the sky for a simultaneous monitoring of the sky emission. The sky spectra were scaled and subtracted from the science data by the pipeline to account for the fiber-to-fiber relative efficiency. For each reduced ESPRESSO spectrum, the cross-correlation function (CCF) of the data was computed with respect to an M3 stellar mask, and the RV together with the full width half maximum, contrast, and bisector span were obtained from a Gaussian fit to the CCF. However, due to the low S/N of the data and the high rotation of the star (see Sect. 3.2), the CCF computation failed to provide reliable RVs. Thus, we used the SERVAL code (Zechmeister et al. 2018), which produces high-precision differential RVs by means of template matching, with the template constructed as the combination of our 12 spectra. To improve the RV precision, in a previous step, we masked the hydrogen lines and several other strong chromospheric lines in the observed spectrum as they may have different activity-induced RV values.
Using the ESPRESSO exposure time calculator in the 4UT mode, 8 × 4 binning, and assuming an airmass of 1.3, a seeing of 1.2′′, and an M3 stellar template, we expected an RV precision of around 5 m s−1 in a 1 h exposure time. Our retrieved RV values, however, have a mean precision of ~160 m s−1 for a 30 min exposure time, which is about a factor of 30 worse than expected. The difference is mainly attributed to the fast rotation of the star, the use of three UTs instead of four, and, last but not least, the rapid orbital motion of all components that is noticeable in 30 min exposures. The individual RV measurements and their errors are given in Table 1.
Derived ESPRESSO RVs and Hα pEWs for TOI-263b.
3 Stellar properties
3.1 Distance and luminosity
TOI-263 is detected by the Gaia survey (Gaia Collaboration 2016) at a distance of 279.4 ± 7.9 pc with colors compatible within one subtype of the M3.5 spectral typing published in Parviainen et al. (2020). Using the Virtual Observatory tool VOSA (Bayo et al. 2008), we derived the bolometric luminosity of TOI-263 by integrating over the photometric spectral energy distribution (SED), covering from the PAN-STARRS1 g magnitude at 485 nm through the WISE W2 band at 4.6 μm. The broadband photometry employed in this process comes from the PAN-STARRS1 (Flewelling et al. 2020), 2MASS (Skrutskie et al. 2006), and WISE (Wright et al. 2010) surveys. Table 2 provides all photometric magnitudes extracted from the online catalogs together with the Gaia distance and proper motion. To complete the photometric SED toward bluer and redder wavelengths, we used a BT-Settl synthetic spectrum (Allard et al. 2012; Baraffe et al. 2017) with an effective temperature, Teff, of 3400 K and a solar metallicity and surface gravity log g of 5.0 dex (see Sect. 3.3). This model actually provides a very nice reproduction of the observed photometric SED at all photometric bands according to the VOSA fitting algorithm. The resulting bolometric luminosity and its error bar are listed in Table 2. Given the mass of the brown dwarf companion (Sect. 4), its contribution to the total luminosity of the TOI-263 system is expected to be on the order of a factor of 100 smaller than that of the parent star.
Using the accurate photometry and distance provided by Gaia, we constructed the color–magnitude diagram shown in Fig. 1, where we also depict the well-known, empirically determined mean sequences of the stellar members of the β Pictoris moving group (~20 Myr; Miret-Roig et al. 2020), the Tucana-Horologium moving group (~45 Myr; Bell et al. 2015), the Pleiades open cluster (~120 Myr; Gossage et al. 2018), and the field (possible ages in the range 0.8–10 Gyr). These sequences were taken from Luhman (2018) and Cifuentes et al. (2020) and were derived by employing Gaia data; therefore, the direct comparison with TOI-263 is feasible without any systematic effect. From its location in the Gaia color–magnitude diagram, we infer that TOI-263 has a likely age near that of the “field” and is not as young as the Pleiades cluster. We did not correct TOI-263 data for interstellar extinction because there is no evidence from its optical and infrared photometry or optical spectroscopy of strong or anomalous absorption. The field age is consistent with the stellar lithium depletion and the measured mass and radius of the brown dwarf companion (see Sect. 4).
The mass and radius of the parent early-M star were updated using the mass–K-band magnitude and the mass–radius relationships defined in Mann et al. (2019) and Schweitzer et al. (2019). These relations, which are valid forfield M-type stars with near-solar and solar metallicity, are widely used in the exoplanetary field. The absolute K-band magnitude of TOI-263 is 6.015 ± 0.100 mag, where the error bar accounts for the uncertainties in the photometry and trigonometric parallax. The derived values are compatible with those of Parviainen et al. (2020), within 1σ of the quoted uncertainties, and are listed in Table 2. The updated stellar mass and radius determinations are employed throughout this work.
Stellar and brown dwarf parameters.
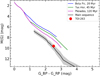 |
Fig. 1 TOI-263 located in the Gaia color–magnitude diagram together with the mean sequences of young clusters and moving groups (Luhman 2018) and the main sequence of stars (Cifuentes et al. 2020). From its location, we infer that the age of TOI-263 is close to that of the main sequence stars near the Sun. The error bars of TOI-263 are smaller than the symbol size. The gray area represents the 1σ dispersion of field M dwarfs. |
3.2 TESS photometric analysis
To explore the rotational period of the TESS photometric light curves extracted from the full frame images using eleanor (Feinstein et al. 2019). We did not use the TESS photometry provided by the Science Processing Operations Center (SPOC; Jenkins et al. 2016) at the NASA Ames Research Center since this target was only observed in 2 min cadence during Sector 3, and not in Sector 4.
We first checked for variability in the light curves from both sectors with a generalized Lomb-Scargle (GLS) periodogram (Zechmeister & Kürster 2009). There is a highly significant peak (false alarm probability <0.1%) with a period of 0.557 ± 0.001 d in the original 30 min cadence data. The same, highly significant period is found when binning the data into 5 h intervals to reduce the short-time variability (Fig. 2, top panel). Modeling the photometric variability detected with the GLS periodogram with a sinusoid, we measure the amplitudes of such a signal to be 3.4 ± 0.4 ppt and 2.9 ± 0.6 ppt for the 30 min original cadence photometry and the 3 h binned data, respectively (Fig. 2). Moreover, we modeled the TESS photometry, as in Luque et al. (2019), with a quasi-periodic Gaussian process (GP) kernel, as defined in Foreman-Mackey et al. (2017), of the form
![Mathematical equation: \begin{equation*} k_{i,j}(\tau) = \frac{B}{2+C}e^{-\tau/L}\left[\cos \left(\frac{2\pi \tau}{P_{\textrm{rot}}}\right) + (1+C)\right], \end{equation*}](/articles/aa/full_html/2021/06/aa39937-20/aa39937-20-eq1.png)
where τ = |ti − tj| is the time lag, B and C define the amplitude of the GP, L is a timescale for the amplitude modulation of the GP, and Prot is the rotational period of the GP modulations. The posterior samples of Prot are shown in Fig. 3, measuring Prot = 0.557 ± 0.001 d as detected from the GLS analysis.
Considering that the orbital period of the companion TOI-263 b is 0.5568140 ± 4.1 × 10⁻⁶ d, as computed by Parviainen et al. (2020), we verified that the measured variability does not correspond to the transits of the planet. To do so, we masked the transits and carried out the previous analyses again, finding the same results. In addition, we checked the Sector 3 TESS photometry provided by SPOC and found the same results, for both simple aperture photometry and systematics-corrected photometry (PDC; Smith et al. 2012; Stumpe et al. 2012, 2014).
We also attempted to model the phase variability using a physical phase curve model that includes reflection, thermal emission, Doppler boosting, and ellipsoidal variations with PyTransit (Parviainen 2015). However, the amplitude of the variations issignificantly larger than what would be expected and the shape of the phase curve is not modeled well with these standard components. Each of the phase curve components is expected to have an amplitude in the range of500–1000 ppm, which is significantly lower than what can be reliably measured over a companion orbit.
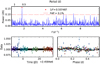 |
Fig. 2 GLS periodogram and photometric time series of the TESS light curve for TOI-263. Top: GLS periodogram of the TESS light curve from Sectors 3 and 4, (binned in 3 h intervals). The dashed red line indicates a false alarm probability threshold of 10%. The highest peak in the periodogram marked with a red dot corresponds to a period of 0.5575 ± 0.0008 d. Bottom left:TESS photometric time series modeled with a sinusoidal with a period corresponding to the highest peak in the GLS periodogram above. Bottom right: TESS photometry phase-folded to the aforementioned period, in days. |
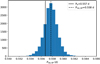 |
Fig. 3 Posterior distribution function of the Prot hyperparameter of the GP kernel. The vertical dashed line indicates the median of the distribution, while the solid vertical line indicates the orbital period of the substellar companion TOI-263 b. |
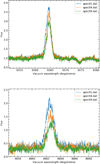 |
Fig. 4 Zoom-in of the TOI-263 ESPRESSO spectra normalized to the pseudo-continuum in the spectral regions of Hα (top panel) and Hβ (lower panel). Variability in both spectral lines on hourly timescales is visible in the spectrum. |
3.3 Spectral analysis
In order to determine the spectroscopic rotational velocity of TOI-263, we corrected all ESPRESSO spectra for the different velocities and combined all Doppler-shifted data into one single spectrum, thus increasing the S/N considerably. Then, we used a “non-rotator” of the same spectral type (using the same spectral type is important for breaking the degeneracy between temperature, gravity, and v sin i in the cool dwarf domain), observed with ESPRESSO and CARMENES, to derive v sin i = 38.6 ± 0.6 km s−1. This v sin i value agrees with the fast rotation period determined from the TESS photometry, further confirming that the rotational period of the star andthe orbital period of the planet are synchronized. According to the ESPRESSO data, TOI-263 is indeed a fast rotator, in marked contrast with what is expected for its spectral type and age (Zapatero Osorio et al. 2006; Curtis et al. 2020).
A detailed analysis of the individual ESPRESSO spectra reveals several interesting facts. First, there is no strong lithium in the stellar spectrum – the upper limit on the pseudo-equivalent width (pEW) is 40 mÅ – indicating that the star has severely depleted lithium and thus an age >20 Myr, which agrees with the dating inferred from the Gaia color–magnitude diagram in Fig. 1. Second, the Balmer lines are persistent in all spectra, are seen in emission, and are variable (see Fig. 4 for Hα and Hβ). Some line profiles are not symmetric, which is indicative of the presence of two or more components, such as rotation, flare activity, chromospheric variability, and/or contributions from the companion. TOI-263 is not detected by GALEX or ROSAT, preventing us from exploring the existence (or lack) of UV excesses. We measured the pEW of Hα emission by integrating the line profile between 655.9 and 656.9 nm; error bars were determined by changing the pseudo-continuum within the dispersion of the observed flux. The obtained values are given in Table 1 and are shown as a function of time in Fig. 5. Thus, TOI-263 is a chromospherically active star with variations of Hα emission (Reid et al. 1995).
Finally, we used the automatic tool STEPARSYN (Tabernero et al. 2018, 2021) to infer the stellar atmospheric parameters based on the new ESPRESSO data (Teff, log(g); see Table 2). The latest version of STEPARSYN relies on emcee (Foreman-Mackey et al. 2013), a Markov chain Monte Carlo (MCMC) method used to fully sample the underlying distribution of the stellar atmospheric parameters. We computed a synthetic grid using the PHOENIX BT-Settl (Allard et al. 2011) model that is particularly tailored to model low-mass late-K and M dwarfs alongside the radiative transfer code turbospectrum (Plez 2012). The line list was collected using the VALD2 and Plez (2012) databases. Our modeling rests on the fit to the TiO band system at 7 050 Å. Stellar metallicity was fixed to solar. From spectral fitting we obtain Teff = 3471 ± 33 K, log g = 4.67 ± 0.03 dex, and v sin i = 37.92 ± 0.36 km s−1, the effective temperature being compatible, within 1σ, with that obtained previously from line broadening. These values can be found in Table 2.
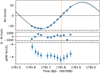 |
Fig. 5 ESPRESSO RVs values for TOI-263. Top panel: individual ESPRESSO-3UT RVs of TOI-263 shown with blue circles. The solid line represents the best Keplerian fit to the RVs, after setting strong priors on the orbital period and the phase of the brown dwarf from TESS and ground-based transit photometry analyses. Error bars fall within the size of the symbols. Middle panel: radial velocity residuals between the data and the best fitting model. The standard deviation of the RV residuals is 490 m s−1 and shows no significant periodicity. Bottom panel: pseudo-equivalent width of the Hα emission of TOI-263. The minimum occurs when the brown dwarf is hidden by its parent star (“secondary transit”) and is marked with a dashed orange line. |
4 Radial velocity analysis
Figure 5 shows the ESPRESSO RVs measured for TOI-263, which in our case are both a time series and phase-folded measurements. In the figure, the data are plotted versus the observing date.
We used EXO-STRIKER (Trifonov 2019) to determine the orbital parameters of TOI-263 b. The negative logarithm of the likelihood function of the model( ) was minimized, while the planet orbital parameters (i.e., RV amplitude, K; eccentricity, e; argument of periastron, ω; and an RV zero-point offset) were optimized; however, strong normal priors in the period and the mid-transit time were set from the results of Parviainen et al. (2020). Afterward, we estimated the uncertainties of the best-fit parameters using the MCMC sampler emcee (Foreman-Mackey et al. 2013). We adopted flat priors for all fitted parameters and selected the 68.3 confidence interval levels of the posterior distributions as 1σ uncertainties. The serval pipeline also computes several indices that can be used as stellar activity proxies (Zechmeister et al. 2018). There is a positive correlation (p = 0.62) between the Hα pEW and the dLW indices measured with serval, but there are no correlations with the remaining activity indicators, such as the CRX or NaD indices. The RV residuals, on the other hand, correlate with the CRX index (p = −0.63). Such a negative correlation is expected for active M dwarfs, and it is indicative that the remaining variability in the RVs can be attributed to stellar activity induced by spots coupled with the rotation of the star (e.g., Tal-Or et al. 2018; Baroch et al. 2020).
We do observe, however, that the pEW of Hα emission has a minimum during the secondary eclipse of TOI-263 b (see Fig. 5). We speculate that this could reflect the interaction between the magnetic fields of the star and the brown dwarf, where part of the Hα emission comes from the sub-brown dwarf stellar point or an arc of mass transfer between the star and the brown dwarf, which is occulted during the secondary eclipse. However, emission from the surface of the companion itself cannot be ruled out.
Our best-fit results yield a Keplerian solution with an amplitude of  and very small eccentricity (e = 0.02 ± 0.01), suggesting that the brown dwarf orbit is mostly circular. Assuming the stellar parameters from Parviainen et al. (2020, M⋆ = 0.4 ± 0.1 M⊙ and R⋆ = 0.405 ± 0.077 R⊙), this implies that TOI-263 b is a brown dwarf with a mass of 61.6 ± 4.0 MJup. The detailed derived properties for TOI-263 b are given in Table 2. We also derive an equilibrium temperature of Teq = 1014 K; however, this number is only useful for comparison with other ultra-short-period planetary objects. Depending on the age of the system, the intrinsic temperature of the brown dwarf, which is age-dependent, could be higher. For a ≈ 60 MJup brown dwarf, the intrinsic temperatures at 1, 2, and 5 Gyr are 1800, 1470, and 1120 K, respectively (Baraffe et al. 2017).
Given the small orbit of the brown dwarf around its parent M-type star, the brown dwarf likely resides in a tidally locked orbit; furthermore, the star also rotates with the same periodicity as the brown dwarf. Therefore, any atmospheric activity-induced variation in the observed RVs will probably be in phase with the Keplerian signal. Indeed, there are signs of this scenario in the observed variability of the Hα emission line, but we estimate that the effects will be smaller than the measured RV amplitude (< 0.6 km s−1; Tal-Or et al. 2018), even more so since we already masked many of the chromospherically active lines when computing the relative velocities. We note, however, that any correction for the activity-induced signal in the velocities would only diminish the mass of TOI-263 b, making it a more extreme inhabitant of the brown dwarf desert.
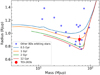 |
Fig. 6 Mass–radius diagram for all brown dwarfs found orbiting stars. TOI-263 b is shown with the solid red circle. The BT-Settl isochrones by Allard et al. (2012) and Baraffe et al. (2017) are also shown. |
5 Discussion
5.1 TOI-263 b in context
TOI-263 b, with an estimated mass of 61.6 ± 4.0 MJup and an ultra-short period of 0.56 days, is a unique and extreme brown dwarf orbiting in the so-called brown dwarf desert, where there is a paucity of brown dwarfs at short orbital periods (≲100 days); this contrasts with the more abundant population of close-in giant planets, the so-called hot Jupiters (Marcy & Butler 2000). Since the identification of the brown dwarf desert, several dozen brown dwarfs have been found by RV and transit methods at close orbital separations from their stars (Deleuil et al. 2008; Moutou et al. 2013; Csizmadia et al. 2015; Persson et al. 2019, and reference therein). In particular, CoRoT-3 b was the first transiting brown dwarf with a radius determination (1.01 ± 0.07 RJup Deleuil et al. 2008), confirming the radius dichotomy between very low-mass stars, brown dwarfs, and Jovian planets. All of them, together with TOI-263 b, are depicted in the mass–radius diagram of Fig. 6, where TOI-263 b does not occupy any special position; TOI-263 is consistent with the BT-Settl evolutionary models for ages above 500 Myr.
Most of these brown dwarfs have been found around solar-type or more massive stars, and all of them have orbital periods longer than one day, between 1.7 and 167 d. Around cooler spectral types, however, only five brown dwarfs with measured radii and masses have been found (Stassun et al. 2007; Irwin et al. 2010, 2018; Johnson et al. 2010; Gillen et al. 2017; Jackman et al. 2019). Most of these systems are young, belong to star forming associations such as Orion, USco, the Argus Young Moving Group, or the Praesepe open cluster, and are formed by a very low-mass star and a brown dwarf or a brown dwarf binary. Since substellar objects cool and get fainter with time, it is very difficult to identify these double-lined eclipsing binaries at older ages, such as that of our Sun. TOI-263 b is the sixth transiting brown dwarf discovered around an M dwarf and the one with the shortest orbital period, a record previously held by NGTS-7Ab (Jackman et al. 2019). In fact, TOI-263 b and NGTS-7Ab are the only known brown dwarfs with orbital periods shorter than one day.
Figure 7 shows period–radius and period–mass diagrams of all the confirmed extrasolar planets and brown dwarfs discovered via transit and with RV measurements to date, putting TOI-263 b in context. The period–radius diagram shows TOI-263 b to be completely isolated, at a bit more than half the radius of NGTS-7Ab. Other brown dwarfs with similar radii have much larger orbital periods (a factor of four or larger). In the period–mass diagram, TOI-263 b is much more similar to NGTS-7Ab and has an average mass relative to the population of known transiting brown dwarfs.
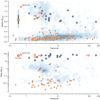 |
Fig. 7 Period–radius (top) and period–mass (bottom) diagrams of all the extrasolar planets and brown dwarfs that have been confirmed to date via transits or RVs2. The blue shaded scale indicates the density of known planets. All planets and brown dwarfs around host stars with Teff < 4000 K are individually marked with a red star or a red circle, respectively. Transiting brown dwarfs around other stellar types are marked with black circles. The position of TOI-263 b is marked with a larger red star, together with the radius and mass measurement uncertainties (within the symbol size in the latter case). For comparison, we also show the transiting brown dwarf NGTS-7Ab, which is marked separately, some individual planets, marked with Latin numbers – Kepler-45 (0), NGTS-1 (1), HATS-6 (2), and HATS-71A (3) – and known brown dwarfs, marked with Roman numerals – LP 261-75b (I), AD 3116 b (II), NLTT 41 135 b (III), and RIK 72 b (IV). |
5.2 Formation scenarios, synchronization, and tidal decay
Determining the formation history of a brown dwarf at an orbital period of 0.56 days around an M3.5 dwarf is challenging. Also, given that spin–orbit synchronization has already been achieved, we have no way of knowing its dynamical history. Nevertheless, the high companion-to-stellar mass ratio, q, of 0.09–0.21 suggests that fragmentation scenarios are more likely than core accretion scenarios because the former processes, if possible, occur much more efficiently than the latter (e.g., Chabrier et al. 2014).
Fragmentation scenarios include the simultaneous formation of close binary systems or the formation of gaseous clumps via disk instability followed by orbital migration. Magnetohydrodynamic (MHD) simulations show that the collapse of molecular clouds results in three different outcomes, depending on the ratio of the cloud’s initial rotational-to-magnetic energies (e.g., Machida et al. 2008): provided that an initial cloud has a large magnetic energy relative to its rotational energy, the ohmic dissipation works effectively in forming a close binary system. However, simulations also show that the resultant mass ratio is not so small (q ≳ 0.3; Bate et al. 2002), suggesting that the TOI-263 system (q < 0.21) is unlikely to have formed similarly to close binary systems.
On the other hand, recent hydrodynamic simulations of disk instability demonstrate that fragmentation (or clump formation) occurs around low-mass stars, when the circumstellar disk is 0.3–0.6 times as massive as the central star (Mercer & Stamatellos 2020). Such a disk mass is somewhat larger than, but similar to, the measured mass of TOI-263 b. Given that not all the initial disk gas accretes to a brown dwarf, the TOI-263 system may be explained by disk fragmentation followed by inward migration to the current close-in orbit (e.g., Forgan et al. 2018). A key question to be resolved is whether such a close companion survives orbital decay and engulfment by its host star.
Donati et al. (2008) showed that the rotation period of the planet-hosting star τ Boo is synchronized with the orbital motion of its giant planet, τ Boo b. Using their equation, one gets that the TOI-263 system is synchronized quite soon in its evolution, after 6 Ma. This clearly contrasts with the τ Boo system because here the companion is a brown dwarf, more massive than the τ Boo planet, and it is located closer to its parent star, which is the main driver of a faster synchronization.
A companion orbiting in synchronization with stellar spin evolves not through tidal energy dissipation but through the loss of the total angular momentum due to magnetic braking (Barker & Ogilvie 2009; Damiani & Díaz 2016). In the case of TOI-263 b, we have also seen that the star is magnetically active and that the brown dwarf is in a tidally locked orbit, suggesting that both mechanisms are likely in place. Following Damiani & Díaz (2016) and using the observed properties of the TOI-263 system, the orbital decay is estimated to occur on a timescale of megayears. Considering that the estimated stellar age is >10–20 Myr from the depletion of lithium in the parent star and >500 Myr from the brown dwarf mass–radius relationship (Fig. 6), one would expect TOI-263 b to have already been engulfed by the host star; however, either a very high Q, ≳ 109 (weak tides), or very weak braking, γ ≲ 10−2, could explain the timescale of TOI-263b. In any case, as Jackman et al. (2019) suggest, more observations of transiting brown dwarfs, in particular unstable systems, are required to test evolutionary scenarios. The TOI-263 system is an excellent target for this endeavor.
Finally, Fontanive et al. (2019) studied the role of stellar multiplicity in close-in massive planets and substellar companions. They conclude that binarity plays a crucial role in the existence of such objects, which are almost exclusively observed in multiple systems. Using the Gaia Second Data Release (DR2; Gaia Collaboration 2018) and the 1σ error bars, we do not detect any other source with the same distance and proper motion as TOI-263 within a projected separation of radius 105 au. Thus, any hypothetical companion to TOI-263, if it exists, would be either fainter than TOI-263, closer than 0.5″ (corresponding to a projected separation of ≈140 au at TOI-263’s distance of 279 pc, and not detected by Gaia3), or located at an orbital separation larger than 105 au.
6 Conclusions
We report here ESPRESSO 4UT mode observations of the TOI-263 system and found that TOI-263 b is a low-mass brown dwarf with a mass of 61.6 ± 4.0 MJup. With an ultra-short period of 0.56 days, TOI-263 b is the brown dwarf with the shortest period around any stellar type known to date and a unique and extreme inhabitant of the so-called brown dwarf desert. It is also one of the lightest among the transiting brown dwarfs found so far around stars of cold (Teff < 4000 K) stellar type.
We found the orbital period of TOI-263 b to be synchronized to the rotation period of the host star; this is indicative (i) of an interaction between the star and the brown dwarf that spun the stellar rotation and (ii) that the star is relatively active. All these findings combined suggest that the system formation history might be explained via disk fragmentation and a later migration to close-in orbits or the formation by core fragmentation in the first stages of the stellar system formation. These mechanisms have not yet been proven to occur for brown dwarfs, making TOI-263 an excellent system to study in detail.
Acknowledgements
Based on observations collected at the European Organisation for Astronomical Research in the Southern Hemisphere under ESO programme 105.20ND. This work is partly financed by the Spanish Ministry of Economics and Competitiveness through project PGC2018-098153-B-C31. R. L. has received funding from the European Union’s Horizon 2020 research and innovation program under the Marie Skłodowska-Curie grant agreement No. 713673 and financial support through the “la Caixa” INPhINIT Fellowship Grant LCF/BQ/IN17/11620033 for Doctoral studies at Spanish Research Centers of Excellence from “la Caixa” Banking Foundation, Barcelona, Spain. M. R. Z. O. acknowledges financial support from projects AYA2016-79425-C3-2-P and PID2019-109522GB-C51 funded by the Spanish Ministry of Science, Innovation and Universities.This publication makes use of VOSA, developed under the Spanish Virtual Observatory project supported by the Spanish MINECO through grant AyA2017-84089. VOSA has been partially updated by using funding from the European Union’s Horizon 2020 Research and Innovation Programme, under Grant Agreement n° 776403 (EXOPLANETS-A). The Pan-STARRS1 Surveys (PS1) and the PS1 public science archive have been made possible through contributions by the Institute for Astronomy, the University of Hawaii, the Pan-STARRS Project Office, the Max-Planck Society and its participating institutes, the Max Planck Institute for Astronomy, Heidelberg and the Max Planck Institute for Extraterrestrial Physics, Garching, The Johns Hopkins University, Durham University, the University of Edinburgh, the Queen’s University Belfast, the Harvard-Smithsonian Center for Astrophysics, the Las Cumbres Observatory Global Telescope Network Incorporated, the National Central University of Taiwan, the Space Telescope Science Institute, the National Aeronautics and Space Administration under Grant No. NNX08AR22G issued through the Planetary Science Division of the NASA Science Mission Directorate, the National Science Foundation Grant No. AST-1238877, the University of Maryland, Eotvos Lorand University (ELTE), the Los Alamos National Laboratory, and the Gordon and Betty Moore Foundation. This work is partly supported by JSPS KAKENHI Grant Numbers JP18H01265 and JP18H05439, and JST PRESTO Grant Number JPMJPR1775. H.M.T. acknowledges financial suppport from FCT – Fundação para a Ciência e a Tecnologia through national funds and FEDER through COMPETE2020 – Programa Operacional Competitividade e Internacionalização under these grants: UID/FIS/04434/2019, UIDB/04434/2020; UIDP/04434/2020, PTDC/FIS-AST/28953/2017, and POCI-01-0145-FEDER-028953. A.J.M. is supported by the Swedish National Space Agency (career grant 120/19C).
References
- Allard, F., Homeier, D., & Freytag, B. 2011, ASP Conf. Ser., 448, 91 [NASA ADS] [Google Scholar]
- Allard, F., Homeier, D., & Freytag, B. 2012, Phil. Trans. R. Soc. London, Ser. A, 370, 2765 [Google Scholar]
- Baraffe, I., Homeier, D., Allard, F., & Chabrier, G. 2015, A&A, 577, A42 [NASA ADS] [CrossRef] [EDP Sciences] [Google Scholar]
- Baraffe, I., Elbakyan, V. G., Vorobyov, E. I., & Chabrier, G. 2017, A&A, 597, A19 [NASA ADS] [CrossRef] [EDP Sciences] [Google Scholar]
- Barker, A. J., & Ogilvie, G. I. 2009, MNRAS, 395, 2268 [Google Scholar]
- Baroch, D., Morales, J. C., Ribas, I., et al. 2020, A&A, 641, A69 [EDP Sciences] [Google Scholar]
- Bate, M. R., Bonnell, I. A., & Bromm, V. 2002, MNRAS, 336, 705 [Google Scholar]
- Bayo, A., Rodrigo, C., Barrado Y Navascués, D., et al. 2008, A&A, 492, 277 [NASA ADS] [CrossRef] [EDP Sciences] [Google Scholar]
- Bell, C. P. M., Mamajek, E. E., & Naylor, T. 2015, MNRAS, 454, 593 [NASA ADS] [CrossRef] [Google Scholar]
- Burrows, A., Marley, M., Hubbard, W. B., et al. 1997, ApJ, 491, 856 [Google Scholar]
- Chabrier, G., Baraffe, I., Allard, F., & Hauschildt, P. 2000, ApJ, 542, 464 [Google Scholar]
- Chabrier, G., Hennebelle, P., & Charlot, S. 2014, ApJ, 796, 75 [Google Scholar]
- Cifuentes, C., Caballero, J. A., Cortés-Contreras, M., et al. 2020, A&A, 642, A115 [NASA ADS] [CrossRef] [EDP Sciences] [Google Scholar]
- Csizmadia, S., Hatzes, A., Gandolfi, D., et al. 2015, A&A, 584, A13 [NASA ADS] [CrossRef] [EDP Sciences] [Google Scholar]
- Curtis, J. L., Agüeros, M. A., Matt, S. P., et al. 2020, ApJ, 904, 140 [Google Scholar]
- Damiani, C., & Díaz, R. F. 2016, A&A, 589, A55 [CrossRef] [EDP Sciences] [Google Scholar]
- Deleuil, M., Deeg, H. J., Alonso, R., et al. 2008, A&A, 491, 889 [NASA ADS] [CrossRef] [EDP Sciences] [Google Scholar]
- Donati, J. F., Moutou, C., Farès, R., et al. 2008, MNRAS, 385, 1179 [Google Scholar]
- Feinstein, A. D., Montet, B. T., Foreman-Mackey, D., et al. 2019, PASP, 131, 094502 [Google Scholar]
- Flewelling, H. A., Magnier, E. A., Chambers, K. C., et al. 2020, ApJS, 251, 7 [NASA ADS] [CrossRef] [Google Scholar]
- Fontanive, C., Rice, K., Bonavita, M., et al. 2019, MNRAS, 485, 4967 [Google Scholar]
- Foreman-Mackey, D., Hogg, D. W., Lang, D., & Goodman, J. 2013, PASP, 125, 306 [Google Scholar]
- Foreman-Mackey, D., Agol, E., Ambikasaran, S., & Angus, R. 2017, celerite: Scalable 1D Gaussian Processes in C++, Python, and Julia [Google Scholar]
- Forgan, D. H., Hall, C., Meru, F., & Rice, W. K. M. 2018, MNRAS, 474, 5036 [Google Scholar]
- Freudling, W., Romaniello, M., Bramich, D. M., et al. 2013, A&A, 559, A96 [NASA ADS] [CrossRef] [EDP Sciences] [Google Scholar]
- Gaia Collaboration (Prusti, T., et al.) 2016, A&A, 595, A1 [NASA ADS] [CrossRef] [EDP Sciences] [Google Scholar]
- Gaia Collaboration (Brown, A. G. A., et al.) 2018, A&A, 616, A1 [NASA ADS] [CrossRef] [EDP Sciences] [Google Scholar]
- Gillen, E., Hillenbrand, L. A., David, T. J., et al. 2017, ApJ, 849, 11 [Google Scholar]
- Gomes da Silva, J., Santos, N. C., Bonfils, X., et al. 2012, A&A, 541, A9 [NASA ADS] [CrossRef] [EDP Sciences] [Google Scholar]
- Gossage, S., Conroy, C., Dotter, A., et al. 2018, ApJ, 863, 67 [NASA ADS] [CrossRef] [Google Scholar]
- Howard, A. W., Marcy, G. W., Bryson, S. T., et al. 2012, ApJS, 201, 15 [Google Scholar]
- Huang, C. X., Burt, J., Vanderburg, A., et al. 2018, ApJ, 868, L39 [Google Scholar]
- Irwin, J., Buchhave, L., Berta, Z. K., et al. 2010, ApJ, 718, 1353 [Google Scholar]
- Irwin, J. M., Charbonneau, D., Esquerdo, G. A., et al. 2018, AJ, 156, 140 [Google Scholar]
- Jackman, J. A. G., Wheatley, P. J., Bayliss, D., et al. 2019, MNRAS, 489, 5146 [Google Scholar]
- Jenkins, J. M., Twicken, J. D., McCauliff, S., et al. 2016, Proc. SPIE, 9913, 99133E [Google Scholar]
- Johnson, J. A., Aller, K. M., Howard, A. W., & Crepp, J. R. 2010, PASP, 122, 905 [NASA ADS] [CrossRef] [Google Scholar]
- Kostov, V. B., Schlieder, J. E., Barclay, T., et al. 2019, AJ, 158, 32 [Google Scholar]
- Lissauer, J. J., Ragozzine, D., Fabrycky, D. C., et al. 2011, ApJS, 197, 8 [Google Scholar]
- Luhman, K. L. 2018, AJ, 156, 271 [NASA ADS] [CrossRef] [Google Scholar]
- Luque, R., Pallé, E., Kossakowski, D., et al. 2019, A&A, 628, A39 [NASA ADS] [CrossRef] [EDP Sciences] [Google Scholar]
- Machida, M. N., Tomisaka, K., Matsumoto, T., & Inutsuka, S.-i. 2008, ApJ, 677, 327 [Google Scholar]
- Mann, A. W., Dupuy, T., Kraus, A. L., et al. 2019, ApJ, 871, 63 [NASA ADS] [CrossRef] [Google Scholar]
- Marcy, G. W., & Butler, R. P. 2000, PASP, 112, 137 [NASA ADS] [CrossRef] [Google Scholar]
- Mercer, A., & Stamatellos, D. 2020, A&A, 633, A116 [CrossRef] [EDP Sciences] [Google Scholar]
- Miret-Roig, N., Galli, P. A. B., Brandner, W., et al. 2020, A&A, 642, A179 [NASA ADS] [CrossRef] [EDP Sciences] [Google Scholar]
- Moutou, C., Bonomo, A. S., Bruno, G., et al. 2013, A&A, 558, L6 [NASA ADS] [CrossRef] [EDP Sciences] [Google Scholar]
- Narita, N., Fukui, A., Kusakabe, N., et al. 2019, J. Astron. Teles. Instrum. Syst., 5, 015001 [Google Scholar]
- Parviainen, H. 2015, MNRAS, 450, 3233 [Google Scholar]
- Parviainen, H., Palle, E., Zapatero-Osorio, M. R., et al. 2020, A&A, 633, A28 [NASA ADS] [CrossRef] [EDP Sciences] [Google Scholar]
- Pepe, F., Molaro, P., Cristiani, S., et al. 2014, Astron. Nachr., 335, 8 [Google Scholar]
- Persson, C. M., Csizmadia, S., Mustill, A. e. J., et al. 2019, A&A, 628, A64 [NASA ADS] [CrossRef] [EDP Sciences] [Google Scholar]
- Plez, B. 2012, Turbospectrum: Code for Spectral Synthesis (USA: NASA) [Google Scholar]
- Reid, N., Hawley, S. L., & Mateo, M. 1995, MNRAS, 272, 828 [NASA ADS] [Google Scholar]
- Reiners, A., Bean, J. L., Huber, K. F., et al. 2010, ApJ, 710, 432 [NASA ADS] [CrossRef] [Google Scholar]
- Ricker, G. R., Winn, J. N., Vanderspek, R., et al. 2015, J. Astron. Teles. Instrum., and Systems, 1, 014003 [Google Scholar]
- Saumon, D., & Marley, M. S. 2008, ApJ, 689, 1327 [Google Scholar]
- Schweitzer, A., Passegger, V. M., Cifuentes, C., et al. 2019, A&A, 625, A68 [NASA ADS] [CrossRef] [EDP Sciences] [Google Scholar]
- Skrutskie, M. F., Cutri, R. M., Stiening, R., et al. 2006, AJ, 131, 1163 [NASA ADS] [CrossRef] [Google Scholar]
- Smith, J. C., Stumpe, M. C., Van Cleve, J. E., et al. 2012, PASP, 124, 1000 [Google Scholar]
- Stassun, K. G., Mathieu, R. D., & Valenti, J. A. 2007, ApJ, 664, 1154 [Google Scholar]
- Stumpe, M. C., Smith, J. C., Van Cleve, J. E., et al. 2012, PASP, 124, 985 [Google Scholar]
- Stumpe, M. C., Smith, J. C., Catanzarite, J. H., et al. 2014, PASP, 126, 100 [Google Scholar]
- Tabernero, H. M., Dorda, R., Negueruela, I., & González-Fernández, C. 2018, MNRAS, 476, 3106 [Google Scholar]
- Tabernero, H. M., Dorda, R., Negueruela, I., & Marfil, E. 2021, A&A, 646, A98 [EDP Sciences] [Google Scholar]
- Tal-Or, L., Zechmeister, M., Reiners, A., et al. 2018, A&A, 614, A122 [NASA ADS] [CrossRef] [EDP Sciences] [Google Scholar]
- Trifonov, T. 2019, The Exo-Striker: Transit and Radial Velocity Interactive Fitting Tool for Orbital Analysis and N-body Simulations (USA: NASA) [Google Scholar]
- Vanderburg, A., Huang, C. X., Rodriguez, J. E., et al. 2019, ApJ, 881, L19 [Google Scholar]
- Winn, J. N., & Fabrycky, D. C. 2015, ARA&A, 53, 409 [Google Scholar]
- Winters, J. G., Medina, A. A., Irwin, J. M., et al. 2019, AJ, 158, 152 [Google Scholar]
- Wright, E. L., Eisenhardt, P. R. M., Mainzer, A. K., et al. 2010, AJ, 140, 1868 [Google Scholar]
- Zapatero Osorio, M. R., Martín, E. L., Bouy, H., et al. 2006, ApJ, 647, 1405 [NASA ADS] [CrossRef] [Google Scholar]
- Zechmeister, M., & Kürster, M. 2009, A&A, 496, 577 [NASA ADS] [CrossRef] [EDP Sciences] [Google Scholar]
- Zechmeister, M., Reiners, A., Amado, P. J., et al. 2018, A&A, 609, A12 [CrossRef] [Google Scholar]
All times are given in Universal Time.
Gaia is complete to G ≈ 17 and limited to G ≈ 21; using PHOENIX BT-Settl models for an age of 0.5 Gyr (Baraffe et al. 2015), we estimate corresponding masses of 0.37 and 0.096 M⊙. Hence, mid-to-late M dwarf companions are possible. Gaia DR2 and EDR3 (early data release 3) data are incomplete below 0.5″.
All Tables
All Figures
|
Fig. 1 TOI-263 located in the Gaia color–magnitude diagram together with the mean sequences of young clusters and moving groups (Luhman 2018) and the main sequence of stars (Cifuentes et al. 2020). From its location, we infer that the age of TOI-263 is close to that of the main sequence stars near the Sun. The error bars of TOI-263 are smaller than the symbol size. The gray area represents the 1σ dispersion of field M dwarfs. |
| In the text | |
|
Fig. 2 GLS periodogram and photometric time series of the TESS light curve for TOI-263. Top: GLS periodogram of the TESS light curve from Sectors 3 and 4, (binned in 3 h intervals). The dashed red line indicates a false alarm probability threshold of 10%. The highest peak in the periodogram marked with a red dot corresponds to a period of 0.5575 ± 0.0008 d. Bottom left:TESS photometric time series modeled with a sinusoidal with a period corresponding to the highest peak in the GLS periodogram above. Bottom right: TESS photometry phase-folded to the aforementioned period, in days. |
| In the text | |
|
Fig. 3 Posterior distribution function of the Prot hyperparameter of the GP kernel. The vertical dashed line indicates the median of the distribution, while the solid vertical line indicates the orbital period of the substellar companion TOI-263 b. |
| In the text | |
|
Fig. 4 Zoom-in of the TOI-263 ESPRESSO spectra normalized to the pseudo-continuum in the spectral regions of Hα (top panel) and Hβ (lower panel). Variability in both spectral lines on hourly timescales is visible in the spectrum. |
| In the text | |
|
Fig. 5 ESPRESSO RVs values for TOI-263. Top panel: individual ESPRESSO-3UT RVs of TOI-263 shown with blue circles. The solid line represents the best Keplerian fit to the RVs, after setting strong priors on the orbital period and the phase of the brown dwarf from TESS and ground-based transit photometry analyses. Error bars fall within the size of the symbols. Middle panel: radial velocity residuals between the data and the best fitting model. The standard deviation of the RV residuals is 490 m s−1 and shows no significant periodicity. Bottom panel: pseudo-equivalent width of the Hα emission of TOI-263. The minimum occurs when the brown dwarf is hidden by its parent star (“secondary transit”) and is marked with a dashed orange line. |
| In the text | |
|
Fig. 6 Mass–radius diagram for all brown dwarfs found orbiting stars. TOI-263 b is shown with the solid red circle. The BT-Settl isochrones by Allard et al. (2012) and Baraffe et al. (2017) are also shown. |
| In the text | |
|
Fig. 7 Period–radius (top) and period–mass (bottom) diagrams of all the extrasolar planets and brown dwarfs that have been confirmed to date via transits or RVs2. The blue shaded scale indicates the density of known planets. All planets and brown dwarfs around host stars with Teff < 4000 K are individually marked with a red star or a red circle, respectively. Transiting brown dwarfs around other stellar types are marked with black circles. The position of TOI-263 b is marked with a larger red star, together with the radius and mass measurement uncertainties (within the symbol size in the latter case). For comparison, we also show the transiting brown dwarf NGTS-7Ab, which is marked separately, some individual planets, marked with Latin numbers – Kepler-45 (0), NGTS-1 (1), HATS-6 (2), and HATS-71A (3) – and known brown dwarfs, marked with Roman numerals – LP 261-75b (I), AD 3116 b (II), NLTT 41 135 b (III), and RIK 72 b (IV). |
| In the text | |
Current usage metrics show cumulative count of Article Views (full-text article views including HTML views, PDF and ePub downloads, according to the available data) and Abstracts Views on Vision4Press platform.
Data correspond to usage on the plateform after 2015. The current usage metrics is available 48-96 hours after online publication and is updated daily on week days.
Initial download of the metrics may take a while.