Fig. 2
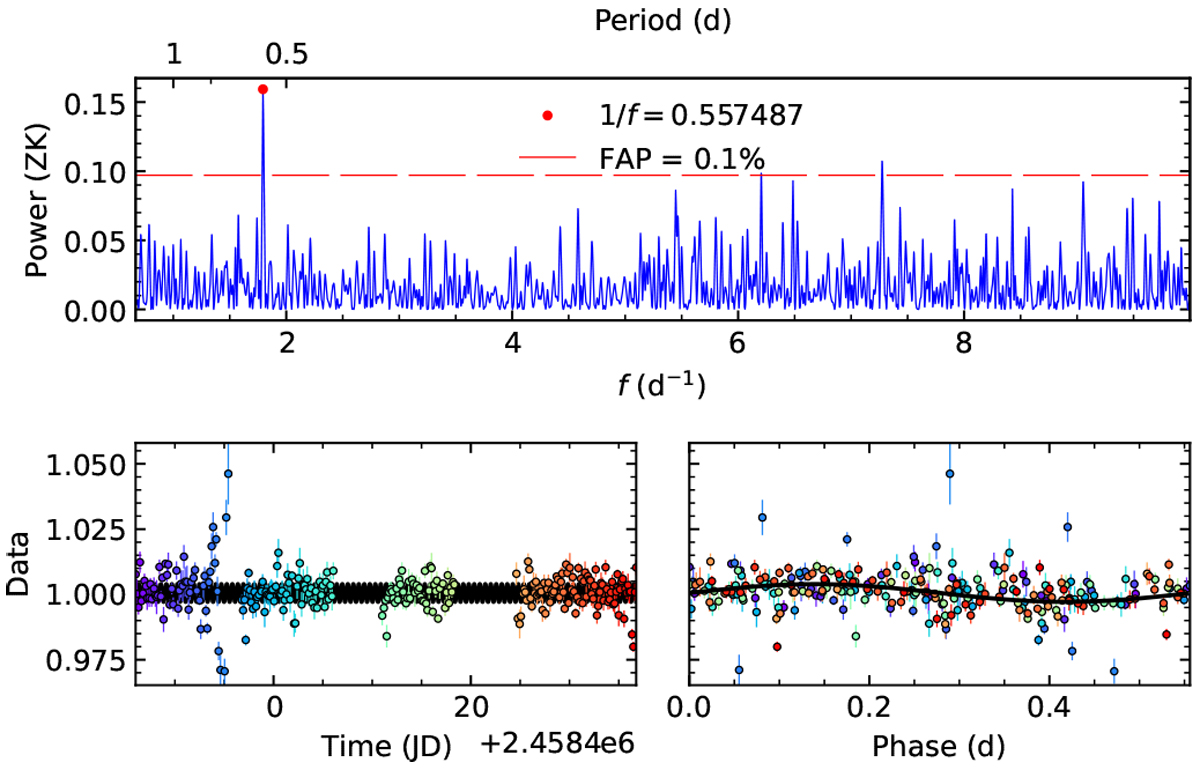
GLS periodogram and photometric time series of the TESS light curve for TOI-263. Top: GLS periodogram of the TESS light curve from Sectors 3 and 4, (binned in 3 h intervals). The dashed red line indicates a false alarm probability threshold of 10%. The highest peak in the periodogram marked with a red dot corresponds to a period of 0.5575 ± 0.0008 d. Bottom left:TESS photometric time series modeled with a sinusoidal with a period corresponding to the highest peak in the GLS periodogram above. Bottom right: TESS photometry phase-folded to the aforementioned period, in days.
Current usage metrics show cumulative count of Article Views (full-text article views including HTML views, PDF and ePub downloads, according to the available data) and Abstracts Views on Vision4Press platform.
Data correspond to usage on the plateform after 2015. The current usage metrics is available 48-96 hours after online publication and is updated daily on week days.
Initial download of the metrics may take a while.