Fig. 5
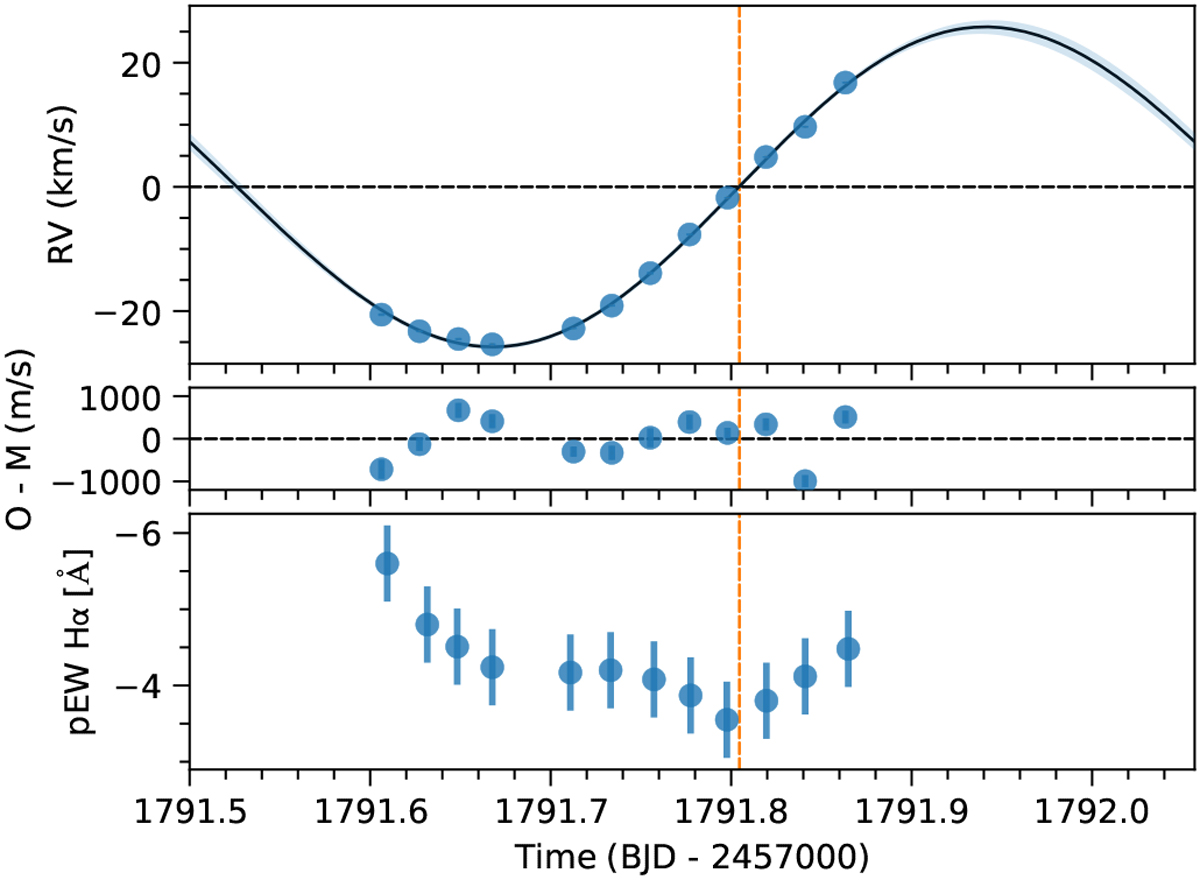
ESPRESSO RVs values for TOI-263. Top panel: individual ESPRESSO-3UT RVs of TOI-263 shown with blue circles. The solid line represents the best Keplerian fit to the RVs, after setting strong priors on the orbital period and the phase of the brown dwarf from TESS and ground-based transit photometry analyses. Error bars fall within the size of the symbols. Middle panel: radial velocity residuals between the data and the best fitting model. The standard deviation of the RV residuals is 490 m s−1 and shows no significant periodicity. Bottom panel: pseudo-equivalent width of the Hα emission of TOI-263. The minimum occurs when the brown dwarf is hidden by its parent star (“secondary transit”) and is marked with a dashed orange line.
Current usage metrics show cumulative count of Article Views (full-text article views including HTML views, PDF and ePub downloads, according to the available data) and Abstracts Views on Vision4Press platform.
Data correspond to usage on the plateform after 2015. The current usage metrics is available 48-96 hours after online publication and is updated daily on week days.
Initial download of the metrics may take a while.