Free Access
Fig. 4
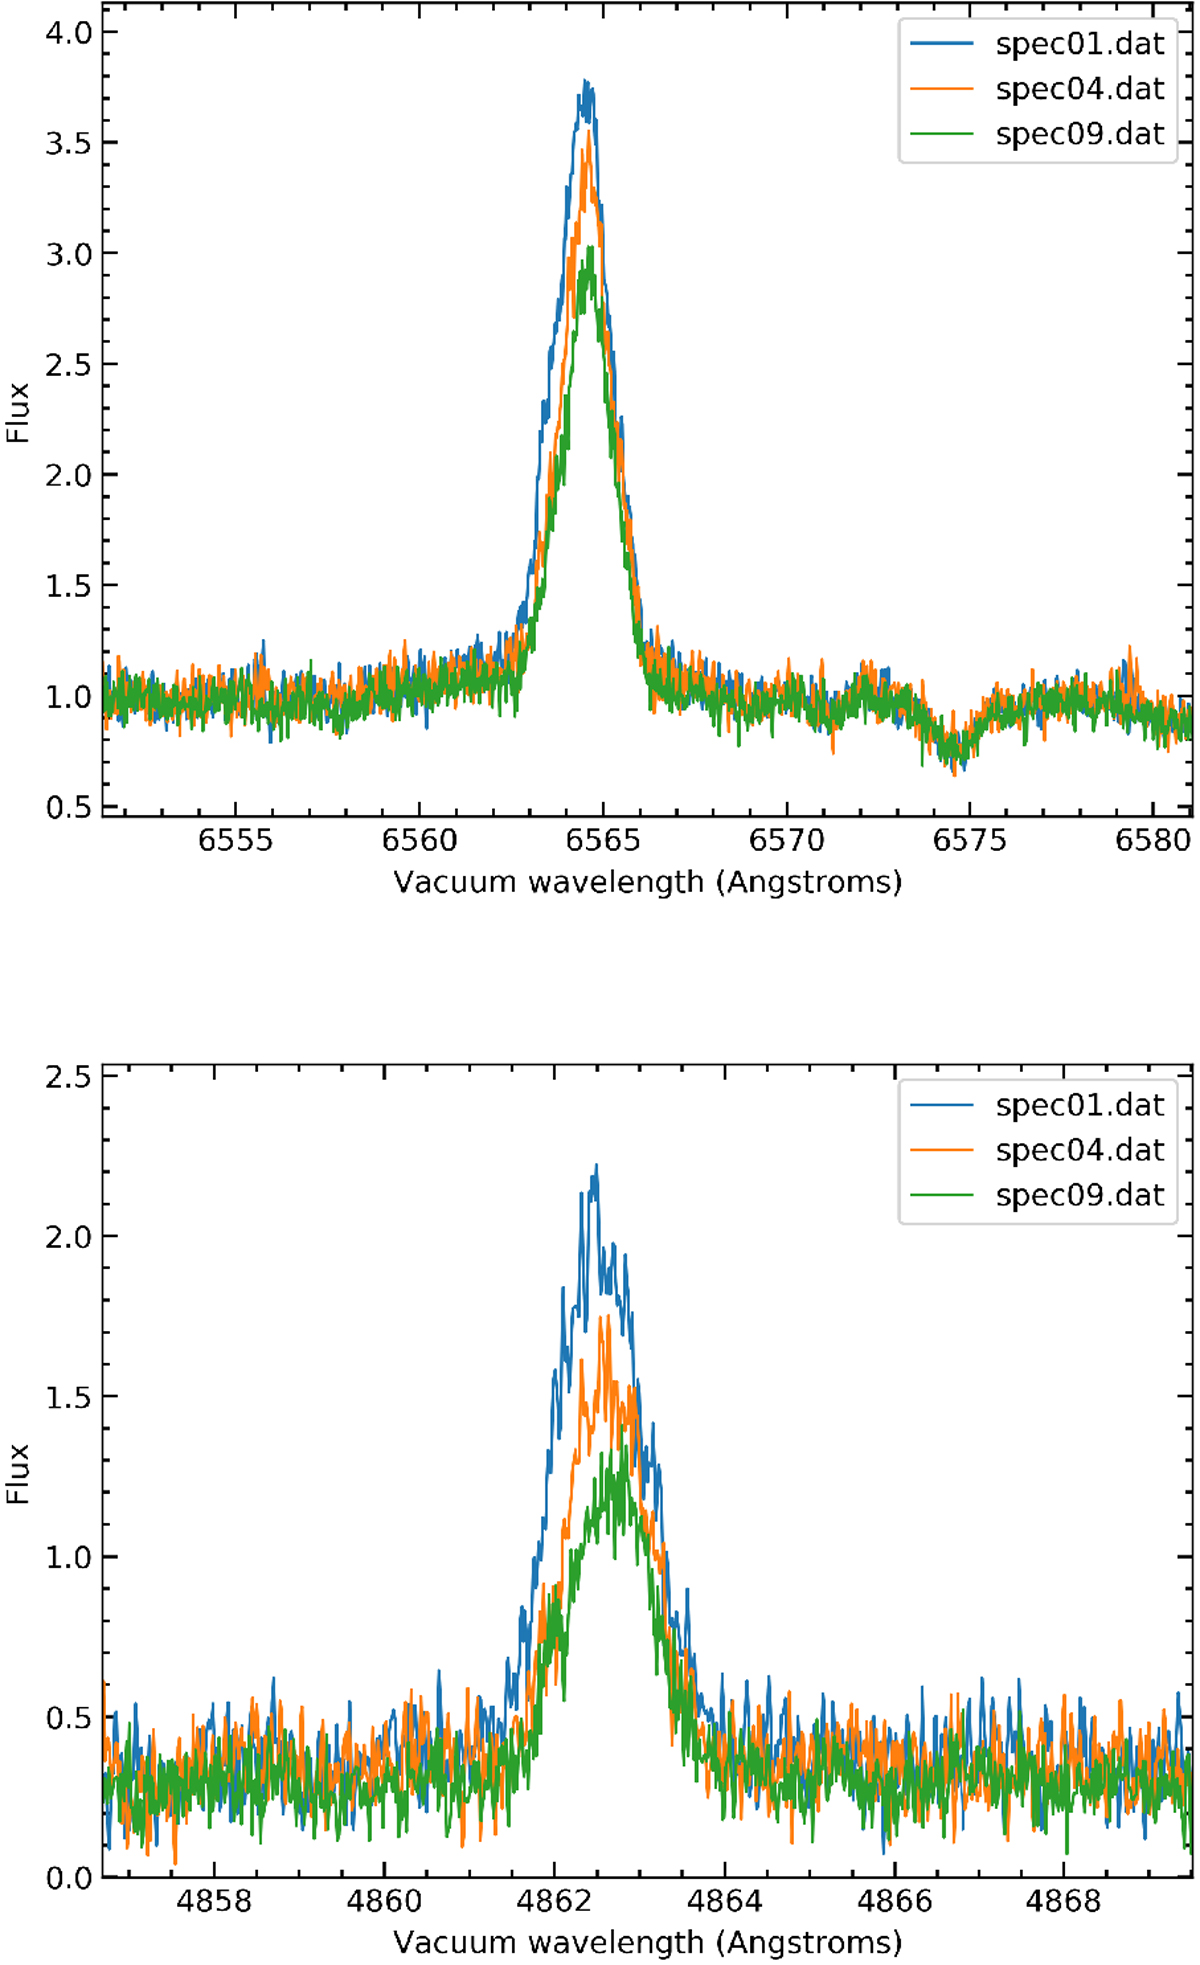
Zoom-in of the TOI-263 ESPRESSO spectra normalized to the pseudo-continuum in the spectral regions of Hα (top panel) and Hβ (lower panel). Variability in both spectral lines on hourly timescales is visible in the spectrum.
Current usage metrics show cumulative count of Article Views (full-text article views including HTML views, PDF and ePub downloads, according to the available data) and Abstracts Views on Vision4Press platform.
Data correspond to usage on the plateform after 2015. The current usage metrics is available 48-96 hours after online publication and is updated daily on week days.
Initial download of the metrics may take a while.