| Issue |
A&A
Volume 649, May 2021
|
|
|---|---|---|
| Article Number | A133 | |
| Number of page(s) | 10 | |
| Section | Extragalactic astronomy | |
| DOI | https://doi.org/10.1051/0004-6361/202140399 | |
| Published online | 27 May 2021 | |
Chandra and Magellan/FIRE follow-up observations of PSO167–13: An X-ray weak QSO at z = 6.515
1
Scuola Normale Superiore, Piazza dei Cavalieri 7, 56126 Pisa, Italy
e-mail: This email address is being protected from spambots. You need JavaScript enabled to view it.
2
Instituto de Astrofśica and Centro de Astroingenieria, Facultad de Fśica, Pontificia Universidad Católica de Chile, Casilla 306, Santiago 22, Chile
3
Department of Astronomy & Astrophysics, 525 Davey Lab, The Pennsylvania State University, University Park, PA 16802, USA
4
Institute for Gravitation and the Cosmos, The Pennsylvania State University, University Park, PA 16802, USA
5
Department of Physics, The Pennsylvania State University, University Park, PA 16802, USA
6
Dipartimento di Fisica e Astronomia, Università degli Studi di Bologna, via Gobetti 93/2, 40129 Bologna, Italy
7
INAF – Osservatorio di Astrofisica e Scienza dello Spazio di Bologna, Via Gobetti 93/3, 40129 Bologna, Italy
8
Departamento de Astronomía, Universidad de Chile, Camino del Observatorio 1515, Las Condes, Santiago, Chile
9
Jet Propulsion Laboratory, California Institute of Technology, 4800 Oak Grove Drive, Pasadena, CA 91109, USA
10
The Observatories of the Carnegie Institution for Science, 813 Santa Barbara St., Pasadena, CA 91101, USA
11
Max Planck Institut für Astronomie, Königstuhl 17, 69117 Heidelberg, Germany
12
Millennium Institute of Astrophysics (MAS), Nuncio Monseñor Sótero Sanz 100, Providencia, Santiago, Chile
13
Space Science Institute, 4750 Walnut Street, Suite 205, Boulder, CO 80301, USA
14
School of Astronomy and Space Science, Nanjing University, Nanjing 210093, PR China
15
Key Laboratory of Modern Astronomy and Astrophysics, Nanjing University, Ministry of Education, Nanjing, Jiangsu 210093, PR China
16
Collaborative Innovation Center of Modern Astronomy and Space Exploration, Nanjing 210093, PR China
17
European Southern Observatory, Alonso de Córdova 3107, Vitacura, Región Metropolitana, Chile
18
Department of Physics, University of North Texas, Denton, TX 76203, USA
19
Department of Physics, University of California, Santa Barbara, CA 93106-9530, USA
20
Physics Department, University of Miami, Coral Gables, FL 33124, USA
21
Center for Astrophysics | Harvard & Smithsonian, 60 Garden st, Cambridge, MA 02138, USA
Received:
22
January
2021
Accepted:
10
March
2021
Abstract
Context. The discovery of hundreds of quasi-stellar objects (QSOs) in the first gigayear of the Universe powered by already grown supermassive black holes (SMBHs) challenges our knowledge of SMBH formation. In particular, investigations of z > 6 QSOs that present notable properties can provide unique information on the physics of fast SMBH growth in the early Universe.
Aims. We present the results of follow-up observations of the z = 6.515 radio-quiet QSO PSO167–13, which is interacting with a close companion galaxy. The PSO167–13 system has recently been proposed to host the first heavily obscured X-ray source at high redshift. The goals of these new observations are to confirm the existence of the X-ray source and to investigate the rest-frame UV properties of the QSO.
Methods. We observed the PSO167–13 system with Chandra/ACIS-S (177 ks) and obtained new spectroscopic observations (7.2 h) with Magellan/FIRE.
Results. No significant X-ray emission is detected from the PSO167–13 system, suggesting that the obscured X-ray source previously tentatively detected was either due to a strong background fluctuation or is highly variable. The upper limit (90% confidence level) on the X-ray emission of PSO167–13 (L2−10 keV < 8.3 × 1043 erg s−1) is the lowest available for a z > 6 QSO. The ratio between the X-ray and UV luminosity of αox < −1.95 makes PSO167–13 a strong outlier from the αox − LUV and LX − Lbol relations. In particular, its X-ray emission is more than six times weaker than the expectation based on its UV luminosity. The new Magellan/FIRE spectrum of PSO167–13 is strongly affected by unfavorable sky conditions, but the tentatively detected C IV and Mg II emission lines appear strongly blueshifted.
Conclusions. The most plausible explanations for the X-ray weakness of PSO167–13 are intrinsic weakness or small-scale absorption by Compton-thick material. The possible strong blueshift of its emission lines hints at the presence of nuclear winds, which could be related to its X-ray weakness.
Key words: early Universe / galaxies: active / galaxies: high-redshift / methods: observational / galaxies: individual: J167.6415-134960 / X-rays: individuals: J167.6415-134960
© ESO 2021
1. Introduction
In the last two decades, more than 200 quasi-stellar objects (QSOs) have been discovered at z > 6, when the Universe was < 1 Gyr old, primarily thanks to the availability of wide-field optical/near-infrared (NIR) surveys (e.g., Bañados et al. 2016, 2018b; Matsuoka et al. 2018a; Fan et al. 2019; Reed et al. 2019; Belladitta et al. 2020; Yang et al. 2020; Wang et al. 2021b). The selection of high-redshift QSOs is based on the detection of the bright rest-frame UV nuclear continuum, with all of the currently confirmed z > 6 QSOs classified optically as type 1 (i.e., unobscured; but see, e.g., Matsuoka et al. 2019). Therefore, while theoretical arguments and numerical simulations (e.g., Pacucci et al. 2015; Valiante et al. 2017) usually require long periods of fast and heavily obscured mass growth onto black hole seeds (102 − 105 M⊙; e.g., Woods et al. 2019 and references therein) in order to explain the presence of 1−10 billion M⊙ supermassive black holes (SMBHs) at z > 6 (e.g., Wu et al. 2015), very little is known about the population of obscured accreting SMBHs in the early Universe from an observational point of view.
The accumulation of multiwavelength data for a continuously increasing number of optically selected high-redshift QSOs has recently made the first statistical studies of QSOs in the early Universe possible. These new data and analyses have improved our understanding of the mechanisms of SMBH formation and early growth, their interplay with their host galaxies, their environments, and the physics of re-ionization (e.g., Decarli et al. 2018; Davies et al. 2019; Farina et al. 2019; Mazzucchelli et al. 2019; Neeleman et al. 2019; Onoue et al. 2019; Eilers et al. 2020; Schindler et al. 2020; Wang et al. 2021a). One of the key results is that the observable spectral energy distribution properties of high-redshift QSOs do not appear to differ strongly from their counterparts at later cosmic times, in particular concerning the UV and X-ray emission that trace the accretion physics close to the accreting SMBHs (e.g., De Rosa et al. 2014; Gallerani et al. 2017; Mazzucchelli et al. 2017; Nanni et al. 2017; Vito et al. 2019a). However, recent results do point toward a larger fraction of weak-line QSOs (WLQs; Shen et al. 2019) and larger blueshifts of high-ionization UV emission lines at z > 6 (Meyer et al. 2019; Schindler et al. 2020), suggesting a high incidence of nuclear winds in these systems.
In addition to statistical sample studies, a few high-redshift QSOs have been the targets of more focused investigations into their properties (e.g., Eilers et al. 2018; Connor et al. 2019, 2020; Fan et al. 2019; Nanni et al. 2018; Mignoli et al. 2020; Spingola et al. 2020; Wang et al. 2021b). In Vito et al. (2019b), we discussed the peculiar X-ray properties of PSO J167.6415–13.4960 (hereafter PSO167–13; RAICRS = 11:10:33.963, DecICRS = −13:29:45.73; Venemans et al. 2015, 2020), a type 1 QSO at z = 6.515 (systemic redshift derived from the [C II] 158 μm emission line; Decarli et al. 2018). The UV luminosity of PSO167–13 (M1450 Å = −25.6) places this QSO close to the break of the UV luminosity function of z > 6 QSOs (e.g., Jiang et al. 2016; Matsuoka et al. 2018b). Atacama Large Millimeter/submillimeter Array (ALMA) imaging revealed that PSO167–13 is interacting with a companion galaxy at a projected distance of ≈0.9″ (i.e., ≈5 physical kpc at z = 6.515) and Δv ≈ −140 km s−1 (i.e., Δz ≈ −0.004) in velocity space (Willott et al. 2017; Neeleman et al. 2019). Companion galaxies detected with ALMA have been found for a significant fraction of high-redshift QSOs (Decarli et al. 2018; Venemans et al. 2020). The PSO167–13 system is one of only two cases in which the companion galaxy has been detected in the rest-frame UV via deep Hubble Space Telescope (HST) imaging (Decarli et al. 2019; Mazzucchelli et al. 2019).
A 59 ks Chandra observation of PSO167–13 revealed no counts in the 0.5–2 keV band, and three counts in the 2–5 keV band (Vito et al. 2019a,b). Due to the low background level and excellent (≈0.5″) point spread function of Chandra, the three counts represented a relatively significant detection (99.96% confidence level). The lack of a soft-band counterpart suggested that the X-ray source was heavily obscured. Although the position of the X-ray source suggested an association with the companion galaxy (with a spatial offset of ≈0.1″, to be compared with an offset of ≈1″ from the QSO), due to the close separation of the QSO-companion system and the positional uncertainty of the X-ray emission, we could not associate it unambiguously with one of the two galaxies.
Irrespective of the lack of a secure identification of the X-ray source with either of the two ALMA-detected galaxies, the optically selected QSO was not detected in the soft X-ray band, either because of obscuration or intrinsic faintness. X-ray weakness (i.e., X-ray emission fainter than the expectation based on known relations with the UV or bolometric luminosity) is often found in notable classes of optically classified type 1 QSOs, such as broad absorption line QSOs (BAL QSOs; e.g., Luo et al. 2014, Vito et al. 2018a), WLQs (e.g., Luo et al. 2015; Ni et al. 2018), and “red” QSOs (e.g., Pu et al. 2020). The available rest-frame UV spectrum of PSO167–13 (Venemans et al. 2015, 0.73h VLT/FORS2 using a 1.3″ slit, +3.33h Magellan/FIRE, using a 0.6″ slit) does not allow us to securely classify it as a BAL QSO or a WLQ. However, the C IV (1549 Å) emission line appears weak and blueshifted relative to the systemic redshift, as is often found for WLQs (e.g., Ni et al. 2018, and references therein) and, in particular, z > 6 QSOs (e.g., Schindler et al. 2020). Moreover, the noisy spectrum blueward of the C IV and Si IV emission lines could hide possible absorption features that are characteristic of BAL QSOs. With so many uncertainties in the nature of this system, deeper X-ray and rest-frame UV observations are needed.
Here we present new Chandra X-ray observations and Magellan Folded-port InfraRed Echellette (FIRE; Simcoe et al. 2008) rest-frame UV spectroscopy of PSO167–13. The goals of these observations are to confirm the presence of an obscured X-ray source in the PSO167–13 system, constrain the level of X-ray weakness of the QSO, and investigate its possible BAL QSO or WLQ nature. Errors are reported at 68% confidence levels, while limits are given at 90% confidence levels, unless otherwise noted. We adopt a flat cosmology with H0 = 67.7 km s−1 and Ωm = 0.307 (Planck Collaboration XIII 2016). At z = 6.515, 1″ corresponds to a physical distance of 5.6 kpc.
2. Observations and data analysis
In this section we briefly describe the Chandra and Magellan/FIRE observations of PSO167–13, as well as their reduction.
2.1. Chandra observations
In Cycle 21, we observed PSO167–13 with Chandra ACIS-S (S3 chip) for 117.4 ks. Considering also the 59.3 ks data set taken in 2018 (Vito et al. 2019b), the total Chandra coverage of PSO167–13 is ≈177 ks (see Table 1 for a summary of the X-ray pointings). We reprocessed the Chandra observations with the chandra_repro script in CIAO 4.12 (Fruscione et al. 2006),1 using CALDB v4.9.32 and setting the option check_vf_pha=yes in the case of observations taken in Very Faint mode.
Summary of the Chandra observations of PSO167–13.
In order to correct the astrometry of each observation, we performed source detection with the wavdetect script with a no-source probability threshold of 10−6 on each individual Chandra exposure. Then, we used the wcs_match and wcs_update tools to match the positions of the X-ray sources with more than ten counts to objects in the Pan-STARRS DR2 source mean catalog (Chambers et al. 2016)3 and correct the astrometry of the X-ray observations. The astrometry of the Pan-STARRS DR2 catalog is, in turn, registered to the Gaia DR2 astrometry (Gaia Collaboration 2018). We could not directly use the Gaia catalog due to the small number of reliable counterparts of the X-ray sources. Finally, we merged the individual observations with the reproject_obs tool and derived merged images and exposure maps. We repeated the detection procedure on the merged observation and found a median difference between the position of the X-ray sources and the Pan-STARRS catalog of ≈0.3″, which is consistent with the Chandra pixel size (≈0.5″). Only a few Gaia entries are associated unambiguously with X-ray sources, with offsets of ≈0.3–0.4″, providing a useful consistency check.
We extracted response matrices and ancillary files from individual pointings using the specextract tool and added them using the mathpha, addrmf, and addarf HEASOFT tools4, weighting by the individual exposure times. Ancillary files, which are used to derive fluxes and luminosities, were aperture-corrected.
2.2. Magellan/FIRE observations
We obtained NIR spectroscopy for PSO167–13 in the range λ = 0.8−2.5 μm with Magellan/FIRE during three nights (March 3–5, 2020), for a total of 9.9 h on source. Observations were conducted during gray time, using the 1″ wide slit in the high-resolution echellete mode, with a nominal resolution of R = 3600. During these observations, the sky conditions were unstable, with rapidly varying seeing (≈0.7″ − 2″) and sky background. We rejected the exposures with seeing > 1.5″, lowering the useful amount of on-source time to 7.2 h. The individual spectra were obtained using the nodding technique (3″ nod length) in a sequence of ABBA acquisitions (44 exposures, each of 602.4 s). The data were reduced with the Interactive Data Language (IDL) pipeline FireHose v2 package (Gagné et al. 2015) and custom Python scripts. OH airglow was used to correct for telescope flexure and obtain the wavelength solution. Nearby A0V stars with airmasses similar to that of the target were observed after each ABBA block in order to derive telluric absorption corrections and absolute flux calibrations, which we applied to the corresponding ABBA block, and to define the extraction traces. We corrected for Galactic extinction (E(B − V) = 0.0485, from Schlafly & Finkbeiner 2011) with the extinction curve from Fitzpatrick (1999).
3. Results
In this section, we report the results derived from the Chandra observations of PSO167–13 and the companion galaxy as well as the Magellan/FIRE spectroscopic observations of PSO167–13.
3.1. X-ray photometry of the companion galaxy
We present in Fig. 1 the Chandra images in the soft (0.5–2 keV), hard (2–7 keV), and full (0.5–7 keV) bands of the PSO167–13 system. As we did in Vito et al. (2019b), here we used a 1″ radius extraction region (green circle in Fig. 1; corresponding to ≈90% encircled energy fraction at 1.5 keV), centered on the ALMA position of the companion galaxy (RA = 11:10:34.033, Dec = −13:29:46.29; Neeleman et al. 2019) to compute its photometry. We computed the detection significance in each energy band using the binomial no-source probability PB presented by Weisskopf et al. (2007) and Broos et al. (2007) and set a significance threshold of (1 − PB) = 0.99 for source detection. We measured the X-ray background in an annular region with Rin = 4″ and Rout = 24″, where no bright X-ray sources are found. We detected one, three, and four counts in the soft, hard, and full bands, respectively. Considering the expected background of 0.35, 0.59, and 0.93 counts, respectively, we obtained a detection significance of (1 − PB) < 0.99 in all of the bands (i.e., the galaxy is not detected). Following the method in Weisskopf et al. (2007), we computed upper limits on the net counts of < 3.6, < 6.1, and < 7.1 in the soft, hard, and full bands, respectively.
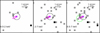 |
Fig. 1. Chandra 5″ × 5″ images in the soft, hard, and full bands for the total 177 ks exposure. North is up, and east is left. The magenta contours show the [C II] emission detected with ALMA (0.33″ × 0.22″ beam size) of the PSO167–13 (main emission) and companion (fainter emission to the southeast) system from 4σ to 20σ in steps of 4σ (Venemans et al. 2020; see also Neeleman et al. 2019). The blue X symbols mark the optical position of PSO167–13 (Venemans et al. 2020). The black circles denote the 1″ extraction radius used throughout the text for PSO167–13. The green circle indicates the 1″ extraction radius used for the companion galaxy (shown only in the right panel for clarity). |
In order to compute upper limits on the observed flux in the three bands, we assumed power law emission with Γ = 2. This Γ value is typical of rapidly accreting SMBHs (e.g., Shemmer et al. 2008; Brightman et al. 2013) and is consistent with the average photon index derived for optically selected QSOs up to z ≈ 7.5 (e.g., Nanni et al. 2017; Bañados et al. 2018a; Vito et al. 2018b), although hints for steeper photon indexes at z ≳ 6.5 have been reported by Vito et al. (2019a) and Wang et al. (2021a). Accounting also for Galactic absorption toward the PSO167–13 system (NH = 4.7 × 1020 cm−2; e.g., Kalberla et al. 2005), we estimate fluxes of F < 1.9 × 10⁻¹⁶ , F < 6.6 × 10⁻¹⁶, and F < 5.0 × 10⁻¹⁶ erg cm−2 s−1 in the soft, hard, and full bands, respectively. Although the exact values of the upper limits depend on the choice of Γ, the errors on the flux are largely dominated by the statistical uncertainties on the X-ray counts. We computed the upper limit on the intrinsic 2–10 keV luminosity from the soft-band flux, consistently with previous works (e.g., Vito et al. 2019b,a), as LX < 1.3 × 1044 erg s−1.
3.2. X-ray photometry of PSO167–13
We computed the X-ray photometry of PSO167–13 in a circular region of R = 1″ centered on the optical/NIR position of the QSO (RA = 11:10:33.638, Dec = −13:29:45.73), which is provided by Venemans et al. (2020) based on the Gaia DR2 astrometry. They also report a small offset (≈0.15″) between the optical/NIR coordinates (blue cross in Fig. 1) and the peak position of the dust continuum and [C II] emission line of the QSO (magenta contours), possibly due to the QSO host galaxy being stretched during the ongoing interaction with the close companion galaxy (Venemans et al. 2020) and to the presence of a gas “bridge” component (Neeleman et al. 2019).
We detected zero, two, and two counts in the soft, hard, and full bands, corresponding to < 2.3, < 4.8, and < 4.5 net counts5, respectively (Weisskopf et al. 2007). As in Sect. 3.1, we converted the upper limits on the counts into fluxes of F < 1.2 × 10⁻¹⁶ , F < 5.1 × 10⁻¹⁶ , and F < 3.2 × 10⁻¹⁶ erg cm−2 s−1 in the soft, hard, and full bands, respectively, as well as a rest-frame 2–10 keV luminosity of LX < 8.3 × 1043erg s−1. We note that one count in the hard band lies within the extraction regions of both the QSO and the companion galaxy due to their small angular separation, such that the fluxes in the hard and full bands for at least one of these galaxies are overestimated. Figure 2 presents the X-ray luminosity versus bolometric luminosity6 of QSOs at z > 6 and lower. The upper limit on PSO167–13 at Lbol = 4.1 × 1046 erg s−1 is significantly lower than the X-ray luminosity of X-ray detected QSOs at z > 6, and it is a stronger constraint than the available upper limits on other undetected sources. The upper limit on LX for PSO167–13 translates into a bolometric correction Kbol = Lbol/LX > 492, to be compared with a typical value of Kbol ≈ 100 for QSOs with similar bolometric luminosities.
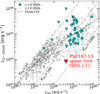 |
Fig. 2. X-ray luminosity versus bolometric luminosity for z > 6 QSOs (cyan symbols) from Connor et al. (2019, 2020), Vito et al. (2019a), Pons et al. (2020), and Wang et al. (2021a), compared with z < 6 QSOs (gray symbols) from Lusso et al. (2012), Martocchia et al. (2017), Nanni et al. (2017), and Salvestrini et al. (2019) and the LX − Lbol relation (black dashed line) from Duras et al. (2020). Only radio-quiet QSOs are shown. Circles represent detected sources, and downward pointing triangles mark upper limits. PSO167–13 is shown in red. Diagonal dotted lines mark the loci of constant bolometric correction (i.e., Kbol = Lbol/LX). |
The relative contribution of the X-ray and UV emission in QSOs is usually parametrized by the quantity αox = 0.38 × log(L2 keV/L2500 Å), which represents the slope of a nominal power law connecting the emission in the two bands (e.g., Brandt & Alexander 2015 and references therein). We measured L2500 Å = 1.3 × 1031 erg s−1 Hz−1 from the best fitting UV continuum of the 2020 FIRE spectrum of PSO167–13 (see Sect. 3.3) and converted the upper limit on L2−10 keV into L2 keV < 1.07 × 1026 erg s−1 Hz−1 (assuming power law emission with Γ = 2). From these values, we derived αox < −1.95, which is the lowest value for a z > 6 QSO, and among the lowest values for the general QSO population (see Fig. 3).
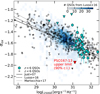 |
Fig. 3. Values of αox plotted against UV luminosity for PSO167–13 (in red) and other z > 6 QSOs (cyan filled symbols) from Connor et al. (2019, 2020), Vito et al. (2019a), and Wang et al. (2021a) as well as the updated values of the Pons et al. (2020)z > 6.5 QSOs (Pons et al. 2021). We also show z < 6 QSOs (empty black symbols and the blue color map) from Shemmer et al. (2006), Steffen et al. (2006), Just et al. (2007), Lusso & Risaliti (2016), Nanni et al. (2017), and Salvestrini et al. (2019) and the best fitting relations from Just et al. (2007), Lusso & Risaliti (2016), and Martocchia et al. (2017). Circles represent detected sources, and downward pointing triangles mark upper limits. For visual purposes, we do not plot X-ray undetected sources included in the Lusso & Risaliti (2016) sample. |
A well-known anticorrelation exists between αox and LUV up to z > 6 (e.g., Just et al. 2007; Lusso & Risaliti 2016; Martocchia et al. 2017; Nanni et al. 2017; Vito et al. 2019a). Therefore, a fairer comparison between QSOs with different UV luminosities can be made considering the values of 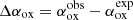 , that is, the difference between the observed αox and the value expected for a given QSO’s UV luminosity. Assuming the Just et al. (2007) relation, as in Vito et al. (2019a), we find Δαox < −0.30 for PSO167–13. The value of Δαox for PSO167–13 implies a factor of ≳6 weaker X-ray emission than the expectation, in agreement with the QSO location in Fig. 2. Among the X-ray detected QSOs at z > 6, none show such a level of X-ray weakness, and undetected sources have shallower upper limits (Fig. 4).
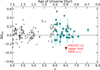 |
Fig. 4. Values of Δαox as a function of redshift for z > 4 QSOs. Symbols are the same as in Fig. 3. The upper limit on PSO167–13 suggests it is the most extreme X-ray weak quasar known to date beyond z > 4. |
3.3. Rest-frame UV spectroscopy of PSO167–13
Figure 5 presents the rest-frame UV spectrum of PSO167–13 we obtained with Magellan/FIRE in 2020. We compared it with the 2014 spectrum presented by Venemans et al. (2015). After flux calibration, the normalization of the 2020 spectrum is ≈15% lower than that reported in Venemans et al. (2015), most likely due to the varying seeing between the target and standard-star observations affecting the flux calibration in 2020. We therefore normalized the 2020 spectrum to the 2014 flux at 3000 Å. Strong atmospheric absorption completely suppresses the QSO emission at rest frame ≈ 1790 − 1900 Å and ≈ 2360 − 2690 Å (see the upper panel in Fig. 5). Therefore, we masked these two spectral windows in Fig. 5.
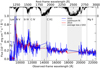 |
Fig. 5. Rest-frame UV spectrum of PSO167–13 obtained with our 2020 Magellan/FIRE observations (solid blue line), compared with the Venemans et al. (2015) spectrum (taken in 2014; solid red line). We have applied a median filter with a ≈ 20 Å kernel for visual purposes, as in Mazzucchelli et al. (2017). The average low-redshift QSO spectrum of Vanden Berk et al. (2001), normalized to the rest-frame 3000 Å flux of the Venemans et al. (2015) spectrum, is shown as a gray line. We also present the best fitting UV power law continuum of the 2020 spectrum as a dashed blue line, and the expected location of QSO emission lines at z = 6.515 as vertical dotted lines. We also show an example of atmospheric transmission during our FIRE observations (black line). Regions with transmission < 0.6 are marked with gray stripes. In particular, two spectral windows centered at rest frames ≈ 1800 Å and ≈ 2500 Å are completely affected by the very low atmospheric transmission and are thus masked in the spectra. |
We fitted the rest-frame UV continuum to the unbinned 2020 spectrum in the spectral regions 2000–2350 Å, 2690–2750 Å, and 2850–3000 Å, assuming a power law of the form
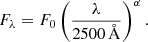 (1)
(1)
The best fitting slope, α = −1.10 ± 0.12, is in agreement with the result from Mazzucchelli et al. (2017) and is redder than the typical QSO value (α = −1.7; e.g., Selsing et al. 2016, see also Venemans et al. 2015).
3.3.1. Caveats on the rest-frame UV spectrum
Despite the longer on-source exposure, the 2020 Magellan/FIRE spectrum is noisier than the 2014 spectrum of PSO167–13 due to the poor atmospheric conditions reported in Sect. 3.3. For instance, in the H band (where no strong QSO emission lines are expected at z = 6.515), we estimate signal-to-noise ratios (S/N)7 of ≈3.0 and ≈4.5 for the 2020 and the 2014 spectra, respectively. In the following subsections, we describe the main spectral features visible in the spectrum and the parameters derived with a basic analysis for completeness. However, we warn that the results should be treated as merely indicative and with caution.
3.3.2. C IV emission line
Figure 6 zooms in on the 1.0−1.3 μm spectral region. The C IV (1549 Å) emission line was not clearly detected in the 2014 spectrum (Mazzucchelli et al. 2017), but there is a tentative detection of this emission line in the 2020 spectrum, with a nominal total S/N ≈ 5. Since it falls in a spectral region of relatively strong telluric absorption, it is unclear whether such a line is real or is partially or totally an artifact due to atmospheric correction. In this respect, future observations of PSO167–13 with the James Webb Space Telescope (JWST) can confirm the presence and properties of this line.
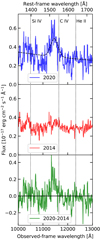 |
Fig. 6. Zoom-in of the spectral region of the 2020 (top panel) and 2014 (middle panel) spectra encompassing the C IV emission line of PSO167–13. Bottom panel: difference between the two epochs. The dashed black line in the top panel marks the best fitting continuum plus single Gaussian model of the C IV emission line. |
Assuming this feature is real, we fitted the unbinned spectrum with a single Gaussian function to derive basic parameters using a χ2 minimization approach. The line peaks at rest frame 1525 ± 4.4 Å (i.e., it is blueshifted by Δv ≈ −4565 ± 859 km s−1), with a FWHM = 9063 ± 2040 km s−1 and rest-frame equivalent width (REW) of  . Absorption features might be present blueward of the Si IV and C IV emission lines, but a spectrum with higher S/N is required to test this scenario.
3.3.3. Mg II emission line
The Mg II (2798 Å) emission line is an important feature in the spectra of high-redshift QSOs, as it is often used to obtain single-epoch estimates of the SMBH mass (e.g., Vestergaard & Osmer 2009; Shen et al. 2011). Based on their analysis of the 2014 spectrum of PSO167–13, Mazzucchelli et al. (2017) reported a  and estimated MBH = 3 × 10⁸ M⊙ using the calibration of Vestergaard & Osmer (2009):
 (2)
(2)
Figure 7 shows the PSO167–13 spectrum in the 2.0−2.2 μm spectral region. We fitted the Mg II line assuming: a QSO UV power law continuum (Eq. (1)); the Balmer pseudo-continuum modelled as in Schindler et al. (2020); the iron pseudo-continuum template from Vestergaard & Wilkes (2001), convolved with a Gaussian function with σ equal to that of the best fitting Mg II line (see, e.g., Vestergaard & Wilkes 2001; Schindler et al. 2020); and a single Gaussian function. The best fitting model is shown as a dashed blue line in Fig. 7. The Gaussian is centered at rest frame λ = 2786 ± 3 Å, that is, Δv ≈ −1268 ± 306 km s−1 from the expected position given by the [C II] systemic redshift. The fit returns an  , which is consistent with typical values for z > 6 QSOs (e.g., Onoue et al. 2020; Schindler et al. 2020).
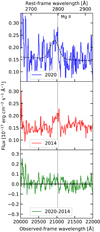 |
Fig. 7. Zoom-in of the spectral region of the 2020 (top panel) and 2014 (middle panel) spectra encompassing the Mg II emission line of PSO167–13. Bottom panel: difference between the two epochs. The dashed black line in the top panel marks the best fitting continuum plus single Gaussian model of the Mg II emission line. |
The Mg II width (FWHMMg II = 3947 ± 758 km s−1) is significantly larger than the value found by Mazzucchelli et al. (2017); it translates into MBH = 1.1 × 10⁹ M⊙8 and an Eddington ratio of λEdd = 0.3. We caution that the line’s blueshift may indicate the presence of outflowing nuclear winds (see Sect. 4.3), in which case the virial assumption upon which the black hole mass estimate is based would be affected. In addition, the limited spectral quality and the different black hole mass value obtained from the 2014 spectrum lead us to refrain from over-interpreting these results.
4. Discussion
4.1. X-ray emission from the companion galaxy
In Vito et al. (2019b), we discussed the detection of a faint and a hard X-ray source in the PSO167–13 system, consistent with the position of the companion galaxy, although the relatively large positional uncertainty prevented us from discarding an association with the optical QSO. If the X-ray source had been confirmed with the new Chandra observations and an unambiguous association with the companion galaxy had been obtained, it would have been considered an (obscured) QSO, and the PSO167–13 system would have been a QSO pair at high redshift.
Considering the total 177 ks coverage (Sect. 3.1), the significance of the emission in the full band (P = 0.985) is slightly below the detection threshold used in (i.e., P = 0.99 Vito et al. 2019b,a) and is dominated by the three counts that were already reported in Vito et al. (2019b). We note that in that work we used a narrower energy band for detection (i.e., 2–5 keV). Repeating the detection procedure in that band and including the new Chandra observations, the emission is still nominally significant (P = 0.992), with  net counts, implying
  .
.
Based on the three net counts detected in 59.3 ks in the 2018 pointing (Vito et al. 2019b), we would have expected to detect 5.7 counts in the new observations (117.4 ks) if the detection were real (i.e., not due to spurious background emission) and not highly variable. Instead, we detected none, corresponding to a Poisson probability of P(k = 0, μ = 5.7) = 0.003. Therefore, either the counts detected in the 2018 observation were due to a strong background fluctuation (in Vito et al. 2019b we assigned a probability of 4 × 10⁻⁴ to this possibility) or the X-ray source is variable at a 0.997 significance. In the latter case, comparing the flux derived in Vito et al. (2019b, i.e.,  ) with the flux computed from the new 117.4 ks only (i.e., F2−5 keV < 2 × 10⁻¹⁶ erg cm−2 s−1), the X-ray source would have dimmed by a factor of ≈4 from 2018 to 2020 (i.e., about three months in the QSO rest frame). A similar variability (i.e., a factor of ≈2.5 in flux over a period of ≈2 years in the rest frame) was reported by Nanni et al. (2017) for another z > 6 QSO, namely SDSS J1030+0524 (see also Shemmer et al. 2005 for a z = 5.41 SDSS QSO).
Whatever the cause, we do not confirm the presence of significant X-ray emission from the PSO167–13 system, and in particular from the companion galaxy. To date, out of the ≈20 companion galaxies currently detected with ALMA close to z > 6 QSOs (Willott et al. 2017; Decarli et al. 2017, 2018; Neeleman et al. 2019; Venemans et al. 2020), none have been detected in the X-rays with high significance (i.e., P > 0.99; see also Connor et al. 2019, 2020).
4.2. X-ray weakness of PSO167–13
The X-ray weakness of PSO167–13 discussed in Sect. 3.2 (i.e., more than six times weaker than expected based on its UV luminosity) is notable. Broad absorption line QSOs have generally been found to be X-ray weak, by factors up to ≈100 in extreme cases (e.g., Gallagher et al. 2006; Gibson et al. 2009; Luo et al. 2014; Liu et al. 2018), which is possibly linked to the acceleration of nuclear winds in these objects (see Sect. 4.3).
Among the general SDSS radio-quiet and non-BAL QSO population, Pu et al. (2020) found that only ≈6% show similar levels of X-ray weakness, and they are preferentially WLQs or red QSOs (see also, e.g., Ni et al. 2018; Timlin et al. 2020b). Applying this fraction to the total number of z > 6 QSOs currently observed in the X-ray band (i.e., 36; Vito et al. 2019a and references therein, Connor et al. 2019, 2020; Pons et al. 2020; Wang et al. 2021a), we expect ≈2 of them to be X-ray weak by factors greater than six. However, we note that some z > 6 QSOs with X-ray observations are BAL QSOs (e.g., Fan et al. 2003; Matsuoka et al. 2016; Connor et al. 2020). Hence, they should not be considered here for a proper comparison with the Pu et al. (2020) sample, which includes only radio-quiet and non-BAL QSOs, thus decreasing the expected number of X-ray weak QSOs at z > 6. Given the quality of the currently available rest-frame spectrum, PSO167–13 cannot be securely identified either as a WLQ or a BAL QSO, although there might be evidence for the presence of nuclear winds (see Sect. 4.3).
Several physical reasons can be invoked to explain the lack of strong X-ray emission from a type 1 QSO. First, intrinsic X-ray weakness may be caused by a different geometry or physics of the hot corona from those of typical QSOs. For instance, the hot corona may be quenched, disrupted, or not yet formed, due to currently poorly understood causes (e.g., Leighly et al. 2007; Luo et al. 2013, 2014; Liu et al. 2018). In this case, the accretion disk can remain largely unaffected and emit UV photons as a typical QSO.
Second, absorption on scales smaller than most of the accretion disk (e.g., due to a thick inner disk, a “failed wind,” or the outflowing material itself in the case of radiation-pressure confinement; e.g., Proga & Kallman 2004; Baskin et al. 2014; Ni et al. 2018; Liu et al. 2021) can absorb the X-ray photons from the hot corona. This leaves the UV emission from the accretion disk largely unaffected, thus resulting in significant X-ray weakness observed for type 1 QSOs.
Third, intrinsic variability can cause a QSO to be observed during periods of low X-ray flux state (e.g., Pu et al. 2020, and references therein), although luminous QSOs often do not show large variability amplitudes (e.g., Paolillo et al. 2017; Shemmer et al. 2017). For instance, Timlin et al. (2020a) found that QSOs with UV luminosity similar to that of PSO167–13 vary by a factor of < 3.
Finally, occultation events of broad emission-line clouds with angular sizes comparable to that of the hot corona can obscure the X-ray emission, although they are usually found to happen on shorter rest-frame timescales (a few hours) than those we probed for PSO167–13 (e.g., Risaliti et al. 2011; De Marco et al. 2020).
Assuming that the X-ray emission of PSO167–13 is absorbed by intervening neutral material with solar metallicity, and that the intrinsic X-ray luminosity is consistent with the αox − LUV relation (i.e., L2−10 keV = 5.1 × 1044 erg s−1), we used the self-consistent MYTorus model (Murphy & Yaqoob 2009) in XSPEC to estimate the equivalent hydrogen column density required to match the upper limits on flux reported in Sect. 3.2. We fixed the intrinsic power law slope to Γ = 2, the normalization of the scattered and line components to that of the transmitted component, and the inclination angle to 90 deg. We found that absorption due to Compton-thick (NH ≳ 1024 cm−2) material is required. However, the physical and geometrical assumptions of the MYTorus model might not be a good representation of the obscuring material in the inner regions of PSO167–13, which is expected to lie on smaller scales than the accretion disk, thus allowing for the detection of the UV emission. Using a simple absorbed power law model in XSPEC (model zwabs × powerlaw), which, however, does not include a treatment of photon scattering, the column densities required to match the observed fluxes in the soft and hard bands are NH ≳ 2 × 1024 cm−2 and NH ≳ 9 × 1024 cm−2, respectively. Constraining such high values of NH is possible thanks to the high-redshift nature of this QSO (which shifts the photoelectric cutoff to low observed energies, even for large column densities9), its relatively high UV luminosity (and, hence, expected X-ray luminosity), and the depth of the available Chandra observations. We conclude that the most plausible causes of the lack of strong X-ray emission from PSO167–13 are either intrinsic X-ray weakness, possibly due to an accretion mechanism different from that of typical QSOs, or small-scale absorption by Compton-thick material.
4.3. Possible nuclear winds in PSO167–13
Both the C IV and Mg II emission lines in the UV spectrum of PSO167–13 show large tentative blueshifts with respect to the [C II] systemic redshift (−4565 ± 859 km s−1 and −1268 ± 306 km s−1, respectively), although the derivation of accurate physical parameters for these lines is affected by the low S/N of the spectrum and, in particular for the C IV line, by the low atmospheric transmission. We also note that absorption features blueward of the C IV line may be present, similar to the blueshifted features in BAL QSOs. Rapidly accreting QSOs, WLQs (which are thought to be accreting close to the Eddington limit), and, in particular, high-redshift QSOs often exhibit similarly large or even larger C IV and Mg II blueshifts (e.g., Luo et al. 2015; Plotkin et al. 2015; Vietri et al. 2018, 2020; Venemans et al. 2016; Ni et al. 2018; Yi et al. 2019, and in prep.; Onoue et al. 2020; Schindler et al. 2020), which are usually considered to be produced by outflowing winds.
In this respect, the X-ray weakness of PSO167–13 (either intrinsic or due to small-scale obscuration) may play an important role in the acceleration mechanisms of such winds. In fact, X-ray weakness can help avoid the over-ionization of the accreting gas, thus allowing efficient launching of UV-line driven winds (e.g., Proga et al. 2000; Proga & Kallman 2004; Baskin et al. 2014). Therefore, it is perhaps not surprising that a relation has been found between αox and the blueshift of the C IV emission line (e.g., Richards et al. 2011; Timlin et al. 2020b; Vietri et al. 2020), in the sense that objects with larger C IV blueshifts have softer (i.e., UV-dominated) spectra. For instance, the PSO167–13 values of αox and C IV blueshift are consistent with the relations found by Timlin et al. (2020b) and Zappacosta et al. (2020), although for QSOs with ≈1 dex higher bolometric luminosities.
While the C IV emission line in QSOs is usually found to be blueshifted by ≈1000 km s−1 with respect to the Mg II line (e.g., Meyer et al. 2019), evidence has recently been found for an increasing Δv(C IV − Mg II) at z > 6 (Meyer et al. 2019; Schindler et al. 2020), with an average value of ≈ − 3000 km s−1 and up ≈ − 5000 km s−1 at z = 6.5. For PSO167–13, we found Δv(C IV − Mg II) = − 3300 km s−1, in agreement with the results from Schindler et al. (2020) at similar redshift, but for QSOs which are typically ≈1 dex more luminous in the UV. A higher signal-to-noise NIR spectrum is required to confirm the tentative nature of the rest-frame UV line properties of this PSO167–13.
5. Conclusions
We present deep X-ray (Chandra, 177 ks in total) and NIR spectroscopic (Magellan/FIRE, 7.2h on source) follow-up observations of PSO167–13, an optically selected z = 6.515 QSO (M1450 Å = − 25.6) in an interacting system with a close (0.9″, corresponding to ≈5 projected kpc) companion galaxy detected with both ALMA and the HST. A previous tentative detection of a hard X-ray source with Chandra (59.3 ks) suggested the presence of obscured nuclear accretion in this system. We summarize our main results as follows.
-
The new Chandra observations do not confirm significant X-ray emission from the QSO-galaxy system, suggesting that the previously detected X-ray source was due to a strong background fluctuation, although intrinsic variability by a factor of ≈4 cannot be excluded.
-
We calculate upper limits (at the 90% confidence level) on the X-ray flux of the companion galaxy – F < (1.9) × 10−16, F < (6.6)×10−16, and F < (5.0)×10−16 erg cm−2 s−1 in the soft, hard, and full bands, respectively – and the intrinsic 2–10 keV luminosity (LX < 1.3 × 1044 erg s−1). To date, none of the ALMA detected companion galaxies in the proximity of z > 6 QSOs have been detected with high significance (P > 0.99) in standard X-ray bands.
-
Likewise, we place upper limits on the X-ray flux from PSO167–13 of F < 1.2 × 10⁻¹⁶, F < 5.1 × 10⁻¹⁶, and F < 3.2 × 10⁻¹⁶ erg cm−2 s−1 in the soft, hard, and full bands, respectively, and on the intrinsic luminosity of L2−10 keV < 8.3 × 1043 erg s−1. These are the lowest upper limits on the X-ray emission for a z > 6 QSO.
-
The ratio between the X-ray and UV luminosity of PSO167–13, αox < −1.95, makes PSO167–13 an outlier from the αox − LUV relation for QSOs, with a deviation of Δαox < −0.30, corresponding to a factor of > 6 weaker X-ray emission than the expectation. Only ≈6% of SDSS radio-quiet non-BAL QSOs show similar X-ray weakness, and they are usually WLQs or red QSOs. Such weak X-ray emission for PSO167–13 could be intrinsic (e.g., due to an accretion configuration different from typical optically selected QSOs) or due to small-scale obscuration, which would allow the detection of the UV continuum. In the latter case, we estimate a column density of NH > 1024 cm−2.
-
The slope of the rest-frame UV spectrum of PSO167–13 taken in 2020 and presented here (α = −1.10 ± 0.12) is consistent with previous spectroscopy and redder than typical values for optically selected QSOs. Absorption features may be present blueward of the C IV line, but the low S/N of the spectrum prevents their definitive assessment.
-
The tentatively detected C IV and Mg II emission lines appear to be broad (FWHM = 9063 ± 2040 km s−1 and 3947 ± 758 km s−1, respectively) and strongly blueshifted from the systemic redshift based on the [C II] 158 μm line (Δv = −4565 km s−1 and −1268 km s−1, respectively). Similar large blueshifts have been found in other z > 6 QSOs, as well as in rapidly accreting QSOs and WLQs at lower redshifts, and are generally associated with the presence of nuclear winds. The C IV line is found to be blueshifted with respect to the Mg II line by Δv(C IV − Mg II) = − 3300 km s−1. This value is consistent with recent findings for z > 6 QSOs. However, we note that the spectroscopic observations were taken during nights with poor seeing and strongly varying atmospheric conditions. A higher signal-to-noise NIR spectrum is required to confirm the tentative nature of the rest-frame UV line properties of this PSO167–13.
-
As suggested by the relation between αox and C IV blueshift found by previous works, the unusual X-ray weakness of PSO167–13 might facilitate the acceleration of such winds by preventing the over-ionization of the accreting material, which is required by models of UV-driven wind acceleration. Based on the FWHM of the Mg II line, we estimate a virial black hole mass of 1.1 × 10⁹ M⊙, corresponding to λEdd = 0.3, but we caution that the presence of nuclear winds could severely affect this measurement.
Future observations of PSO167–13, for instance with JWST will provide a better description of its rest-frame UV properties, especially regarding the blueshift of the high-ionization emission lines.
The slightly lower upper limit on the net counts in the full band relative to the hard band is due to the higher background level.
Bolometric luminosities for z > 6 QSOs and for the Nanni et al. (2017) and Salvestrini et al. (2019) samples are estimated from M1450 Å using the bolometric correction from Venemans et al. (2016, see also Decarli et al. 2018), while values derived from spectral energy distribution fitting are plotted for the QSOs in the Lusso et al. (2012) and Martocchia et al. (2017) samples.
We used the DER_STEN algorithm from Stoehr et al. (2008), available at http://www.stecf.org/software/ASTROsoft/DER_SNR/
Errors on single-epoch black hole mass estimates are dominated by the systematic uncertainties of the calibration (> 0.5 dex; e.g., Shen 2013 and references therein).
The Chandra bandpass samples the rest-frame energy range 4–50 keV at z = 6.515.
Acknowledgments
We thank the referee, Belinda Wilkes, for her useful comments and suggestions. We thank Marcel Neeleman, Bram Venemans, Estelle Pons, and Weimin Yi for useful discussions, and Marianne Vestergaard for providing the iron UV emission template of Vestergaard & Wilkes (2001). We acknowledge support from CXC grants GO0-21078D (W. N. B.) and GO0-21078C (O. S.), from ANID grants CATA-Basal AFB-170002 (F. E. B., E. C.), FONDECYT Regular 1190818 (F. E. B.) and 1200495 (F. E. B.), Millennium Science Initiative ICN12_009 (F. E. B.), the NSFC grant 11991053 and National Key R&D Program of China grant 2016YFA0400702 (B. L.), from ASI-INAF n. 2018-31-HH.0 grant and PRIN-MIUR 2017 (S. G.), and from the agreement ASI-INAF n. 2017-14-H.O. The work of T. C. was carried out at the Jet Propulsion Laboratory, California Institute of Technology, under a contract with NASA. This research has made use of data obtained from the Chandra Data Archive (Proposal IDs 19700183 and 21700027), and software provided by the Chandra X-ray Center (CXC) in the application packages CIAO. This paper includes data gathered with the 6.5 meter Magellan Telescopes located at Las Campanas Observatory, Chile (CNTAC proposal ID CN2020A-22). This research made use of SAO Image DS9 Joye & Mandel (2003) and Astropy, (http://www.astropy.org) a community-developed core Python package for Astronomy (Astropy Collaboration 2013, 2018).
References
- Astropy Collaboration (Robitaille, T. P., et al.) 2013, A&A, 558, A33 [NASA ADS] [CrossRef] [EDP Sciences] [Google Scholar]
- Astropy Collaboration (Price-Whelan, A. M., et al.) 2018, AJ, 156, 123 [Google Scholar]
- Bañados, E., Venemans, B. P., Decarli, R., et al. 2016, ApJS, 227, 11 [NASA ADS] [CrossRef] [Google Scholar]
- Bañados, E., Venemans, B. P., Mazzucchelli, C., et al. 2018a, Nature, 553, 473 [NASA ADS] [CrossRef] [Google Scholar]
- Bañados, E., Connor, T., Stern, D., et al. 2018b, ApJ, 856, L25 [NASA ADS] [CrossRef] [Google Scholar]
- Baskin, A., Laor, A., & Stern, J. 2014, MNRAS, 445, 3025 [NASA ADS] [CrossRef] [Google Scholar]
- Belladitta, S., Moretti, A., Caccianiga, A., et al. 2020, A&A, 635, L7 [EDP Sciences] [Google Scholar]
- Brandt, W. N., & Alexander, D. M. 2015, A&ARv, 23, 1 [Google Scholar]
- Brightman, M., Silverman, J. D., Mainieri, V., et al. 2013, MNRAS, 433, 2485 [NASA ADS] [CrossRef] [Google Scholar]
- Broos, P. S., Feigelson, E. D., Townsley, L. K., et al. 2007, ApJS, 169, 353 [NASA ADS] [CrossRef] [Google Scholar]
- Chambers, K. C., Magnier, E. A., Metcalfe, N., et al. 2016, ArXiv e-prints [arXiv:1612.05560] [Google Scholar]
- Connor, T., Bañados, E., Stern, D., et al. 2019, ApJ, 887, 171 [Google Scholar]
- Connor, T., Bañados, E., Mazzucchelli, C., et al. 2020, ApJ, 900, 189 [Google Scholar]
- Davies, F. B., Hennawi, J. F., & Eilers, A.-C. 2019, ApJ, 884, L19 [Google Scholar]
- Decarli, R., Walter, F., Venemans, B. P., et al. 2017, Nature, 545, 457 [NASA ADS] [CrossRef] [Google Scholar]
- Decarli, R., Walter, F., Venemans, B. P., et al. 2018, ApJ, 854, 97 [NASA ADS] [CrossRef] [Google Scholar]
- Decarli, R., Dotti, M., Bañados, E., et al. 2019, ApJ, 880, 157 [NASA ADS] [CrossRef] [Google Scholar]
- De Marco, B., Adhikari, T. P., Ponti, G., et al. 2020, A&A, 634, A65 [CrossRef] [EDP Sciences] [Google Scholar]
- De Rosa, G., Venemans, B. P., Decarli, R., et al. 2014, ApJ, 790, 145 [NASA ADS] [CrossRef] [Google Scholar]
- Duras, F., Bongiorno, A., Ricci, F., et al. 2020, A&A, 636, A73 [CrossRef] [EDP Sciences] [Google Scholar]
- Eilers, A.-C., Hennawi, J. F., & Davies, F. B. 2018, ApJ, 867, 30 [CrossRef] [Google Scholar]
- Eilers, A.-C., Hennawi, J. F., Decarli, R., et al. 2020, ApJ, 900, 37 [Google Scholar]
- Fan, X., Strauss, M. A., Schneider, D. P., et al. 2003, AJ, 125, 1649 [NASA ADS] [CrossRef] [Google Scholar]
- Fan, X., Wang, F., Yang, J., et al. 2019, ApJ, 870, L11 [NASA ADS] [CrossRef] [Google Scholar]
- Farina, E. P., Arrigoni-Battaia, F., Costa, T., et al. 2019, ApJ, 887, 196 [NASA ADS] [CrossRef] [Google Scholar]
- Fitzpatrick, E. L. 1999, PASP, 111, 63 [NASA ADS] [CrossRef] [Google Scholar]
- Fruscione, A., McDowell, J. C., Allen, G. E., et al. 2006, in CIAO: Chandra’s Data Analysis System, SPIE Conf. Ser., 6270, 62701V [Google Scholar]
- Gagné, J., Lambrides, E., Faherty, J. K., & Simcoe, R. 2015, Firehose_V2: Firehose V2.0 [Google Scholar]
- Gaia Collaboration (Brown, A. G. A., et al.) 2018, A&A, 616, A1 [NASA ADS] [CrossRef] [EDP Sciences] [Google Scholar]
- Gallagher, S. C., Brandt, W. N., Chartas, G., et al. 2006, ApJ, 644, 709 [NASA ADS] [CrossRef] [Google Scholar]
- Gallerani, S., Zappacosta, L., Orofino, M. C., et al. 2017, MNRAS, 467, 3590 [NASA ADS] [CrossRef] [Google Scholar]
- Gibson, R. R., Jiang, L., Brandt, W. N., et al. 2009, ApJ, 692, 758 [NASA ADS] [CrossRef] [Google Scholar]
- Jiang, L., McGreer, I. D., Fan, X., et al. 2016, ApJ, 833, 222 [NASA ADS] [CrossRef] [Google Scholar]
- Joye, W. A., & Mandel, E. 2003, in Astronomical Data Analysis Software and Systems XII, eds. H. E. Payne, R. I. Jedrzejewski, & R. N. Hook, ASP Conf. Ser., 295, 489 [NASA ADS] [Google Scholar]
- Just, D. W., Brandt, W. N., Shemmer, O., et al. 2007, ApJ, 665, 1004 [Google Scholar]
- Kalberla, P. M. W., Burton, W. B., Hartmann, D., et al. 2005, A&A, 440, 775 [NASA ADS] [CrossRef] [EDP Sciences] [Google Scholar]
- Leighly, K. M., Halpern, J. P., Jenkins, E. B., et al. 2007, ApJ, 663, 103 [NASA ADS] [CrossRef] [Google Scholar]
- Liu, H., Luo, B., Brandt, W. N., Gallagher, S. C., & Garmire, G. P. 2018, ApJ, 859, 113 [NASA ADS] [CrossRef] [Google Scholar]
- Liu, H., Luo, B., Brandt, W. N., et al. 2021, ApJ, 910, 103 [Google Scholar]
- Luo, B., Brandt, W. N., Alexander, D. M., et al. 2013, ApJ, 772, 153 [NASA ADS] [CrossRef] [Google Scholar]
- Luo, B., Brandt, W. N., Alexander, D. M., et al. 2014, ApJ, 794, 70 [NASA ADS] [CrossRef] [Google Scholar]
- Luo, B., Brandt, W. N., Hall, P. B., et al. 2015, ApJ, 805, 122 [NASA ADS] [CrossRef] [Google Scholar]
- Lusso, E., & Risaliti, G. 2016, ApJ, 819, 154 [NASA ADS] [CrossRef] [Google Scholar]
- Lusso, E., Comastri, A., Simmons, B. D., et al. 2012, MNRAS, 425, 623 [Google Scholar]
- Martocchia, S., Piconcelli, E., Zappacosta, L., et al. 2017, A&A, 608, A51 [NASA ADS] [CrossRef] [EDP Sciences] [Google Scholar]
- Matsuoka, Y., Onoue, M., Kashikawa, N., et al. 2016, ApJ, 828, 26 [NASA ADS] [CrossRef] [Google Scholar]
- Matsuoka, Y., Onoue, M., Kashikawa, N., et al. 2018a, PASJ, 70, S35 [NASA ADS] [CrossRef] [Google Scholar]
- Matsuoka, Y., Strauss, M. A., Kashikawa, N., et al. 2018b, ApJ, 869, 150 [NASA ADS] [CrossRef] [Google Scholar]
- Matsuoka, Y., Onoue, M., Kashikawa, N., et al. 2019, ApJ, 872, L2 [NASA ADS] [CrossRef] [Google Scholar]
- Mazzucchelli, C., Bañados, E., Venemans, B. P., et al. 2017, ApJ, 849, 91 [NASA ADS] [CrossRef] [Google Scholar]
- Mazzucchelli, C., Decarli, R., Farina, E. P., et al. 2019, ApJ, 881, 163 [Google Scholar]
- Meyer, R. A., Bosman, S. E. I., & Ellis, R. S. 2019, MNRAS, 487, 3305 [NASA ADS] [CrossRef] [Google Scholar]
- Mignoli, M., Gilli, R., Decarli, R., et al. 2020, A&A, 642, L1 [EDP Sciences] [Google Scholar]
- Murphy, K. D., & Yaqoob, T. 2009, MNRAS, 397, 1549 [NASA ADS] [CrossRef] [Google Scholar]
- Nanni, R., Vignali, C., Gilli, R., Moretti, A., & Brandt, W. N. 2017, A&A, 603, A128 [NASA ADS] [CrossRef] [EDP Sciences] [Google Scholar]
- Nanni, R., Gilli, R., Vignali, C., et al. 2018, A&A, 614, A121 [NASA ADS] [CrossRef] [EDP Sciences] [Google Scholar]
- Neeleman, M., Bañados, E., Walter, F., et al. 2019, ApJ, 882, 10 [NASA ADS] [CrossRef] [Google Scholar]
- Ni, Q., Brandt, W. N., Luo, B., et al. 2018, MNRAS, 480, 5184 [NASA ADS] [Google Scholar]
- Onoue, M., Kashikawa, N., Matsuoka, Y., et al. 2019, ApJ, 880, 77 [Google Scholar]
- Onoue, M., Bañados, E., Mazzucchelli, C., et al. 2020, ApJ, 898, 105 [Google Scholar]
- Pacucci, F., Ferrara, A., Volonteri, M., & Dubus, G. 2015, MNRAS, 454, 3771 [NASA ADS] [CrossRef] [Google Scholar]
- Paolillo, M., Papadakis, I., Brandt, W. N., et al. 2017, MNRAS, 471, 4398 [NASA ADS] [CrossRef] [Google Scholar]
- Planck Collaboration XIII. 2016, A&A, 594, A13 [NASA ADS] [CrossRef] [EDP Sciences] [Google Scholar]
- Plotkin, R. M., Shemmer, O., Trakhtenbrot, B., et al. 2015, ApJ, 805, 123 [NASA ADS] [CrossRef] [Google Scholar]
- Pons, E., McMahon, R. G., Banerji, M., & Reed, S. L. 2020, MNRAS, 491, 3884 [Google Scholar]
- Pons, E., McMahon, R. G., Banerji, M., & Reed, S. L. 2021, MNRAS, 501, 6208 [Google Scholar]
- Proga, D., & Kallman, T. R. 2004, ApJ, 616, 688 [Google Scholar]
- Proga, D., Stone, J. M., & Kallman, T. R. 2000, ApJ, 543, 686 [NASA ADS] [CrossRef] [Google Scholar]
- Pu, X., Luo, B., Brandt, W. N., et al. 2020, ApJ, 900, 141 [CrossRef] [Google Scholar]
- Reed, S. L., Banerji, M., Becker, G. D., et al. 2019, MNRAS, 487, 1874 [Google Scholar]
- Richards, G. T., Kruczek, N. E., Gallagher, S. C., et al. 2011, AJ, 141, 167 [NASA ADS] [CrossRef] [Google Scholar]
- Risaliti, G., Nardini, E., Salvati, M., et al. 2011, MNRAS, 410, 1027 [NASA ADS] [CrossRef] [Google Scholar]
- Salvestrini, F., Risaliti, G., Bisogni, S., Lusso, E., & Vignali, C. 2019, A&A, 631, A120 [CrossRef] [EDP Sciences] [Google Scholar]
- Schindler, J.-T., Farina, E. P., Bañados, E., et al. 2020, ApJ, 905, 51 [Google Scholar]
- Schlafly, E. F., & Finkbeiner, D. P. 2011, ApJ, 737, 103 [NASA ADS] [CrossRef] [Google Scholar]
- Selsing, J., Fynbo, J. P. U., Christensen, L., & Krogager, J. K. 2016, A&A, 585, A87 [NASA ADS] [CrossRef] [EDP Sciences] [Google Scholar]
- Shemmer, O., Brandt, W. N., Vignali, C., et al. 2005, ApJ, 630, 729 [NASA ADS] [CrossRef] [Google Scholar]
- Shemmer, O., Brandt, W. N., Netzer, H., Maiolino, R., & Kaspi, S. 2006, ApJ, 646, L29 [NASA ADS] [CrossRef] [Google Scholar]
- Shemmer, O., Brandt, W. N., Netzer, H., Maiolino, R., & Kaspi, S. 2008, ApJ, 682, 81 [NASA ADS] [CrossRef] [Google Scholar]
- Shemmer, O., Brandt, W. N., Paolillo, M., et al. 2017, ApJ, 848, 46 [NASA ADS] [CrossRef] [Google Scholar]
- Shen, Y. 2013, Bull. Astron. Soc. India, 41, 61 [NASA ADS] [Google Scholar]
- Shen, Y., Richards, G. T., Strauss, M. A., et al. 2011, ApJS, 194, 45 [Google Scholar]
- Shen, Y., Wu, J., Jiang, L., et al. 2019, ApJ, 873, 35 [NASA ADS] [CrossRef] [Google Scholar]
- Simcoe, R. A., Burgasser, A. J., Bernstein, R. A., et al. 2008, in Ground-based and Airborne Instrumentation for Astronomy II, eds. I. S. McLean, M. M. Casali, et al., SPIE Conf. Ser., 7014, 70140U [Google Scholar]
- Spingola, C., Dallacasa, D., Belladitta, S., et al. 2020, A&A, 643, L12 [EDP Sciences] [Google Scholar]
- Steffen, A. T., Strateva, I., Brandt, W. N., et al. 2006, AJ, 131, 2826 [NASA ADS] [CrossRef] [Google Scholar]
- Stoehr, F., White, R., Smith, M., et al. 2008, in Astronomical Data Analysis Software and Systems XVII, eds. R. W. Argyle, P. S. Bunclark, J. R. Lewis, et al., ASP Conf. Ser., 394, 505 [Google Scholar]
- Timlin, J. D., Brandt, W. N., Ni, Q., et al. 2020a, MNRAS, 492, 719 [NASA ADS] [CrossRef] [Google Scholar]
- Timlin, J. D. I., Brandt, W. N., Zhu, S., et al. 2020b, MNRAS, 498, 4033 [Google Scholar]
- Valiante, R., Agarwal, B., Habouzit, M., & Pezzulli, E. 2017, PASA, 34 [CrossRef] [Google Scholar]
- Vanden Berk, D. E., Richards, G. T., Bauer, A., et al. 2001, AJ, 122, 549 [NASA ADS] [CrossRef] [Google Scholar]
- Venemans, B. P., Bañados, E., Decarli, R., et al. 2015, ApJ, 801, L11 [NASA ADS] [CrossRef] [Google Scholar]
- Venemans, B. P., Walter, F., Zschaechner, L., et al. 2016, ApJ, 816, 37 [NASA ADS] [CrossRef] [Google Scholar]
- Venemans, B. P., Walter, F., Neeleman, M., et al. 2020, ApJ, 904, 130 [Google Scholar]
- Vestergaard, M., & Osmer, P. S. 2009, ApJ, 699, 800 [Google Scholar]
- Vestergaard, M., & Wilkes, B. J. 2001, ApJS, 134, 1 [NASA ADS] [CrossRef] [Google Scholar]
- Vietri, G., Piconcelli, E., Bischetti, M., et al. 2018, A&A, 617, A81 [NASA ADS] [CrossRef] [EDP Sciences] [Google Scholar]
- Vietri, G., Mainieri, V., Kakkad, D., et al. 2020, A&A, 644, A175 [CrossRef] [EDP Sciences] [Google Scholar]
- Vito, F., Brandt, W. N., Luo, B., et al. 2018a, MNRAS, 479, 5335 [NASA ADS] [CrossRef] [Google Scholar]
- Vito, F., Brandt, W. N., Stern, D., et al. 2018b, MNRAS, 474, 4528 [NASA ADS] [CrossRef] [Google Scholar]
- Vito, F., Brandt, W. N., Bauer, F. E., et al. 2019a, A&A, 630, A118 [NASA ADS] [CrossRef] [EDP Sciences] [Google Scholar]
- Vito, F., Brandt, W. N., Bauer, F. E., et al. 2019b, A&A, 628, L6 [NASA ADS] [CrossRef] [EDP Sciences] [Google Scholar]
- Wang, F., Yang, J., Fan, X., et al. 2021a, ApJ, 907, L1 [Google Scholar]
- Wang, F., Fan, X., Yang, J., et al. 2021b, ApJ, 908, 53 [Google Scholar]
- Weisskopf, M. C., Wu, K., Trimble, V., et al. 2007, ApJ, 657, 1026 [NASA ADS] [CrossRef] [Google Scholar]
- Willott, C. J., Bergeron, J., & Omont, A. 2017, ApJ, 850, 108 [NASA ADS] [CrossRef] [Google Scholar]
- Woods, T. E., Agarwal, B., Bromm, V., et al. 2019, PASA, 36 [CrossRef] [Google Scholar]
- Wu, X.-B., Wang, F., Fan, X., et al. 2015, Nature, 518, 512 [NASA ADS] [CrossRef] [PubMed] [Google Scholar]
- Yang, J., Wang, F., Fan, X., et al. 2020, ApJ, 897, L14 [Google Scholar]
- Yi, W., Vivek, M., Brandt, W. N., et al. 2019, ApJ, 870, L25 [NASA ADS] [CrossRef] [Google Scholar]
- Zappacosta, L., Piconcelli, E., Giustini, M., et al. 2020, A&A, 635, L5 [NASA ADS] [CrossRef] [EDP Sciences] [Google Scholar]
All Tables
All Figures
|
Fig. 1. Chandra 5″ × 5″ images in the soft, hard, and full bands for the total 177 ks exposure. North is up, and east is left. The magenta contours show the [C II] emission detected with ALMA (0.33″ × 0.22″ beam size) of the PSO167–13 (main emission) and companion (fainter emission to the southeast) system from 4σ to 20σ in steps of 4σ (Venemans et al. 2020; see also Neeleman et al. 2019). The blue X symbols mark the optical position of PSO167–13 (Venemans et al. 2020). The black circles denote the 1″ extraction radius used throughout the text for PSO167–13. The green circle indicates the 1″ extraction radius used for the companion galaxy (shown only in the right panel for clarity). |
| In the text | |
|
Fig. 2. X-ray luminosity versus bolometric luminosity for z > 6 QSOs (cyan symbols) from Connor et al. (2019, 2020), Vito et al. (2019a), Pons et al. (2020), and Wang et al. (2021a), compared with z < 6 QSOs (gray symbols) from Lusso et al. (2012), Martocchia et al. (2017), Nanni et al. (2017), and Salvestrini et al. (2019) and the LX − Lbol relation (black dashed line) from Duras et al. (2020). Only radio-quiet QSOs are shown. Circles represent detected sources, and downward pointing triangles mark upper limits. PSO167–13 is shown in red. Diagonal dotted lines mark the loci of constant bolometric correction (i.e., Kbol = Lbol/LX). |
| In the text | |
|
Fig. 3. Values of αox plotted against UV luminosity for PSO167–13 (in red) and other z > 6 QSOs (cyan filled symbols) from Connor et al. (2019, 2020), Vito et al. (2019a), and Wang et al. (2021a) as well as the updated values of the Pons et al. (2020)z > 6.5 QSOs (Pons et al. 2021). We also show z < 6 QSOs (empty black symbols and the blue color map) from Shemmer et al. (2006), Steffen et al. (2006), Just et al. (2007), Lusso & Risaliti (2016), Nanni et al. (2017), and Salvestrini et al. (2019) and the best fitting relations from Just et al. (2007), Lusso & Risaliti (2016), and Martocchia et al. (2017). Circles represent detected sources, and downward pointing triangles mark upper limits. For visual purposes, we do not plot X-ray undetected sources included in the Lusso & Risaliti (2016) sample. |
| In the text | |
|
Fig. 4. Values of Δαox as a function of redshift for z > 4 QSOs. Symbols are the same as in Fig. 3. The upper limit on PSO167–13 suggests it is the most extreme X-ray weak quasar known to date beyond z > 4. |
| In the text | |
|
Fig. 5. Rest-frame UV spectrum of PSO167–13 obtained with our 2020 Magellan/FIRE observations (solid blue line), compared with the Venemans et al. (2015) spectrum (taken in 2014; solid red line). We have applied a median filter with a ≈ 20 Å kernel for visual purposes, as in Mazzucchelli et al. (2017). The average low-redshift QSO spectrum of Vanden Berk et al. (2001), normalized to the rest-frame 3000 Å flux of the Venemans et al. (2015) spectrum, is shown as a gray line. We also present the best fitting UV power law continuum of the 2020 spectrum as a dashed blue line, and the expected location of QSO emission lines at z = 6.515 as vertical dotted lines. We also show an example of atmospheric transmission during our FIRE observations (black line). Regions with transmission < 0.6 are marked with gray stripes. In particular, two spectral windows centered at rest frames ≈ 1800 Å and ≈ 2500 Å are completely affected by the very low atmospheric transmission and are thus masked in the spectra. |
| In the text | |
|
Fig. 6. Zoom-in of the spectral region of the 2020 (top panel) and 2014 (middle panel) spectra encompassing the C IV emission line of PSO167–13. Bottom panel: difference between the two epochs. The dashed black line in the top panel marks the best fitting continuum plus single Gaussian model of the C IV emission line. |
| In the text | |
|
Fig. 7. Zoom-in of the spectral region of the 2020 (top panel) and 2014 (middle panel) spectra encompassing the Mg II emission line of PSO167–13. Bottom panel: difference between the two epochs. The dashed black line in the top panel marks the best fitting continuum plus single Gaussian model of the Mg II emission line. |
| In the text | |
Current usage metrics show cumulative count of Article Views (full-text article views including HTML views, PDF and ePub downloads, according to the available data) and Abstracts Views on Vision4Press platform.
Data correspond to usage on the plateform after 2015. The current usage metrics is available 48-96 hours after online publication and is updated daily on week days.
Initial download of the metrics may take a while.