Fig. 5.
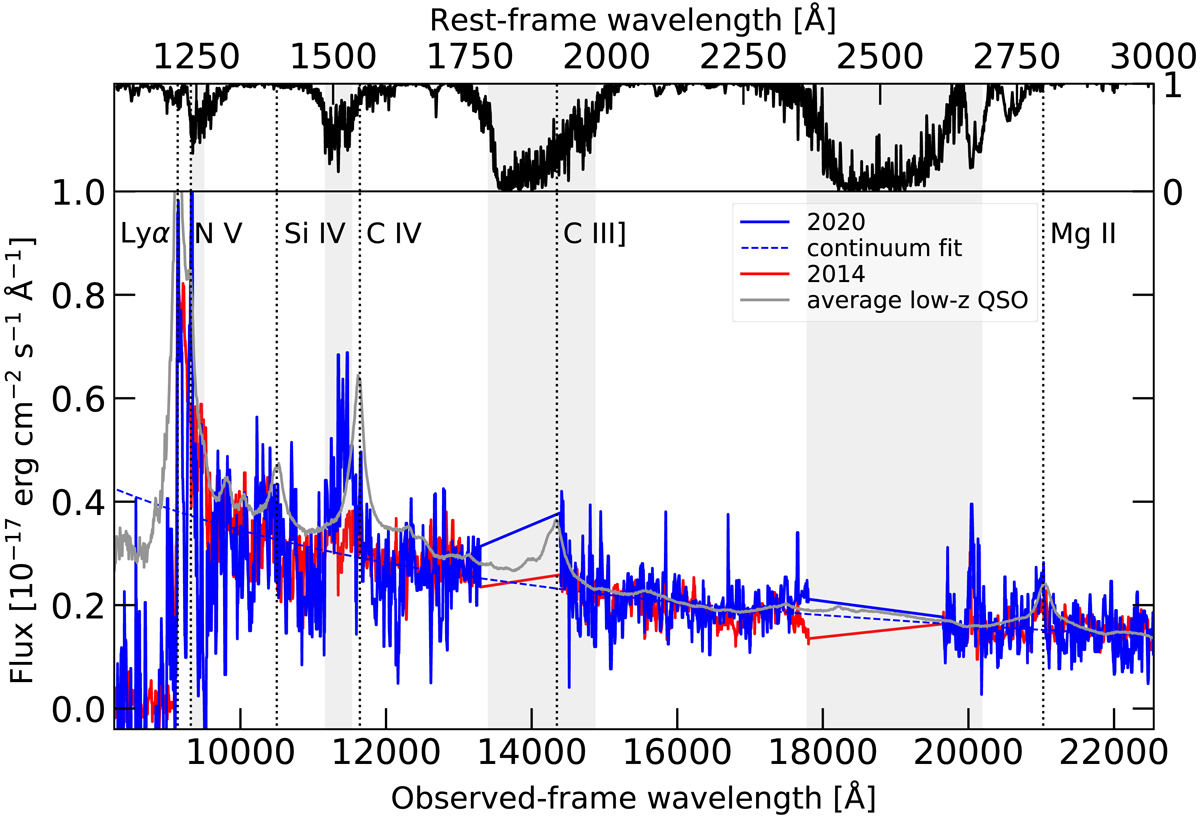
Rest-frame UV spectrum of PSO167–13 obtained with our 2020 Magellan/FIRE observations (solid blue line), compared with the Venemans et al. (2015) spectrum (taken in 2014; solid red line). We have applied a median filter with a ≈ 20 Å kernel for visual purposes, as in Mazzucchelli et al. (2017). The average low-redshift QSO spectrum of Vanden Berk et al. (2001), normalized to the rest-frame 3000 Å flux of the Venemans et al. (2015) spectrum, is shown as a gray line. We also present the best fitting UV power law continuum of the 2020 spectrum as a dashed blue line, and the expected location of QSO emission lines at z = 6.515 as vertical dotted lines. We also show an example of atmospheric transmission during our FIRE observations (black line). Regions with transmission < 0.6 are marked with gray stripes. In particular, two spectral windows centered at rest frames ≈ 1800 Å and ≈ 2500 Å are completely affected by the very low atmospheric transmission and are thus masked in the spectra.
Current usage metrics show cumulative count of Article Views (full-text article views including HTML views, PDF and ePub downloads, according to the available data) and Abstracts Views on Vision4Press platform.
Data correspond to usage on the plateform after 2015. The current usage metrics is available 48-96 hours after online publication and is updated daily on week days.
Initial download of the metrics may take a while.