Fig. 3.
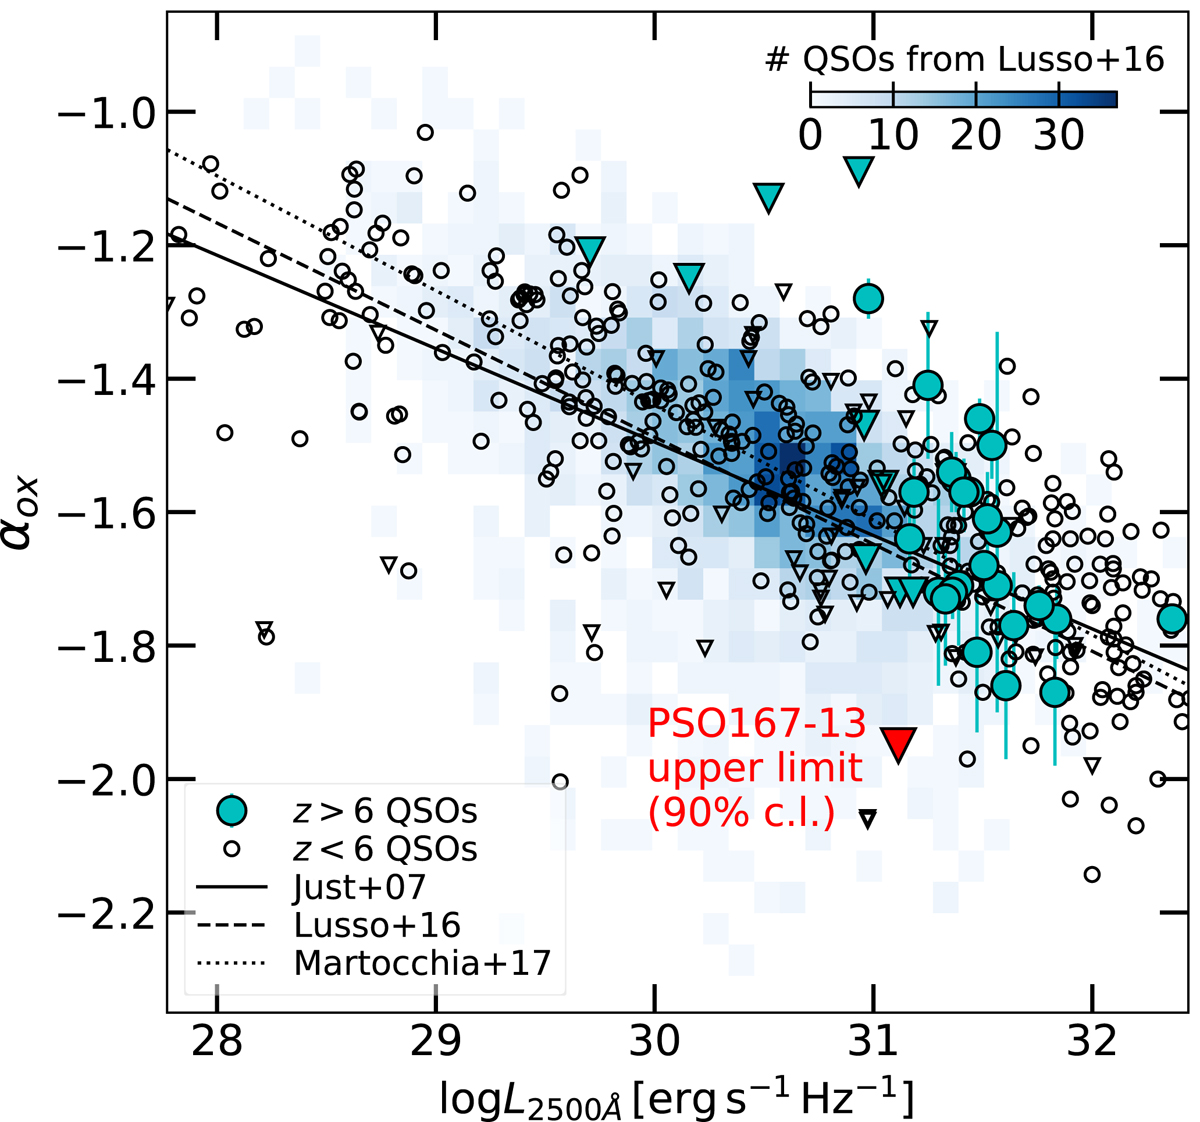
Values of αox plotted against UV luminosity for PSO167–13 (in red) and other z > 6 QSOs (cyan filled symbols) from Connor et al. (2019, 2020), Vito et al. (2019a), and Wang et al. (2021a) as well as the updated values of the Pons et al. (2020)z > 6.5 QSOs (Pons et al. 2021). We also show z < 6 QSOs (empty black symbols and the blue color map) from Shemmer et al. (2006), Steffen et al. (2006), Just et al. (2007), Lusso & Risaliti (2016), Nanni et al. (2017), and Salvestrini et al. (2019) and the best fitting relations from Just et al. (2007), Lusso & Risaliti (2016), and Martocchia et al. (2017). Circles represent detected sources, and downward pointing triangles mark upper limits. For visual purposes, we do not plot X-ray undetected sources included in the Lusso & Risaliti (2016) sample.
Current usage metrics show cumulative count of Article Views (full-text article views including HTML views, PDF and ePub downloads, according to the available data) and Abstracts Views on Vision4Press platform.
Data correspond to usage on the plateform after 2015. The current usage metrics is available 48-96 hours after online publication and is updated daily on week days.
Initial download of the metrics may take a while.