Fig. 2.
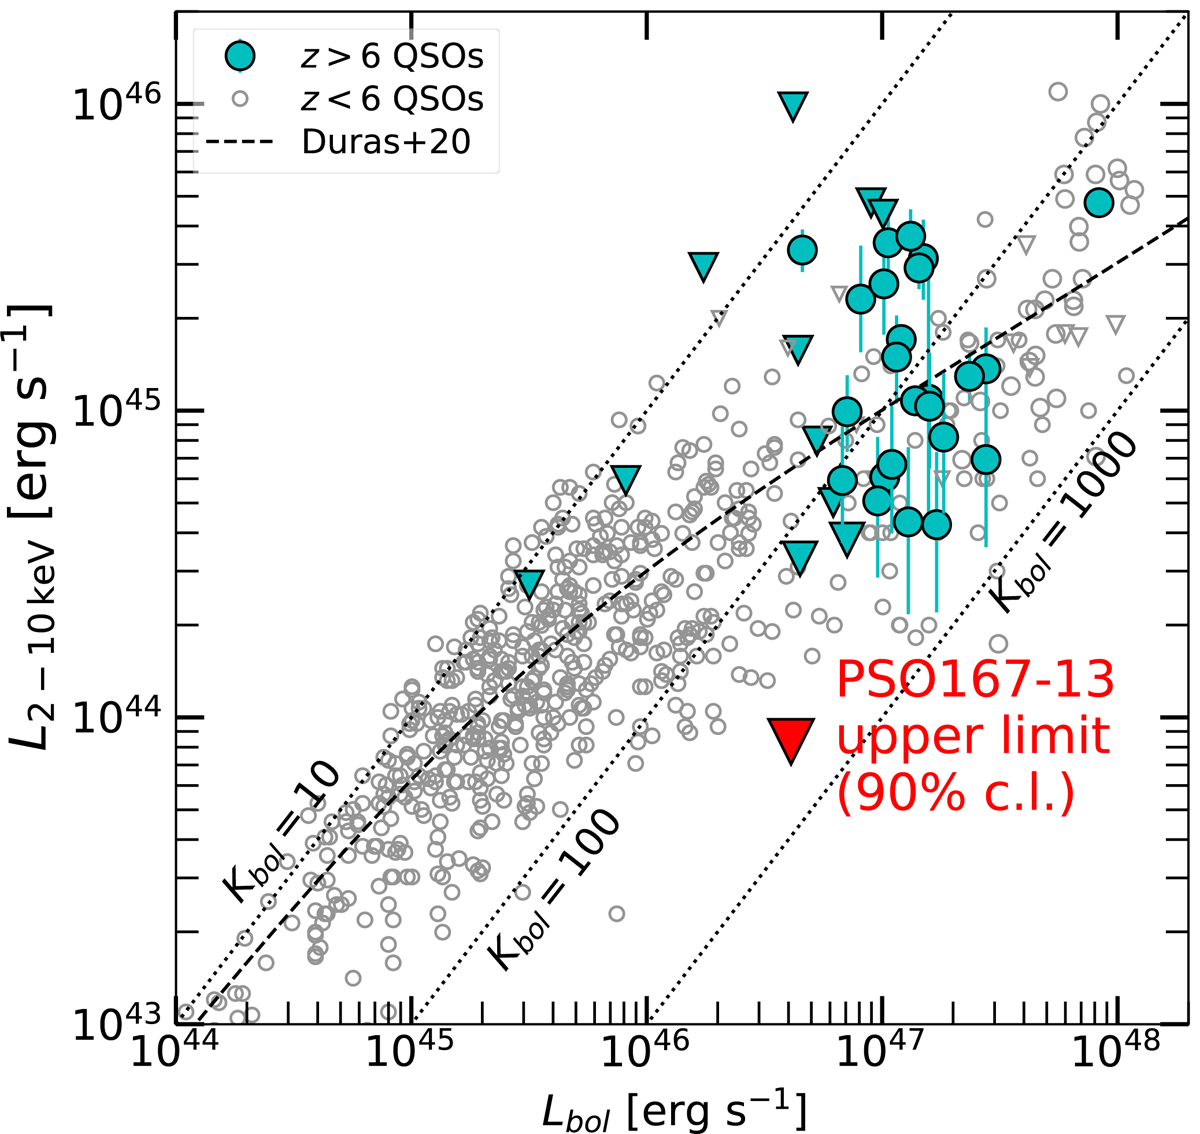
X-ray luminosity versus bolometric luminosity for z > 6 QSOs (cyan symbols) from Connor et al. (2019, 2020), Vito et al. (2019a), Pons et al. (2020), and Wang et al. (2021a), compared with z < 6 QSOs (gray symbols) from Lusso et al. (2012), Martocchia et al. (2017), Nanni et al. (2017), and Salvestrini et al. (2019) and the LX − Lbol relation (black dashed line) from Duras et al. (2020). Only radio-quiet QSOs are shown. Circles represent detected sources, and downward pointing triangles mark upper limits. PSO167–13 is shown in red. Diagonal dotted lines mark the loci of constant bolometric correction (i.e., Kbol = Lbol/LX).
Current usage metrics show cumulative count of Article Views (full-text article views including HTML views, PDF and ePub downloads, according to the available data) and Abstracts Views on Vision4Press platform.
Data correspond to usage on the plateform after 2015. The current usage metrics is available 48-96 hours after online publication and is updated daily on week days.
Initial download of the metrics may take a while.