Free Access
Fig. 7.
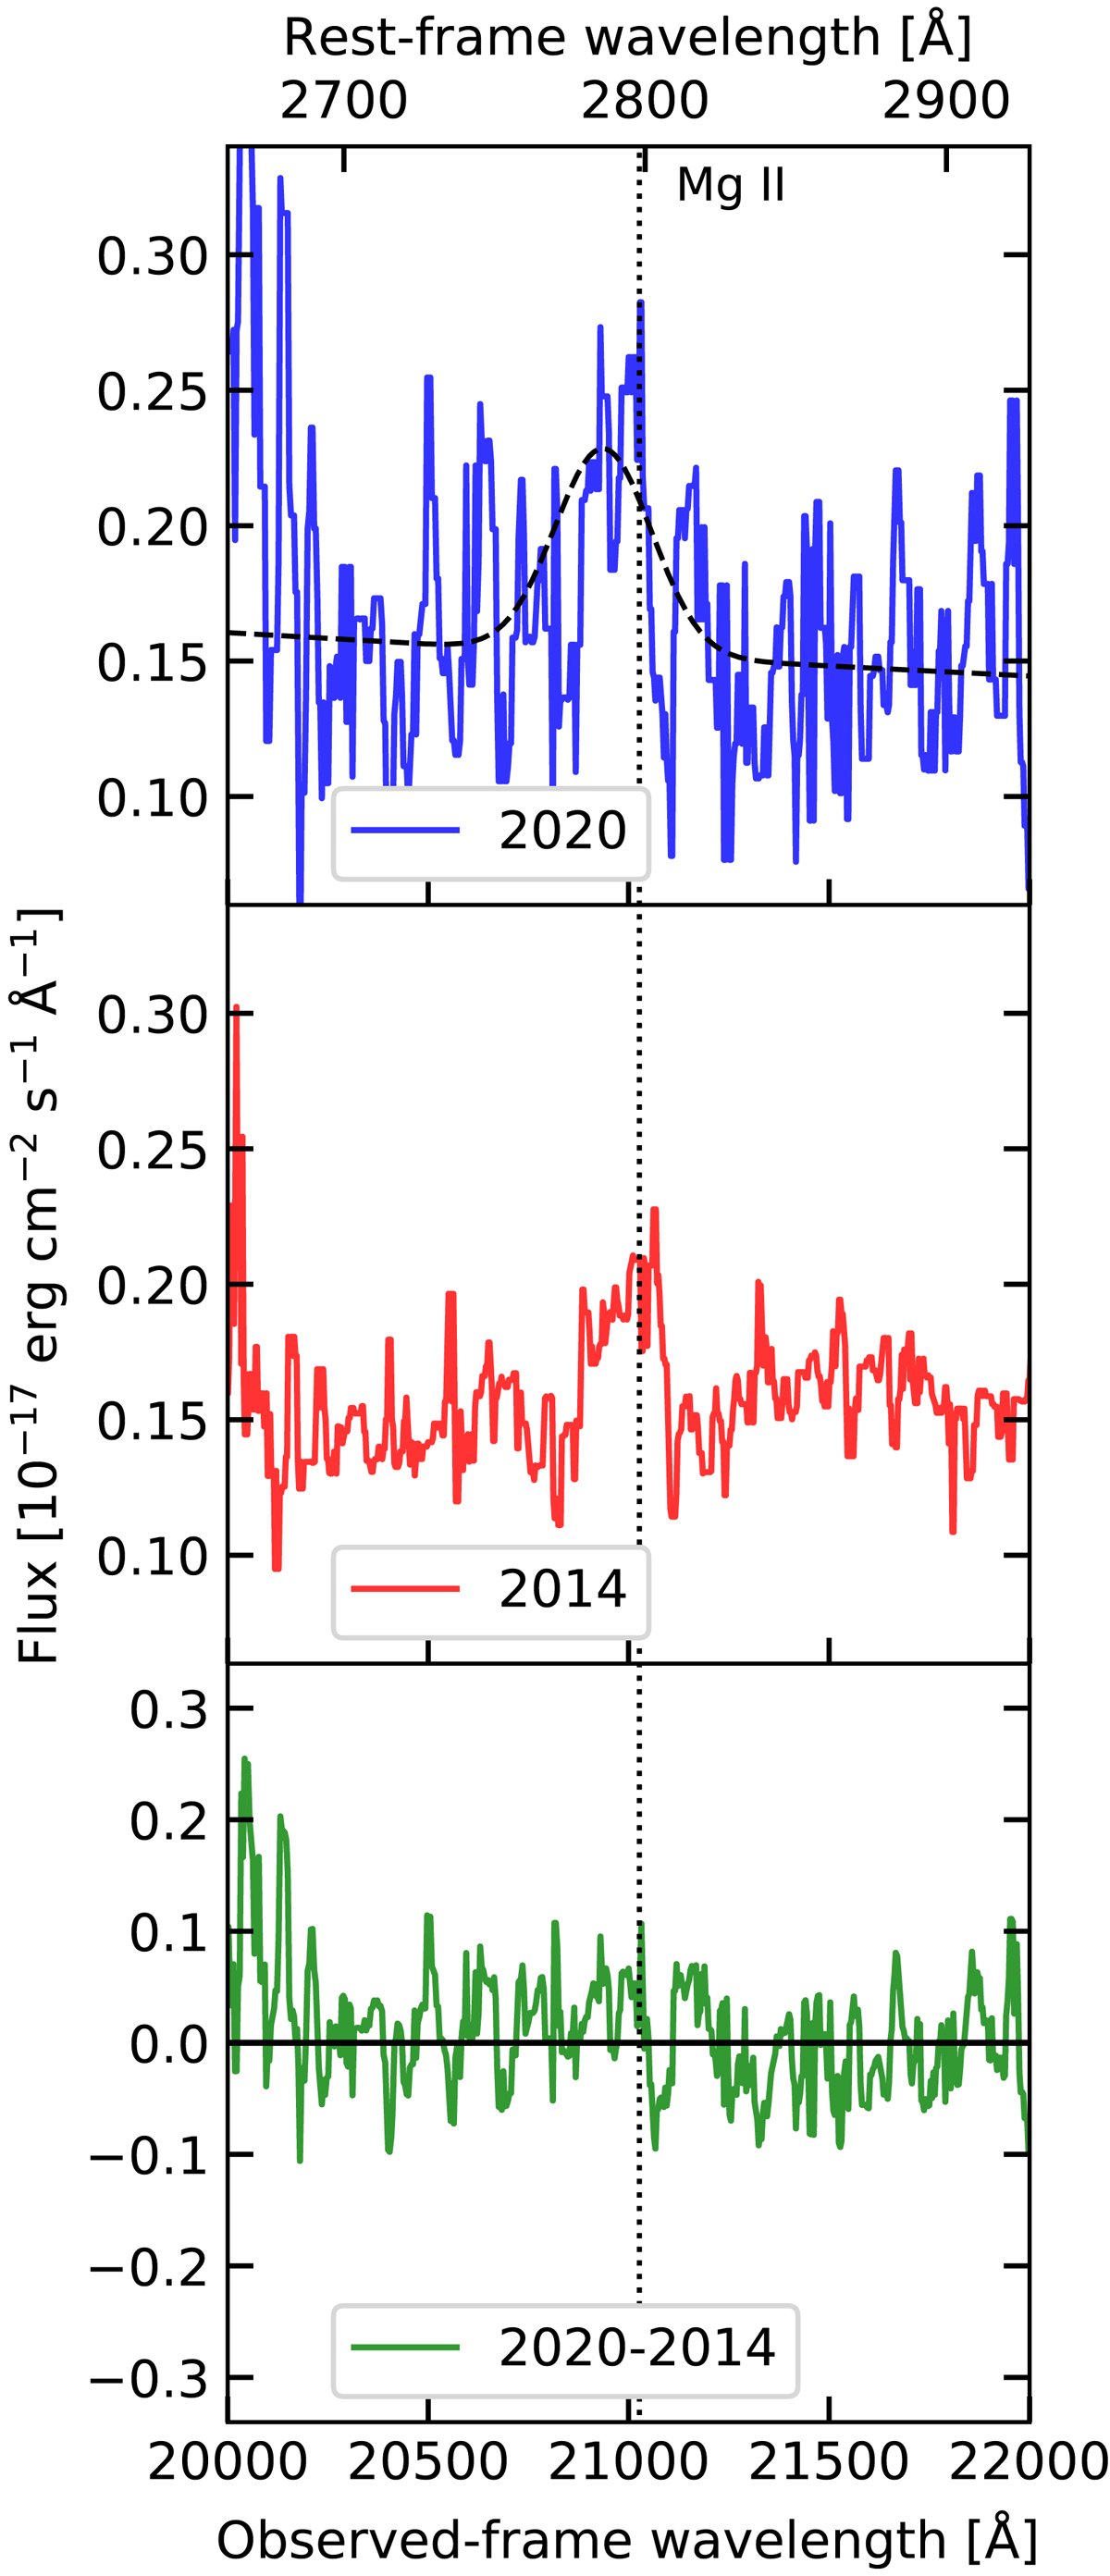
Zoom-in of the spectral region of the 2020 (top panel) and 2014 (middle panel) spectra encompassing the Mg II emission line of PSO167–13. Bottom panel: difference between the two epochs. The dashed black line in the top panel marks the best fitting continuum plus single Gaussian model of the Mg II emission line.
Current usage metrics show cumulative count of Article Views (full-text article views including HTML views, PDF and ePub downloads, according to the available data) and Abstracts Views on Vision4Press platform.
Data correspond to usage on the plateform after 2015. The current usage metrics is available 48-96 hours after online publication and is updated daily on week days.
Initial download of the metrics may take a while.