| Issue |
A&A
Volume 649, May 2021
|
|
|---|---|---|
| Article Number | A47 | |
| Number of page(s) | 18 | |
| Section | Cosmology (including clusters of galaxies) | |
| DOI | https://doi.org/10.1051/0004-6361/202140293 | |
| Published online | 10 May 2021 | |
Impact of the calibration of the halo mass function on galaxy cluster number count cosmology
1
IRFU, CEA, Université Paris-Saclay, 91191 Gif-sur-Yvette, France
e-mail: emmanuel.artis@lpsc.in2p3.fr
2
Université de Paris, CNRS, Astroparticule et Cosmologie, 75006 Paris, France
3
Jet Propulsion Laboratory, California Institute of Technology, Pasadena, California, USA
Received:
6
January
2021
Accepted:
1
March
2021
The halo mass function (HMF) is a critical element in cosmological analyses of galaxy cluster catalogs. We quantify the impact of uncertainties in HMF parameters on cosmological constraints from cluster catalogs similar to those from Planck, those expected from the Euclid, Roman, and Rubin surveys, and from a hypothetical larger future survey. We analyze simulated catalogs in each case, gradually loosening priors on HMF parameters to evaluate the degradation in cosmological constraints. While current uncertainties on HMF parameters do not substantially impact Planck-like surveys, we find that they can significantly degrade the cosmological constraints for a Euclid-like survey. Consequently, the current precision on the HMF is not sufficient for Euclid, Roman, Rubin or possible larger surveys. Future experiments will have to properly account for uncertainties in HMF parameters, and it will be necessary to improve the precision of HMF fits to avoid weakening constraints on cosmological parameters.
Key words: galaxies: clusters: general / large-scale structure of Universe / cosmological parameters
© E. Artis et al. 2021
 Open Access article, published by EDP Sciences, under the terms of the Creative Commons Attribution License (https://creativecommons.org/licenses/by/4.0), which permits unrestricted use, distribution, and reproduction in any medium, provided the original work is properly cited.
1. Introduction
Galaxy clusters are unique tools for astrophysical and cosmological studies, ranging from galaxy formation to fundamental physics (Voit 2005; Allen et al. 2011; Kravtsov & Borgani 2012). In particular, it is now well established that their number density n(M, z) is a powerful cosmological probe, notably of the matter density, Ωm, the root mean square density fluctuation, σ8, the dark energy equation-of-state, and the sum of the neutrino masses (Weinberg et al. 2013). For this reason, cluster number counts figure among the four primary dark energy probes.
Surveys across different wavebands have used cluster number counts to derive cosmological constraints (e.g., Vikhlinin et al. 2009; Mantz et al. 2010; Rozo et al. 2010; Hasselfield et al. 2013; Planck Collaboration XXIV 2016; Bocquet et al. 2019; Costanzi et al. 2019, 2021). These analyses are based on the halo mass function (HMF) originating in the Press & Schechter (1974) formalism. The HMF provides the key link between cosmological parameters and the number density of clusters; it essentially bundles the complicated non-linear physics of halo formation into a simple analytical formula involving only the linear power spectrum and other linear-theory quantities. This is essential because it avoids running costly N-body simulations at each point in parameter space when establishing cosmological constraints.
Current cluster count analyses use catalogs of hundreds (in millimeter and X-ray data) to thousands (in optical data) of clusters, and they are not limited by our knowledge of the HMF. However, uncertainties on the HMF could become important as future catalogs grow by factors of 10–100. Euclid will detect tens of thousands of clusters (Sartoris et al. 2016) as will eROSITA (Hofmann et al. 2017), Simons Observatory (Ade et al. 2019), Rubin (Ivezić et al. 2019), and CMB-S4 (Abazajian et al. 2019). In the longer term, Roman (Gehrels et al. 2015), PICO (Hanany et al. 2019), and a Voyage 2050 Backlight mission (Basu et al. 2021) could detect from hundreds of thousands to one million clusters.
As statistical errors on cluster counts dramatically drop, effects that are now considered as second order will begin to noticeably contribute to the uncertainty budget of cosmological analyses (Fumagalli et al. 2021). In this paper, we examine the potential importance of uncertainties related to modeling errors in the HMF. Popular HMF formulas such as Tinker et al. (2008) predict cluster counts in the Λ-cold dark matter (ΛCDM) parameterization to a precision of several percent (∼5–10%) (compared to full N-body simulations). The recent Despali et al. (2015) HMF provides an expression with parameters and associated errors fitted on ΛCDM N-body simulations. Figure 1 presents the relative difference of the Tinker and Despali mass functions at z = 1 as a function of the virial mass. The Tinker mass function is parameterized for different overdensity definitions (Δ = 200, 300, 400, 600, …), while Despali uses the virial overdensity Δvir(z). To compare the two mass functions in Fig. 1, we extrapolated the value of the parameters of the Tinker mass function for ΔTinker ≡ Δvir(z = 1). The difference is below 5% for masses less than a few 1014 M⊙, so within the quoted error bars for the Tinker mass function. The red band delineates the uncertainty from the HMF parameters provided by Despali et al. (2015). They are much smaller than the difference between the two mass functions, bringing to light the difference between the precision of a given HMF formula and its potential bias (a question of accuracy). The origin of this difference is beyond the scope of our study.
 |
Fig. 1. Relative difference of the Tinker et al. (2008) and the Despali et al. (2015) mass functions at z = 1 for a ΛCDM cosmology. To get a robust comparison between the two mass functions, we extrapolated the values of the parameters of the Tinker mass function (A, a, b, c) for Δvir(z = 1), which is the overdensity used for the Despali mass function. In red, we show the convex envelope of all the scenarios covered by the error bars provided by Despali et al. (2015). The mass is defined with respect to the virial radius. |
Instead, we consider the Despali mass function and its given uncertainty, shown by the red band, to be representative of our knowledge of the mass function. This is clearly optimistic faced with the importance of the difference between the Tinker and other mass functions. Nevertheless, we will see that even in the absence of any bias, these uncertainties may have to be accounted for in future cosmological analyses of large galaxy cluster surveys.
Different approaches can be chosen to model the uncertainties related to the HMF (e.g., Costanzi et al. 2019). We investigate them by allowing the parameters of the HMF to vary according to priors set by its fit to simulations, such as provided by Despali et al. By modifying the size of these priors, we forecast the level of precision required to avoid significant degradation of cosmological parameter estimation. We require that the HMF parameters be known to sufficient precision so that the precision on cosmological parameters is degraded by less than 5%, and the precision on the Figure-of-Merit (FoM, the inverse of the area of the confidence ellipse) is degraded by less than 10%.
We emphasize that this approach assumes that the fitted HMF yields unbiased cosmological constraints. The uncertainties on the HMF parameters depend primarily on the number of halos in the simulation used to fit (or “calibrate”) the HMF, a number that potentially far exceeds the number of clusters in the universe. But we see from the example of Fig. 1 that the difference between the HMF forms from Tinker et al. (2008) and Despali et al. (2015) largely exceeds the statistical uncertainties shown by the red band. The statistical uncertainties do not account for the accuracy, or potential bias, of the HMF fitting formula. However, we consider only the statistical uncertainties in the present study, returning briefly to the issue of bias in Sect. 5.
The article is organized as follows. In Sect. 2, we give a brief overview of the mass function, describe our likelihood, explain how we compute our Fisher matrices, and finally list the cosmological models and cluster catalogs that we examine. We present results in Sect. 3 for each cosmological model, and then summarize in Sect. 4 before a concluding discussion in Sect. 5.
2. Methods
2.1. Mass function and cluster likelihood
The mass function formalism was originally introduced by Press and Schechter (Press & Schechter 1974). It predicts the comoving number density of halos, n(M, z), for a given set of cosmological parameters as
where  is the mean density of the universe today, f(σ) is the multiplicity function (discussed hereafter) and
with Plin(k, z) the linear power spectrum at redshift z, ![$ R(M)=[M/(4\pi \bar{\rho}/3)]^{1/3} $](/articles/aa/full_html/2021/05/aa40293-21/aa40293-21-eq4.gif) and W(kR)=[3/(kR)2][sin(kR)/(kR)−cos(kR)] is the spherical top-hat window function. Although the classical Press and Schechter approach provides a good approximation under the assumption of a simple Gaussian process for f(σ), numerous recent studies (based on numerical simulations or solving theoretical issues) have devised more accurate parametrizations of the multiplicity function (e.g., Bond et al. 1991; Lacey & Cole 1994; Sheth & Tormen 1999; Jenkins et al. 2001; Crocce et al. 2010; Corasaniti & Achitouv 2011; Despali et al. 2015).
and W(kR)=[3/(kR)2][sin(kR)/(kR)−cos(kR)] is the spherical top-hat window function. Although the classical Press and Schechter approach provides a good approximation under the assumption of a simple Gaussian process for f(σ), numerous recent studies (based on numerical simulations or solving theoretical issues) have devised more accurate parametrizations of the multiplicity function (e.g., Bond et al. 1991; Lacey & Cole 1994; Sheth & Tormen 1999; Jenkins et al. 2001; Crocce et al. 2010; Corasaniti & Achitouv 2011; Despali et al. 2015).
Relying on the Le SBARBINE simulations, the main interest of the Despali mass function (DMF), compared with other widely used HMF like Tinker (Tinker et al. 2008), is the claim of universality, that is to say the parameters used to describe the multiplicity function f(σ) do not explictly depend on either the redshift of the clusters or the cosmology. This is important because it means that when performing a cosmological analysis, the universal shape can be used at any redshift and in any cosmological scenario. This universality, however, requires use of Mvir, the cluster mass defined with respect to the virial overdensity Δc (e.g., Lahav et al. 1991).
The shape of the function is the following, originally from Sheth & Tormen (1999):
where ν′ = aν. The parameter ν is related to the root mean square density fluctuation via
where δc(z) is the critical linear theory overdensity, which can be approximated by Kitayama & Suto (1996)
where log refers to logarithm in base 10.
We are then left with three parameters (a, p, A0) describing the high-mass cutoff, the shape at lower masses, and the normalization of the curve, respectively. Once again, if the virial overdensity is used, no change in these parameters is expected with respect to either redshift or cosmology.
We compute the expected number density of objects per unit of mass, redshift, and area on the sky Ω as
where ∂z, ΩV is the comoving volume per unit redshift and solid angle at the considered redshift. The quality of the cosmological parameter estimation with cluster number counts primarily depends on the number of clusters in the survey. Since we focus on the effect of the HMF parameterization, we do not consider any observable-mass relation in this work. We also assume that we can directly measure cluster mass and that the selection function can be modeled by a simple mass threshold Mthres. We present the survey cases studied (defined by Mthres, Ω, redshift range [zmin, zmax]) in Sect. 2.3.
 |
Fig. 2. 68 and 95% confidence contours on the parameters a and A0, from the best-fit Gaussian to the MCMC chains provided by Despali et al. (2015). The black dots delineate the original 68% contour from the MCMC chains. |
For each survey-type, we estimate the cosmological parameters
and simultaneously constrain the Despali HMF parameters,
We only consider shot noise, so cosmic variance is neglected. Instead of using the Cash (1979) statistics in bins of mass and redshift, we compute the unbinned Poisson likelihood of the two dimensional point process:
where the sum runs over individual clusters in the catalog and Nclusters is the total number of clusters.
2.2. Fisher matrix
The aim of our Fisher analysis is to quantify the precision on the HMF parameters, Ξ, required to limit the impact of their uncertainty on the cosmological constraints. Using the Markov chain Monte Carlo (MCMC) provided by Despali et al. (2015), we fit a 2-D Gaussian on the HMF parameter distribution, for each pair of parameters. We show an example in Fig. 2 for the parameters a and A0. This enables us to reconstruct the full covariance matrix CHMF for the HMF parameters, which we provide in Table 1.
Covariance matrix, CHMF, reconstructed for parameters (a, p, A0), all dimensionless.
From the likelihood described in the previous section, one can compute the associated Fisher matrix for the clusters:
where pi ∈ Θ ∪ Ξ and the angle brackets indicate the average over the data ensemble corresponding to the fiducial parameter values. The covariance matrix of the parameters pi is the inverse of the Fisher matrix.
We build the total Fisher information matrix as the sum of three components:
– The information obtained from cluster number counts, Fclusters, given in Eq. (8),
– The cosmological priors from Planck cosmic microwave background measurements, Fcmb (Planck Collaboration VI 2020),
– The HMF priors, FHMF.
The full Fisher matrix is then given by
where Fcmb (resp. FHMF) is non zero only in the Θ (resp. Ξ) quadrant. The non zero quadrant of FHMF is the inverse of CHMF.
In this work, we examine the impact of FHMF on cosmological parameter determination. In order to do so, we introduce the parameter α, and we modify the priors on the HMF in Eq. (9) as follows:
The covariance matrix being the inverse of the Fisher information, increasing α degrades the constraints on the HMF. On the other hand, α → 0 describes the situation where the HMF parameters are perfectly known. For p ∈ Ξ, this yields
where σp is the error on one parameter of the HMF. Figure 3 illustrates how two values of α impact the confidence ellipses for the HMF parameters.
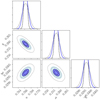 |
Fig. 3. 68 and 95% percent contours on the parameters a, p and A0. The blue ellipses are obtained when α = 1, i.e., the current precision provided by Despali et al. (2015). The black dashed curves are obtained for α = 0.3, and the dotted curves for α = 2. |
Finally, we obtain
Here, the last term comes from the fact that the cosmological parameters are degenerate with the HMF for cluster cosmology. To get Fclusters, we need to set a value for α (here α = 1) and remove it afterwards. In the following sections, we change the value of α to measure its impact on σp for any p ∈ Θ, the set of the cosmological parameters, and to identify the value necessary to avoid degrading the cosmological parameter constraints by more than 5%, and the total FoM by more than 10%.
2.3. Cosmological models and mock catalogs
We generate catalogs for three different cosmological scenarios. Each model assumes a flat cosmology:
– A base ΛCDM cosmology (5 cosmological parameters1, Ωm, σ8, H0, Ωb, ns);
– A w0waCDM cosmology, where we assume a dynamical dark energy model (7 parameters, the parameters from the base flat ΛCDM and w0, wa describing the dark energy equation-of-state (Chevallier & Polarski 2001): w(a)=w0 + wa(1 − a), where a is the expansion scale factor normalized to unity at z = 0);
– A νCDM cosmology, in which we consider the physics of massive neutrinos. In this case, the parameters are the same as the ones presented in the base ΛCDM, but we need our computation of the power spectrum, as described in Sect. 3.3 (6 parameters, the parameters from the base flat ΛCDM and ∑mν).
The expected cluster counts associated with these models are computed with the python package HMF from Murray et al. (2013), which we have modified for the two latter cosmological scenarios in a way described below. The values adopted for the cosmological parameters for each scenario can be found in Table 2. They are the mean values of the chains provided by Planck Collaboration VI (2020): PklimHM-TT-TE-EE-lowL-lowE-lensing chains in the ΛCDM and νCDM cases and PklimHMTT-TE-EE-lowL-lowE-BA0-Riess18-Panthe for w0wa. For the case of the νCDM scenario, we adopt the lower limit provided by Abe et al. (2008), ∑mν = 0.06 eV, because the best fit value provided by Planck is lower.
Fiducial cosmological parameters adopted to generate the mock catalogs in the three cosmological scenarios.
The current lack of a precise understanding of the selection function of future optical surveys leads us to consider simple mass and redshift thresholds for the completeness of the catalog:
The total expected number of objects in the catalog is then
We set the mass threshold so that Ntot is close to the number of clusters expected with a survey similar to Euclid, that is to say ∼60 000 clusters over 15 000 deg2 (Sartoris et al. 2016). For the DMF, this mass threshold is log(Mthres/M⊙) = 14.18. We then reduced and increased the area of the survey to obtain Ntot of ∼500 and ∼1.5 × 10⁵ clusters (Planck-like and Future projects).
We generate five cluster catalogs. The first three (CEuclid, CPlanck, CFuture) fix the sum of the neutrino masses to its minimal value of ∑mν = 0.06 and are used for analyses in the ΛCDM and w0waCDM scenarios. Since constraining the masses of the neutrinos requires a special treatment for the power spectrum (see Sect. 3.3 for details), we generate two additional catalogs for the νCDM scenario corresponding to Euclid-like and Future surveys. Since we are interested in forecasting the precision on the measurement of the neutrino mass scale, we do not generate a Planck-like catalog for the νCDM scenario. The mocks are obtained from a Poisson draw of the DMF. The characteristics of each catalog are given in Table 3.
Characteristics of the mock catalogs.
3. Results
We provide here the results for the three cosmological scenarios (ΛCDM, w0waCDM, νCDM) and the three catalogs (Planck-like, Euclid-like and Future) whose characteristics are given in the previous section. For each scenario and each catalog, we run the same analysis, and we give the precision required on the halo mass function.
Parameters which are poorly constrainted with cluster counts such as Ωb, ns, H0 make the computation of the coefficients of the cluster Fisher matrix Fclusters difficult. Indeed, since the log-likelihood function is almost constant, we are more subject to numerical instabilities when we compute the second order derivatives. However, our analysis requires that we are able to capture sufficiently the correlations between the different parameters. We thus decided to run first an MCMC analysis and fit a Gaussian on the contours as we did for the HMF parameters in Sect. 2.2. The Fisher matrix is then deduced as the inverse of the covariance matrix. The MCMC analysis is performed with the emcee python package from Foreman-Mackey et al. (2013). Large flat priors are applied for the cosmological parameters of interest. They are summarized in Table 4. Convergence is checked with the integrated autocorrelation time, as suggested by Goodman & Weare (2010).
Priors applied on the flat ΛCDM cosmology.
3.1. ΛCDM cosmology
We present the results for the clusters-only case,  , in Sect. 3.1.1 and the clusters + Planck CMB-case,
  , in Sect. 3.1.2.
3.1.1. Cosmological constrains from clusters only
Since galaxy cluster number counts are particularly sensitive to Ωm, and σ8, we naturally focus on these parameters for our analysis. In Fig. 4, we show the cosmological constraints for the Euclid-like catalog with α = 1, as well as our Gaussian approximation. As expected, Ωb is poorly constrained as the clusters primarily probe the total matter content of the universe.
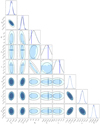 |
Fig. 4. In light blue, MCMC 68% and 95% contours for the cosmological parameters and the halo mass function parameters for a Euclid-like catalog. We fixed α = 1. The dark blue contours are obtained when adding Planck priors. The dashed lines are the Gaussian fit from which the covariance matrix and subsequently the Fisher matrix Fclusters(α = 1) is computed. |
We now vary the parameter α encapsulating the uncertainty on the HMF parameters to see if we reach the required precision on the cosmological parameters. Recall that we require 5% precision on individual cosmological parameters (here, Ωm and σ8), and 10% precision on the total FoM (here, in the (Ωm,σ8)-plane).
Figure 5 shows that the precision on the parameter Ωm is not strongly affected by the variation of the parameters of the mass function. This is expected since Fig. 4 shows that this parameters is poorly correlated with the HMF parameters.
 |
Fig. 5. Relative variation of the error on the matter density parameter ϵ(Ωm) for the three different sizes of catalogs. For all catalogs, the value of α required to avoid degrading the constraint by more than 5% is much greater than 1. The current knowledge of the mass function (α = 1) is sufficient. This is the result for clusters only; the results for clusters plus Planck 2018 priors are summarized in Table 5. |
On the other hand, σ8 is correlated with a, p and A0. Figure 6 shows that, for this parameter and a Future cluster catalog, we need better constraints (20% improvement) on the halo mass function parameters than those currently available.
 |
Fig. 6. Relative variation of the error on σ8 for the three catalogs. The level of precision on the HMF reaches the limit of current knowledge (α → 1) for a Euclid-like catalog (Blue). For the largest catalog (Green), the constraints on the HMF need to be 20% better. This is the result for clusters only; the results for clusters plus Planck 2018 priors are summarized in Table 5. |
The last issue concerns the FoM. Figure 7 demonstrates that, for clusters only, for a catalog of the size of Euclid and for a Future catalog, the current precision is sufficient to match our objective of 10%.
 |
Fig. 7. Relative variation of the FoM (inverse of the area within the error ellipse in the two-dimensional parameter space) in the Ωm − σ8 plane. For the two large catalogs, α is close to the limit value 1. This is the result for clusters only; the results for clusters plus Planck 2018 priors are summarized in Table 5. |
3.1.2. Cosmological constrains from clusters with Planck 2018 priors
Since clusters only poorly constrain Ωb, H0 and ns, we combine them with external constraints. The most natural complementary probe is the Planck primary CMB (Planck Collaboration VI 2020). Consequently, we include priors from Planck as Fcmb (see Sect. 2.2) in our total Fisher matrix, and we run our analysis a second time. The priors are the same as in the previous section (see Table 4). For clarity, we do not add figures similar to those presented in the previous section, but instead summarize our results in Table 5. Corner plots for cosmological and HMF parameters are given in Appendix A.
Maximum value allowed for the α parameter in flat ΛCDM.
For Ωm the impact is more important because the constraints are tighter, but the current level of precision on the HMF is nevertheless good enough to avoid degrading the constraints beyond our threshold of 5%. However, this time σ8 and the FoM are strongly affected, and improvements in HFM precision are needed to avoid degrading these constraints. All the results are provided in Table 5. We highlighted in red when the precision on the HMF needs to be improved. The precision on the HMF parameters needs to be improved for Euclid-like and Future catalogs (up to ∼70% for the FoM for Future catalogs) if one wants to fully exploit their cosmological potential.
3.2. w0waCDM
The most common way of modeling the accelerated expansion of the universe is to consider a fluid with negative pressure, which is characterized by its equation-of-state p = wρ. A cosmological constant corresponds to w = −1 and ρ = cst. Even though the cosmological constant is consistent with current observations, many different dark energy models predict a dynamical equation-of-state. One of the most popular parametrizations was proposed by Chevallier & Polarski (2001) and Linder (2003),
which, as a two parameter expansion, adds a layer of complexity.
In this model, the HMF parameters have a different effect. First, leaving w0 and wa free increases the size of the confidence contours. In addition, the shape of the 68 and 95% regions changes (see Figs. B.2 and B.3). Corner plots for cosmological and HMF parameters are provided in Appendix B.
For these reasons, the impact of the HMF parameters is smaller than in the ΛCDM case. For all three catalogs, we never reached a loss of relative precision comparable to the ΛCDM case, not only for Ωm and σ8, but also for the dark energy equation-of-state parameters w0 and wa. This should not obscure the fact that these results are highly dependant on the HMF uncertainties. Moreover, future experiments (CMB, BAO, etc) will constrain cosmology better than the Planck priors used here. These two aspects are discussed further in Sect. 5.
3.3. νCDM
For our final study we vary the sum of the neutrino masses. The presence of massive neutrinos induces a scale dependence of the growth factor, and slightly changes the model. Following Costanzi et al. (2013), we model the power spectrum as
and we also change the collapse threshold (Hagstotz et al. 2019)
With this formalism, we forecast cosmological constraints from the two mock catalogs generated to study varying neutrino mass, as described in Sect. 2.3. As we have already noted, the HMF uncertainty is not significant compared to the statistical uncertainties for a Planck-like catalog.
For the primary CMB prior Fcmb, we take the Planck chains PklimHM + TT + TE + EE + lowL + lowE + lensing + BAO with neutrino mass as a free parameter. Since the best fit value for the total neutrino mass provided by these chains is lower than the minimal value required by neutrino oscillation experiments (Abe et al. 2008), we center the Planck Fisher contours on the fiducial value of 0.06 eV, the minimal mass value.
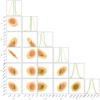 |
Fig. 8. Cosmological parameters obtained for a catalog of 151 427 objects (Future). In orange, the Planck (2018) contours, and in green, the clusters combined with Planck priors. We expect, for the largest catalog, a 2σ measurement of the neutrino mass scale. The full corner plot with all parameters is given in Appendix C. |
Figure 8 shows the results for the largest catalog. We expect to achieve a 2σ measurement of the neutrino mass scale. Full corner plots for both cosmological and HMF parameters are provided in Appendix C. We see that clusters significantly improve the constraints on neutrino mass when added to the current Planck priors, in particular by constraining the lower mass range. And if neutrinos are slightly more massive than the minimal value, the confidence limits would improve: The green contour in the Σmν − σ8 plane would move to higher values, but since the CMB would still constrain the upper value of the neutrino mass, we would obtain notably tighter constrains. In this sense, the plot is pessimistic. Moreover, the result shown here marginalizes over the Planck uncertainty on the optical depth to reionization, which can be expected to improve in the coming years and hence yield even tighter constraints on neutrino mass.
 |
Fig. 9. Evolution of the uncertainty in the Ωm − ∑mν plane. In blue, the Euclid-like case, and in green a larger Future catalog. |
We perform the same analysis as the previous section, focusing only on the Clusters+Planck2018 case. Results are summarized in Table 6. We observe the same effect as for the w0waCDM scenario: since we allow the chains to explore a larger area of parameter space, it appears that the impact of our knowledge of the HMF is less important than in the case of ΛCDM. For a Euclid-like catalog, the current precision on the HMF parameter is sufficient, but not for the case of a Future catalog, which will require improvements by ∼40% in order to not degrade the constraint on σ8 by more than 5%, as illustrated in Fig. 9.
Maximum value allowed for α in a νCDM cosmology.
We must emphasize, however, that the best fit values of the HMF parameters (a, p, A0) (and associated uncertainties) are provided for a ΛCDM scenario. We have assumed these to be valid in the νCDM case, although we could reasonably expect the errors to be larger for a νCDM cosmology. We return to this point in the discussion.
4. Summary of results
Our study focuses on cluster counts as a cosmological probe. The wider and deeper surveys of the future will demand every increasing attention to systematics. As the primary theoretical link between cosmological quantities and the observed counts, the HMF is the mainstay of every past and future analysis. The most important aspects of the HMF in this context are:
-
Universality, or the concept that the HMF functional parameters are not explicitly dependant on redshift nor cosmology.
-
Accuracy, the ability to recover unbiased cosmological parameters.
-
Precision in the fit of the HMF functional parameters when fit on numerical simulations.
State-of-the-art simulations are improving our understanding of the first two aspects (Despali et al. 2015). In this paper, we focus on the last point, estimating the required precision on a given set of parameters in order to avoid degrading cosmological constraints. We discuss the first two aspects in Sect. 5.
For our purposes, we set a threshold of 5% for allowed degradation in the precision for any single cosmological parameter, and 10% for the FoM. We find that, for the ΛCDM scenario, and for a Euclid-like catalog when Planck priors are applied, one of the principal parameter of interest, σ8, as well as the FoM are violate this threshold with the present precision: the precision on the HMF parameters must be improved by ∼30% (Table 5). For a Future catalog, the situation is more critical: an improvement of ∼70% is required to avoid degrading the FoM on (Ωm, σ8) by more than 10%.
For w0waCDM, any degradation in the dark energy equation-of-state parameters remains under a percent. This is simply because allowing these parameters to vary increases the size of the confidence ellipses, thereby reducing the impact of the HMF parameters. A look at the corner plots in Appendix B shows that there is in fact little correlation between (w0, wa) and (a, p, A0) in this case.
Lastly, we examined constraints on the sum of neutrino masses. Once again for a future catalog, the current precision on HMF parameters does not meet our threshold requirement, and one needs to improve the constraints on the HMF parameters by ∼30% (Table 6). For a Euclid-like catalog, the current precision appears to be sufficient.
5. Discussion and conclusion
The HMF is the foundation of cosmology with cluster counts. It promises to provide a robust, simple, analytical form for the abundance of dark matter halos across cosmological models as a function of linear-theory quantities only. Universality is the key desired property: a functional form whose parameters do not explicitly depend on the cosmological scenario. Cosmological dependence only enters through the linear-theory power spectrum and growth factor. In this way, a universal HMF enables exploration of cosmological parameter space without the need for expensive numerical simulations at every step. In most analyses to date, the HMF parameters are fitted on a set of numerical simulations, and then fixed in the cosmological analysis, for example Planck Collaboration XXIV (2016).
Cluster catalogs will vastly increase in size with planned experiments, such as eROSITA (now operating), Simons Observatory, CMB-S4, Euclid, Roman and Rubin. As statistical power increases, we must quantify both the accuracy and the precision of the HMF fitting form, and evaluate their impact on cosmological constraints. The former tells us to what extent the best-fit HMF functional form reproduces the halo abundance in simulations; the latter refers to the precision of the HMF parameters around their best-fit values. This has not been an issue at the times when cluster catalogs were containing only a few hundreds objects. With Euclid, we expect 105 clusters, so these errors can no longer be ignored (Costanzi et al. 2019).
Our study provides a framework to estimate the impact of the precision of HMF parameters on cosmological parameter estimation. We do this by freeing the parameters of the HMF, applying priors from the fit and quantifying the impact on the cosmological inference. We found that improvements of up to 70% in the precision of HMF parameters is required to prevent degrading cosmological constraints by more than our threshold of 5% on a single parameter and 10% on the FoM.
Our results are reliable only for the mass function from Despali et al. (2015). The results could change for other HMFs depending on the correlations between HMF parameters and cosmological quantities. Thus, our main result is that a simlar discussion should be made when presenting error bars extracted from simulations. It will not be possible in future analyses to simply fix the best-fit parameters of the HMF when running a cosmological analysis. One will have to adjust at the same time cosmology, and halo mass function parameters, with priors from simulation for these latter.
In this work, we have chosen not to include a fiducial scatter or bias on the mass estimates. Cluster masses are not directly measured, but inferred through proxies originating from various physical effects, and we thus expect at least a dispersion on the recovered masses. The probability distribution function of the proxies given the true masses (at a given redshift and a given cosmology) will be one of the keys required to measure cosmological parameters with cluster counts together with the selection function.
However, since the HMF is usually fitted directly on N-body simulations, we can decorrelate the study of the probability distribution function of the mass estimates, and the impact of the HMF, assuming that the masses are perfectly measured. Consequently, our results should be understood as the primary requirement that one should have: if one is considering an ideal HMF with no scatter on the masses, we do not want to degrade the cosmological parameters. The underlying problem is the impact of the systematics for a realistic study. In Artis et al. (in prep), we show that in the presence of a realistic scatter designed for Euclid, as well as a realistic selection function, the HMF errors still represent about 10% of the total error budget. This is the same order of magnitude as the errors generated by the statistical uncertainty due to the number of clusters in the final catalog. In other words, when the full analysis is considered, the HMF remains a major concern.
No perfect functional form exists for the HMF, and in fact Fig. 1 shows that the error bar can not provide an overlap between two of the most widely used HMFs. This is the issue of accuracy. It is therefore essential to also verify that the adopted HMF provides unbiased cosmological constraints (see Salvati et al. 2020). Differences in HMFs can arise from numerous sources, including the effect of baryons (Castro et al. 2021), which will be a major issue in the upcoming years.
A related issue is whether different cosmological scenarios provide different uncertainties on HMF parameters (apart from the best-fit values). Indeed, the HMF formalism is based on the idea of universality, that is the claim that the HMF parameterization does not depend on the cosmology. Despali et al. (2015) demonstrated that this is nearly the case over a broad range of cosmological scenarios. But this only means that the best-fit is the same for the HMF parameters in different scenarios. Nothing is said about the uncertainties. There is no reason why the errors should not be affected when the cosmology changes, and this should be taken into account.
To solve this issue, one path could be to develop extensive simulated datasets for a broad range of cosmological scenarios. For each cosmological case in the parameter space (including massive neutrinos and the dark energy equation of state parameters), one would have to fit the HMF and recover the associated error bars. A final step would be to deduce the total size of the HMF parameters’ errors, as obtained when we marginalize on the cosmological parameters. This leads to an alternative idea: instead of trying to find a functional form for the HMF, one could build an emulator directly for the simulations. Recently, Bocquet et al. (2020) obtained interesting results with a precision competitive with classical fitting functions. In any case, the errors have to be included when one marginalizes on the cosmological parameters. The volume of the parameter space covered by the cosmological parameters should at least encapsulate the results of state of the art cosmological analyses like Planck Collaboration VI (2020) and Riess et al. (2019).
To summarize, we have to be sure that, in a given mass and redshift interval, the error bars provided encapsulate all the uncertainties related to simulation and halo finder (see Knebe et al. 2011 for a review).
In the near future, we will have discovered almost all dark matter halos hosting massive clusters of galaxies. But as statistics increases, effort must be made to not only provide a good description of what is seen in the simulations, but also to provide a framework capable of yielding unbiased cosmological constraints. We have focused on this latter point, in the special case of halo mass function parameters. Our conclusion is that it is important to construct a likelihood where the following are adjusted simultaneously:
-
Cosmology (Ωm, σ8, w0, wa, ∑mν,...),
-
Selection function with priors from detection algorithm (see e.g., Euclid Collaboration 2019),
-
Halo mass function with priors from simulation,
-
Observable/mass relation with priors from simulation (see e.g., Bellagamba et al. 2019),
-
Large scale bias of dark matter halos b(M, z) with priors from simulation (see e.g., Tinker et al. 2010).
This goal requires both theoretical and numerical improvements and must be reached by next-generation cluster surveys.
Acknowledgments
A portion of the research described in this paper was carried out at the Jet Propulsion Laboratory, California Institute of Technology, under a contract with the National Aeronautics and Space Administration.
References
- Abazajian, K., Addison, G., Adshead, P., et al. 2019, CMB-S4 Science Case, Reference Design, and Project Plan [Google Scholar]
- Abe, S., Ebihara, T., Enomoto, S., et al. 2008, Phys. Rev. Lett., 100, 221803 [Google Scholar]
- Ade, P., Aguirre, J., Ahmed, Z., et al. 2019, JCAP, 2019, 056 [CrossRef] [Google Scholar]
- Allen, S. W., Evrard, A. E., & Mantz, A. B. 2011, ARA&A, 49, 409 [NASA ADS] [CrossRef] [Google Scholar]
- Basu, K., Remazeilles, M., Melin, J.-B., et al. 2021, Exp. Astron., in press, [arXiv:1909.01592] [Google Scholar]
- Bellagamba, F., Sereno, M., Roncarelli, M., et al. 2019, MNRAS, 484, 1598 [NASA ADS] [CrossRef] [Google Scholar]
- Bocquet, S., Dietrich, J. P., Schrabback, T., et al. 2019, ApJ, 878, 55 [NASA ADS] [CrossRef] [Google Scholar]
- Bocquet, S., Heitmann, K., Habib, S., et al. 2020, ApJ, 901, 5 [CrossRef] [Google Scholar]
- Bond, J. R., Cole, S., Efstathiou, G., & Kaiser, N. 1991, ApJ, 379, 440 [NASA ADS] [CrossRef] [Google Scholar]
- Cash, W. 1979, ApJ, 228, 939 [NASA ADS] [CrossRef] [Google Scholar]
- Castro, T., Borgani, S., Dolag, K., et al. 2021, MNRAS, 500, 2316 [Google Scholar]
- Chevallier, M., & Polarski, D. 2001, Int. J. Mod. Phys. D, 10, 213 [NASA ADS] [CrossRef] [Google Scholar]
- Corasaniti, P. S., & Achitouv, I. 2011, Phys. Rev. D, 84, 023009 [Google Scholar]
- Costanzi, M., Villaescusa-Navarro, F., Viel, M., et al. 2013, JCAP, 2013, 012 [CrossRef] [Google Scholar]
- Costanzi, M., Collaboration, D., Rozo, E., et al. 2019, MNRAS, 488, 4779 [NASA ADS] [CrossRef] [Google Scholar]
- Costanzi, M., Saro, A., Bocquet, S., et al. 2021, Phys. Rev. D, 103, 043522 [CrossRef] [Google Scholar]
- Crocce, M., Fosalba, P., Castander, F. J., & Gaztañaga, E. 2010, MNRAS, 403, 1353 [Google Scholar]
- Despali, G., Giocoli, C., Angulo, R. E., et al. 2015, MNRAS, 456, 2486 [Google Scholar]
- Euclid Collaboration (Adam, R., et al.) 2019, A&A, 627, A23 [CrossRef] [EDP Sciences] [Google Scholar]
- Foreman-Mackey, D., Hogg, D. W., Lang, D., & Goodman, J. 2013, PASP, 125, 306 [Google Scholar]
- Fumagalli, A., Saro, A., Borgani, S., et al. 2021, A&A, submitted [arXiv:2102.08914] [Google Scholar]
- Gehrels, N., & Spergel, D., WFIRST SDT Project 2015, in Journal of Physics Conference Series, J. Phys. Conf. Ser., 610, 012007 [Google Scholar]
- Goodman, J., & Weare, J. 2010. Commun. Appl. Math. Comput. Sci., 5, 65 [Google Scholar]
- Hagstotz, S., Costanzi, M., Baldi, M., & Weller, J. 2019, MNRAS, 486, 3927 [CrossRef] [Google Scholar]
- Hanany, S., Alvarez, M., Artis, E., et al. 2019, Bull. Am. Astron. Soc., 51, 194 [Google Scholar]
- Hasselfield, M., Hilton, M., Marriage, T. A., et al. 2013, JCAP, 2013, 008 [Google Scholar]
- Hofmann, F., Sanders, J. S., Clerc, N., et al. 2017, A&A, 606, A118 [NASA ADS] [CrossRef] [EDP Sciences] [Google Scholar]
- Ivezić, Ž., Kahn, S. M., Tyson, J. A., et al. 2019, ApJ, 873, 111 [NASA ADS] [CrossRef] [Google Scholar]
- Jenkins, A., Frenk, C. S., White, S. D. M., et al. 2001, MNRAS, 321, 372 [NASA ADS] [CrossRef] [MathSciNet] [Google Scholar]
- Kitayama, T., & Suto, Y. 1996, MNRAS, 280, 638 [NASA ADS] [Google Scholar]
- Knebe, A., Knollmann, S. R., Muldrew, S. I., et al. 2011, MNRAS, 415, 2293 [NASA ADS] [CrossRef] [Google Scholar]
- Kravtsov, A. V., & Borgani, S. 2012, ARA&A, 50, 353 [NASA ADS] [CrossRef] [Google Scholar]
- Lacey, C., & Cole, S. 1994, MNRAS, 271, 676 [Google Scholar]
- Lahav, O., Lilje, P. B., Primack, J. R., & Rees, M. J. 1991, MNRAS, 251, 128 [Google Scholar]
- Linder, E. V. 2003, Phys. Rev. Lett., 90, 091301 [Google Scholar]
- Mantz, A., Allen, S. W., Rapetti, D., & Ebeling, H. 2010, MNRAS, 406, 1759 [NASA ADS] [Google Scholar]
- Murray, S., Power, C., & Robotham, A. 2013, HMFcalc: An Online Tool for Calculating Dark Matter Halo Mass Functions [Google Scholar]
- Planck Collaboration XXIV. 2016, A&A, 594, A24 [NASA ADS] [CrossRef] [EDP Sciences] [Google Scholar]
- Planck Collaboration VI. 2020, A&A, 641, A6 [NASA ADS] [CrossRef] [EDP Sciences] [Google Scholar]
- Press, W. H., & Schechter, P. 1974, ApJ, 187, 425 [NASA ADS] [CrossRef] [Google Scholar]
- Riess, A. G., Casertano, S., Yuan, W., Macri, L. M., & Scolnic, D. 2019, ApJ, 876, 85 [Google Scholar]
- Rozo, E., Wechsler, R. H., Rykoff, E. S., et al. 2010, ApJ, 708, 645 [NASA ADS] [CrossRef] [Google Scholar]
- Salvati, L., Douspis, M., & Aghanim, N. 2020, A&A, 643, A20 [CrossRef] [EDP Sciences] [Google Scholar]
- Sartoris, B., Biviano, A., Fedeli, C., et al. 2016, MNRAS, 459, 1764 [Google Scholar]
- Sheth, R. K., & Tormen, G. 1999, MNRAS, 308, 119 [NASA ADS] [CrossRef] [Google Scholar]
- Tinker, J., Kravtsov, A. V., Klypin, A., et al. 2008, ApJ, 688, 709 [NASA ADS] [CrossRef] [Google Scholar]
- Tinker, J. L., Robertson, B. E., Kravtsov, A. V., et al. 2010, ApJ, 724, 878 [Google Scholar]
- Vikhlinin, A., Kravtsov, A. V., Burenin, R. A., et al. 2009, ApJ, 692, 1060 [NASA ADS] [CrossRef] [Google Scholar]
- Voit, G. M. 2005, Rev. Mod. Phys., 77, 207 [NASA ADS] [CrossRef] [Google Scholar]
- Weinberg, D. H., Mortonson, M. J., Eisenstein, D. J., et al. 2013, Phys. Rep., 530, 87 [NASA ADS] [CrossRef] [MathSciNet] [Google Scholar]
Appendix A: Cosmological corner plots ΛCDM
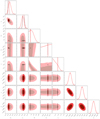 |
Fig. A.1. Cosmological results (clusters only in light shading, Planck2018 with the black dotted line and clusters+Planck2018 in dark shading) for a a Planck-like catalog of 513 objects in a ΛCDM cosmology. |
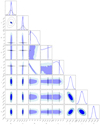 |
Fig. A.2. Cosmological results (clusters only in light shading, Planck2018 with the black dotted line and clusters+Planck2018 in dark shading) for a Euclid-like catalog of 66 252 objects in a ΛCDM cosmology. |
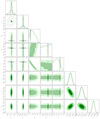 |
Fig. A.3. Cosmological results (clusters only in light shading, Planck2018 with the black dotted line and clusters+Planck2018 in dark shading) for a Future catalog of 153 891 objects in a ΛCDM cosmology. |
Appendix B: Cosmological corner plots w0waCDM
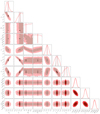 |
Fig. B.1. Cosmological results (clusters only in light shading, Planck2018 with the black dotted line and clusters+Planck2018 in dark shading) for a Planck-like catalog of 513 objects in a w0waCDM cosmology. |
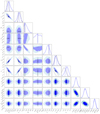 |
Fig. B.2. Cosmological results (clusters only in light shading, Planck2018 with the black dotted line and clusters+Planck2018 in dark shading) for a Euclid-like catalog of 66 252 objects in a w0waCDM cosmology. |
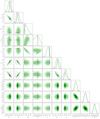 |
Fig. B.3. Cosmological results (clusters only in light shading, Planck2018 with the black dotted line and clusters+Planck2018 in dark shading) for a Future catalog of 153 891 objects in a w0waCDM cosmology. |
Appendix C: Corner plots νCDM
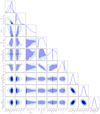 |
Fig. C.1. Cosmological results (clusters only in light shading, Planck2018 with the black dotted line, clusters+Planck2018 in dark shading) for a Euclid-like catalog of 65 994 objects in a νCDM cosmology. |
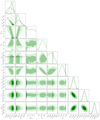 |
Fig. C.2. Cosmological results (clusters only in light shading, Planck2018 with the black dotted line and clusters+Planck2018 in dark shading) for a catalog of 151 427 objects in a νCDM cosmology. |
All Tables
Covariance matrix, CHMF, reconstructed for parameters (a, p, A0), all dimensionless.
Fiducial cosmological parameters adopted to generate the mock catalogs in the three cosmological scenarios.
All Figures
 |
Fig. 1. Relative difference of the Tinker et al. (2008) and the Despali et al. (2015) mass functions at z = 1 for a ΛCDM cosmology. To get a robust comparison between the two mass functions, we extrapolated the values of the parameters of the Tinker mass function (A, a, b, c) for Δvir(z = 1), which is the overdensity used for the Despali mass function. In red, we show the convex envelope of all the scenarios covered by the error bars provided by Despali et al. (2015). The mass is defined with respect to the virial radius. |
| In the text | |
 |
Fig. 2. 68 and 95% confidence contours on the parameters a and A0, from the best-fit Gaussian to the MCMC chains provided by Despali et al. (2015). The black dots delineate the original 68% contour from the MCMC chains. |
| In the text | |
 |
Fig. 3. 68 and 95% percent contours on the parameters a, p and A0. The blue ellipses are obtained when α = 1, i.e., the current precision provided by Despali et al. (2015). The black dashed curves are obtained for α = 0.3, and the dotted curves for α = 2. |
| In the text | |
 |
Fig. 4. In light blue, MCMC 68% and 95% contours for the cosmological parameters and the halo mass function parameters for a Euclid-like catalog. We fixed α = 1. The dark blue contours are obtained when adding Planck priors. The dashed lines are the Gaussian fit from which the covariance matrix and subsequently the Fisher matrix Fclusters(α = 1) is computed. |
| In the text | |
 |
Fig. 5. Relative variation of the error on the matter density parameter ϵ(Ωm) for the three different sizes of catalogs. For all catalogs, the value of α required to avoid degrading the constraint by more than 5% is much greater than 1. The current knowledge of the mass function (α = 1) is sufficient. This is the result for clusters only; the results for clusters plus Planck 2018 priors are summarized in Table 5. |
| In the text | |
 |
Fig. 6. Relative variation of the error on σ8 for the three catalogs. The level of precision on the HMF reaches the limit of current knowledge (α → 1) for a Euclid-like catalog (Blue). For the largest catalog (Green), the constraints on the HMF need to be 20% better. This is the result for clusters only; the results for clusters plus Planck 2018 priors are summarized in Table 5. |
| In the text | |
 |
Fig. 7. Relative variation of the FoM (inverse of the area within the error ellipse in the two-dimensional parameter space) in the Ωm − σ8 plane. For the two large catalogs, α is close to the limit value 1. This is the result for clusters only; the results for clusters plus Planck 2018 priors are summarized in Table 5. |
| In the text | |
 |
Fig. 8. Cosmological parameters obtained for a catalog of 151 427 objects (Future). In orange, the Planck (2018) contours, and in green, the clusters combined with Planck priors. We expect, for the largest catalog, a 2σ measurement of the neutrino mass scale. The full corner plot with all parameters is given in Appendix C. |
| In the text | |
 |
Fig. 9. Evolution of the uncertainty in the Ωm − ∑mν plane. In blue, the Euclid-like case, and in green a larger Future catalog. |
| In the text | |
 |
Fig. A.1. Cosmological results (clusters only in light shading, Planck2018 with the black dotted line and clusters+Planck2018 in dark shading) for a a Planck-like catalog of 513 objects in a ΛCDM cosmology. |
| In the text | |
 |
Fig. A.2. Cosmological results (clusters only in light shading, Planck2018 with the black dotted line and clusters+Planck2018 in dark shading) for a Euclid-like catalog of 66 252 objects in a ΛCDM cosmology. |
| In the text | |
 |
Fig. A.3. Cosmological results (clusters only in light shading, Planck2018 with the black dotted line and clusters+Planck2018 in dark shading) for a Future catalog of 153 891 objects in a ΛCDM cosmology. |
| In the text | |
 |
Fig. B.1. Cosmological results (clusters only in light shading, Planck2018 with the black dotted line and clusters+Planck2018 in dark shading) for a Planck-like catalog of 513 objects in a w0waCDM cosmology. |
| In the text | |
 |
Fig. B.2. Cosmological results (clusters only in light shading, Planck2018 with the black dotted line and clusters+Planck2018 in dark shading) for a Euclid-like catalog of 66 252 objects in a w0waCDM cosmology. |
| In the text | |
 |
Fig. B.3. Cosmological results (clusters only in light shading, Planck2018 with the black dotted line and clusters+Planck2018 in dark shading) for a Future catalog of 153 891 objects in a w0waCDM cosmology. |
| In the text | |
 |
Fig. C.1. Cosmological results (clusters only in light shading, Planck2018 with the black dotted line, clusters+Planck2018 in dark shading) for a Euclid-like catalog of 65 994 objects in a νCDM cosmology. |
| In the text | |
 |
Fig. C.2. Cosmological results (clusters only in light shading, Planck2018 with the black dotted line and clusters+Planck2018 in dark shading) for a catalog of 151 427 objects in a νCDM cosmology. |
| In the text | |
Current usage metrics show cumulative count of Article Views (full-text article views including HTML views, PDF and ePub downloads, according to the available data) and Abstracts Views on Vision4Press platform.
Data correspond to usage on the plateform after 2015. The current usage metrics is available 48-96 hours after online publication and is updated daily on week days.
Initial download of the metrics may take a while.


![$$ \begin{aligned} \sigma ^2 (M,z)=\int {\frac{1}{2\pi ^2}P_{\mathrm{lin} }(k,z)W^2 [kR(M)]k^2\mathrm{d} k}, \end{aligned} $$](/articles/aa/full_html/2021/05/aa40293-21/aa40293-21-eq3.gif)


![$$ \begin{aligned} \delta _c (z) \approx \frac{3}{20} (12 \pi )^{2/3} [1+0.0123 \log (\Omega _{\rm m}(z))], \end{aligned} $$](/articles/aa/full_html/2021/05/aa40293-21/aa40293-21-eq7.gif)


![$$ \begin{aligned} \chi (M,z)=\left\{ \begin{array}{ll} 1&\mathrm{if }\ M \in [M_{\mathrm{thres} },+\infty ] ~ \mathrm{and}~ z\in [0,2] \\ 0&\mathrm{otherwise} \end{array}\right. \end{aligned} $$](/articles/aa/full_html/2021/05/aa40293-21/aa40293-21-eq17.gif)


