Open Access
Fig. 3.
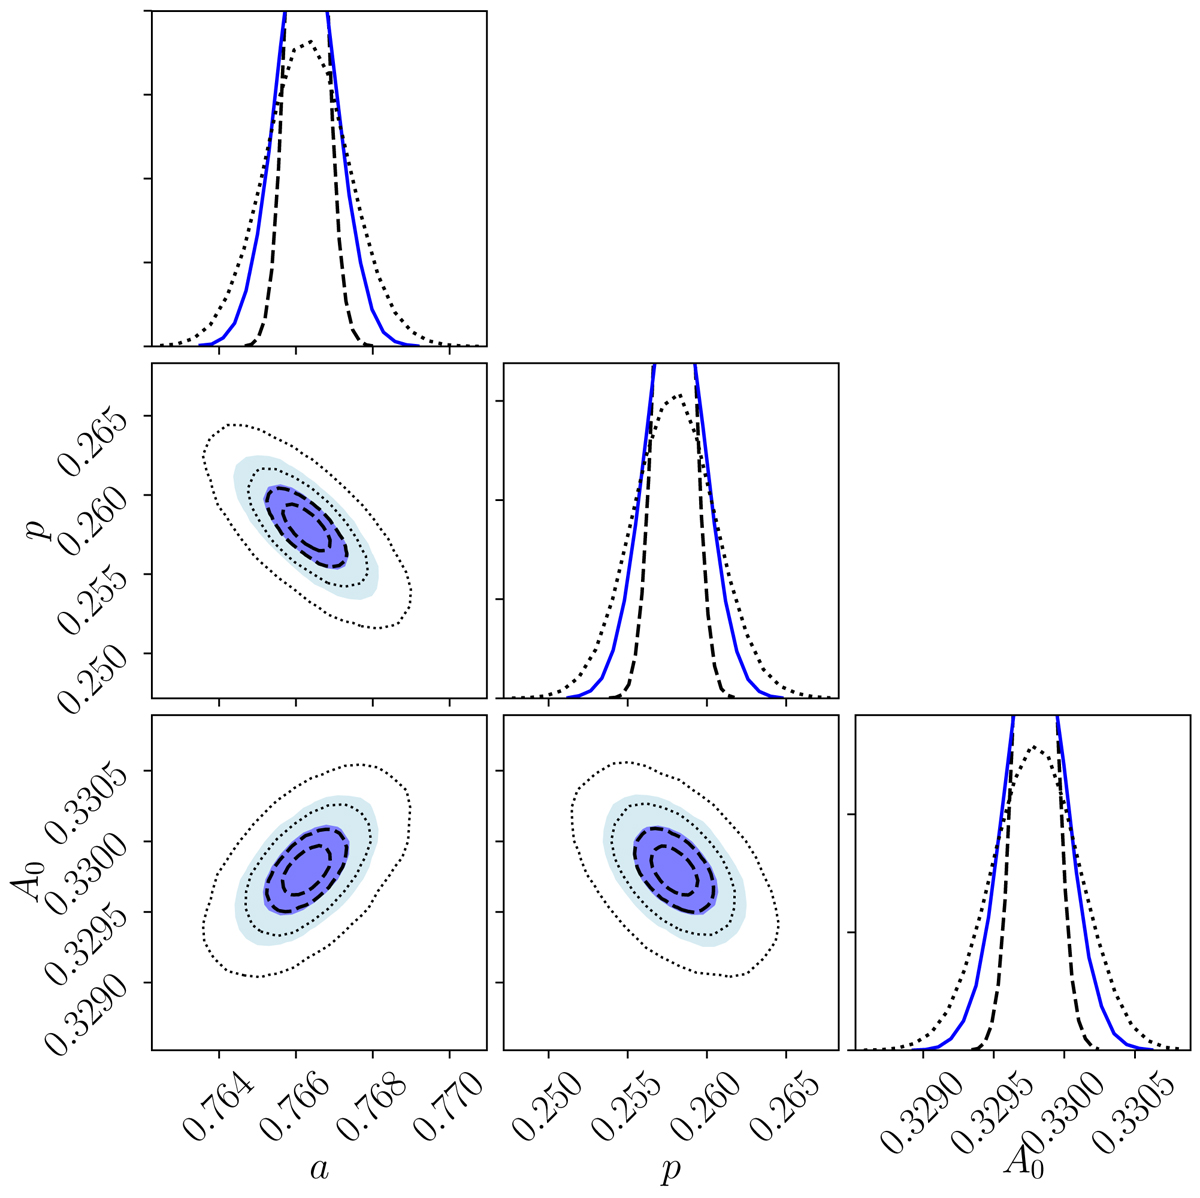
68 and 95% percent contours on the parameters a, p and A0. The blue ellipses are obtained when α = 1, i.e., the current precision provided by Despali et al. (2015). The black dashed curves are obtained for α = 0.3, and the dotted curves for α = 2.
Current usage metrics show cumulative count of Article Views (full-text article views including HTML views, PDF and ePub downloads, according to the available data) and Abstracts Views on Vision4Press platform.
Data correspond to usage on the plateform after 2015. The current usage metrics is available 48-96 hours after online publication and is updated daily on week days.
Initial download of the metrics may take a while.