| Issue |
A&A
Volume 649, May 2021
|
|
|---|---|---|
| Article Number | A167 | |
| Number of page(s) | 8 | |
| Section | Stellar structure and evolution | |
| DOI | https://doi.org/10.1051/0004-6361/202040253 | |
| Published online | 02 June 2021 | |
Hubble spectroscopy of LB-1: Comparison with B+black-hole and Be+stripped-star models⋆
1
Instituto de Astrofísica de Canarias, 38200 La Laguna, Tenerife, Spain
e-mail: This email address is being protected from spambots. You need JavaScript enabled to view it.
2
Dpto. Astrofísica, Universidad de La Laguna, 38205 La Laguna, Tenerife, Spain
3
Centro de Astrobiología, ESAC Campus, Villanueva de la Cañada 28692, Spain
4
Dr. Karl Remeis-Observatory & ECAP, Astronomical Institute, Friedrich-Alexander University Erlangen-Nuremberg (FAU), Sternwartstr. 7, 96049 Bamberg, Germany
5
Space Telescope Science Institute, 3700 San Martin Drive, Baltimore, MD 21218, USA
6
Astrophysics Research Centre, School of Mathematics & Physics, Queen’s University, Belfast BT7 1NN, UK
Received:
28
December
2020
Accepted:
25
March
2021
Abstract
Context. LB-1 (alias ALS 8775) has been proposed as either an X-ray dim B-type star plus black hole (B+BH) binary or a Be star plus an inflated stripped star (Be+Bstr) binary. The latter hypothesis contingent upon the detection and characterization of the hidden broad-lined star in a composite optical spectrum.
Aims. Our study is aimed at testing the published B+BH (single star) and Be+Bstr (binary star) models using a flux-calibrated UV-optical-IR spectrum.
Methods. The Space Telescope Imaging Spectrograph (STIS) on board the Hubble Space Telescope (HST) was used to obtain a flux-calibrated spectrum with an accuracy of ∼1%. We compared these data with non-local thermal equilibrium (non-LTE) spectral energy distributions (SED) and line profiles for the proposed models. The Hubble data, together with the Gaia EDR3 parallax and a well-determined extinction, were used to provide tight constraints on the properties and stellar luminosities of the LB-1 system. In the case of the Be+Bstr model we adopted the published flux ratio for the Be and Bstr stars, re-determined the Teff of the Bstr using the silicon ionization balance, and inferred Teff for the Be star from the fit to the SED.
Results. The UV data strongly constrain the microturbulence velocity to ≲2 km s−1 for the stellar components of both models. We also find stellar parameters consistent with previous results, but with greater precision enabled by the Hubble SED. For the B+BH single-star model, we find the parameters (Teff, log(L/L⊙), Mspec/M⊙) of the B-type star to be (15 300 ± 300 K, 3.23−0.10+0.09, 5.2−1.4+1.8). For the Bstr star we obtain (12 500 ± 100 K, 2.70−0.09+0.09, 0.8−0.3+0.5), and for the Be star (18 900 ± 200 K, 3.04−0.09+0.09, 3.4−1.8+3.5). While the Be+Bstr model is a better fit to the He I lines and cores of the Balmer lines in the optical, the B+BH model provides a better fit to the Si IV resonance lines in the UV. The analysis also implies that the Bstr star has roughly twice the solar silicon abundance, which is difficult to reconcile with a stripped star origin. The Be star, on the other hand, has a rather low luminosity and a spectroscopic mass that is inconsistent with its possible dynamical mass.
Conclusions. We provide tight constraints on the stellar luminosities of the Be+Bstr and B+BH models. For the former, the Bstr star appears to be silicon-rich, while the notional Be star appears to be sub-luminous for a classical Be star of its temperature and the predicted UV spectrum is inconsistent with the data. This latter issue can be significantly improved by reducing the Teff and radius of the Be star, at the cost, however, of a different mass ratio as a result. In the B+BH model, the single B-type spectrum is a good match to the UV spectrum. Adopting a mass ratio of 5.1 ± 0.1, from the literature, implies a BH mass of ∼21−8+9 M⊙.
Key words: techniques: spectroscopic / binaries: spectroscopic / stars: black holes / stars: early-type / stars: evolution / stars: fundamental parameters
Full Table 2 is only available at the CDS via anonymous ftp to cdsarc.u-strasbg.fr (130.79.128.5) or via http://cdsarc.u-strasbg.fr/viz-bin/cat/J/A+A/649/A167
© ESO 2021
1. Introduction
Liu et al. (2019) reported LB-1 (alias ALS 8775) as a long-period B-type star plus black hole (B+BH) binary composed of an ∼8 M⊙ star and a ∼70 M⊙ BH. This model was subsequently revised and added to by a number of authors and the current state of play is nicely summarized by Liu et al. (2020). Broadly speaking, models depend on whether or not the small apparent motions of the strong Balmer emission lines originating from a disk associated with either a Be star or a BH are taken to represent the reflex motion of that companion around the narrow-lined B-type star. This paper examines two competing models. First, there is the B+BH model, where the mass of the B-type star is 3−5 M⊙ (Simón-Díaz et al. 2020; Abdul-Masih et al. 2020), with a corresponding reduction in the potential BH mass and the Be star plus stripped helium star model (Be+Bstr: Shenar et al. 2020). In the latter model, the system is composed of two stellar components of approximately equal visual magnitudes, the Be star being hidden in the optical spectrum due to its high projected rotational velocity (ve sin i). The large radius of the B-type stripped star is a consequence of its blue-ward evolution in the Hertzsprung-Russell diagram (HRD) on its way to the He burning main sequence following mass transfer to the Be-type star. This also explains the low ve sin i of the stripped star, as the previous mass donor, and the high ve sin i of the Be star, as the mass recipient. A similar model (Bodensteiner et al. 2020) has been put forward for the system HR 6819, which Rivinius et al. (2020) argued contained a B+BH binary with a tertiary (Be) star in a very long-period orbit.
This paper presents new flux-calibrated low and medium resolution Hubble spectroscopy covering far UV to near-IR wavelengths that, combined with the recent Gaia EDR3 parallax, provide new constraints on the properties of the proposed models.
2. Observational data
The spectroscopic data were obtained under program GO 16079 (P.I. Lennon) in response to the Cycle 27 mid-cycle call for proposals. The primary objective was to obtain a flux calibrated spectral energy distribution (SED) with an accuracy of 1% or better (Bohlin et al. 2020), following the logic set out in Bohlin et al. (2014). We therefore obtained low-resolution wide slit spectrophotometry in the UV and optical using the Space Telescope Imaging Spectrograph (STIS) and near-IR grism spectra obtained with the Wide Field Camera 3 (WFC3). In addition, we obtained narrow-slit medium resolution spectra covering the Balmer jump and the highest members of the Balmer series of lines from Hϵ to the series limit. Data were processed using Instrument Development Team (IDL) programs that enable a superior flux calibration compared to the standard pipeline products (Fitzpatrick et al. 2019) and is identical to the methods used to process Hubble flux standards (Bohlin et al. 2019; Bohlin & Deustua 2019).
A summary of the spectroscopic observations is provided in Table 1, while the merged SED is attached as an ASCII table, Table 2, while the full version is available electronically. As expected for the low-resolution data, small offsets of the wavelength scale of ∼1 pixel are apparent, due to slight off-centering in the wide slit. These corrections were determined by comparison with the predicted radial velocity of the narrow-lined star using the ephemeris of Liu et al. (2020) and have been applied to the SED. The G430M data were taken with a narrow slit and before use were corrected for slit losses by applying scalar correction factors of 1.123 and 1.150 to the 3537−3823 and 3793−4079 Å data, respectively, as determined from the low-resolution data.
Summary of Hubble spectroscopic data obtained with STIS and WFC3/IR under program 16079.
Flux-calibrated spectrum.
We also obtained short WFC3/IR images, using the on/off-band Pβ filters (F128N/F130N) to check for possible image extension due to circumstellar emission or potential blending of a close optical companion. The PSFs of LB-1 appear point-like in both images, with full-width half-maxima similar to each other and to a nearby faint field star with FWHM = 0.23″ and ellipticities of 0.3% and 1.3% for the F128N and F130N filters, respectively.
3. Methods
The data were modeled using the solar metallicity grid of TLUSTY plane parallel non-LTE model atmospheres for B-type stars (Lanz & Hubeny 2007), with a microturbulent velocity that is appropriate for main-sequence stars (vt = 2 km s−1). These were supplemented with additional models as required, using the TLUSTY model atmosphere code (Hubeny 1988; Hubeny & Lanz 1995) and with the same input model atoms as Lanz & Hubeny (2007). We tested two scenarios, the B+BH scenario as represented by a “single” stellar model (Simón-Díaz et al. 2020), and the Be+Bstr scenario represented by a “binary” composite of two models (Shenar et al. 2020). Synthetic spectra were convolved with appropriate line spread functions (LSF) taken from the STIS web pages1 prior to re-binning them to match the data. We adopted vacuum wavelengths to match the pipeline data products and radial velocity shifts appropriate to the phase of each observation were taken from the ephemeris of Liu et al. (2020).
The primary diagnostics feature the Balmer jump (or Balmer decrement: BD), Balmer line profiles (in the G430M data), and strong metal lines in the UV (Fig. 1, lower panel). The SED constrains the extinction law that is required to fit the flux calibrated data, which, together with the Gaia EDR3 parallax measurement, enable a precise estimate of stellar angular radii, the ratio of the stellar radius to distance (r/d), and, hence, the stellar radii. This approach avoids uncertainties in the normalization of observed spectra, which can be important in the vicinity of broad Balmer lines (Simón-Díaz et al. 2020) and, in particular, removes the subjective assignment of the continuum in the UV and near the higher Balmer series lines.
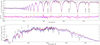 |
Fig. 1. Comparison of Hubble data (black) with single B-type star model (orange) and binary Be+Bstr model (magenta), as summarized in Table 4, with the main contributing species labeling specific absorption features. Top panel: illustrates the good fit of both models to the G430M data, with the binary model being a better fit to the hydrogen line cores and to the He I 4026 Å line, as indicated by the residuals plotted below the spectra. Also shown are the models of Simón-Díaz et al. (2020, grey) and Shenar et al. (2020, blue). Lower panel: compares the FUV data (same color coding) illustrating that, for example, the Fe III complex of lines around 1900 Å is much too strong in the Shenar et al. (2020) model. Neither interstellar lines nor disk emission are included in the models. |
4. Results
We replicated the CHORIZOS (Maíz Apellániz 2004) analysis presented in Appendix C of Simón-Díaz et al. (2020) using the new SED results in Teff = 15 090 ± 300 K for luminosity class (LC) 5 (log g = 4.04) and Teff = 15 770 ± 290 K for LC 4 (log g = 3.38), with an optical-IR extinction curve (Maíz Apellániz et al. 2014) that is very similar to that of Simón-Díaz et al. (2020). However their best-fit model, with Teff = 14 000 ± 500 K and log g = 3.5 ± 0.15, was found to be too cool to match the BD (Fig. 1, upper panel, gray line). We derived a slightly higher temperature, Teff = 15 300 ± 200 K, and log g = 3.6 ± 0.15 (assuming N[He/H] = 0.1 by number) by fitting the BD and the Balmer lines, which are in good agreement with the CHORIZOS result and that of Simón-Díaz et al. (2020) (although with a smaller uncertainty in Teff). The SED fit also confirms the small near-IR continuum excess from the disk for a Be disk or an accretion disk.
The Be+Bstr model of Shenar et al. (2020) with (Teff, log g, vt, N[He/H]) of (18 000 ± 2000 K, 4.0 ± 0.3 dex, 15 km s−1, 0.1) and (12 700 ± 2000 K, 3.0 ± 0.2 dex, 2 km s−1, 0.21) for the Be and Bstr components, assuming the Bstr star contributes 55% of the V-band flux and solar metallicity, is also an excellent fit to the G430M data. Indeed, it is a better fit to the Balmer line cores (which are too deep in the single star model) and to the He I 4026 Å line. To some extent, these differences are a consequence of the adopted flux ratio since it is a constraint of the fitting process in the Be+Bstr model, while in the B+BH model, the residuals of the fit can be attributed to the presence of the disk line emission (Simón-Díaz et al. 2020). Irrgang et al. (2020) proposed a cooler, more helium-rich star, however the spectrum of this lone object is much too cool to fit the BD and this assumption is not pursued further here.
The UV, on the other hand (Fig. 1, lower panel, blue line), demonstrates that this specific Be+Bstr model is a much poorer fit to the data than the single star model, as exemplified by the Fe III lines around 1900 Å. Since the Be star flux is roughly two to three times that of the stripped star in the UV, and the metal lines in the UV are much stronger than in the optical, the Be star features cannot be easily hidden with a high ve sin i. These differences are largely driven by the adoption of vt = 15 km s−1 for the Be star, which has a significant impact on the strong saturated lines in the UV. While microturbulent velocities in Be stars are poorly characterized (Dunstall et al. 2011), such a high value is clearly ruled out by the UV data, which set an upper limit of vt = 2−3 km s−1.
Using the new data, we can re-assess the Be+Bstr stellar parameters. For this purpose, we computed an extended grid of composite Be+Bstr TLUSTY models for a range of effective temperatures, microturbulence values, flux ratios, helium abundance (defined as number ratio N[He/H]), and silicon abundance (X[Si], in units of the solar silicon abundance mass faction) using the methods and codes outlined in Sect. 3. In the following we refer to the effective temperatures of the Be and Bstr stars as  and
and  respectively. As in Shenar et al. (2020), we initially assume that the Bstr star contributes 55% of the V-band flux, N[He/H] = 0.2, and that log g for the two components is 4.0 and 3.0 for the Be and Bstr stars, respectively. As demonstrated by Shenar et al. (2020), and confirmed here, this combination of surface gravities provides an excellent fit to the Balmer lines, that are the primary log g diagnostic. Furthermore, assuming the Be and Bstr stars are the orbital components, the mass ratio strongly constrains the difference in log g to be Δ(log g) = 1.0 dex (also assuming spherical stars). We also ignore any disk contribution, either continuum or line emission, to the composite spectrum.
For a given choice of  it is straightforward to find the best
  by fitting the BD, as shown in Fig. 2 (left panel). One can see that the minimum reduced-χ2 is only weakly dependent on
  , nevertheless the minima of the curves define the relationship between
  and
and  (Fig. 2, right panel). The slope of this line depends on the adopted flux ratio, as indicated. Therefore if
  and the flux ratio can be determined,
  follows from fitting the BD.
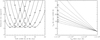 |
Fig. 2. Left-hand panel: reduced-χ2 of the fit to the BD region (G430M data). Each curve represents a specific value of |


Adopting the flux ratio from Shenar et al. (2020) we can derive  using the silicon ionization balance, a standard technique in model atmosphere analysis that requires the same silicon abundance from different ionization stages. The obvious modification is that the theoretical equivalent widths are measured from the composite spectra. We note that the Be star in this context is simply providing a veiling effect since its metal lines are washed out into the continuum at high ve sin i. This is accounted for by combining a Bstr and a Be model, with appropriate weights and parameters, and measuring the theoretical equivalent widths from the resulting spectrum. This approach takes into account small wavelength dependent corrections to the adopted V-band flux ratio that depend on the difference in Teff of the two stars. We use the Si II doublet lines 4128 Å and 4131 Å, and the Si III triplet lines at 4553 Å, 4568 Å and 4575 Å (the 4553 Å component is corrected for a blended line of S II). Equivalent widths, with uncertainties, are give in Table 3. We do not use the strong Si II doublet lines at 6347 Å and 6371 Å as the former is blended with a Mg II doublet and the latter is very discrepant from the other lines. We suspect that this discrepancy may be due to additional veiling of the continuum due to the disk (the system has an IR excess) and, hence, restrict our analysis to the blue optical lines. Fit contours in the abundance versus Teff plane are illustrated in Fig. 3, from which we find
  = 12 500 ± 100 K, and
  = 18 900 ∓ 200 K from the fit to the BD. This is in reasonable agreement with Shenar et al. (2020), though with much reduced uncertainties, given their use of LTE models and their reliance upon He I to Mg II line ratios in addition to Si II to Si III. Besides the Si enhancement revealed by Fig. 3, we find that Mg is enhanced and strong signs of CN processed material in the Bstr star (Table 3 and Fig. 4).
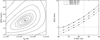 |
Fig. 3. Diagnostic diagrams used to characterize the stellar parameters of the stripped star, and its contribution to the total flux. Left-hand panel: fit diagram showing reduced-χ2 contours defining the best fitting |

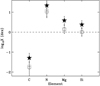 |
Fig. 4. Filled star symbols indicate the abundances obtained for the Bstr model parameters listed in Table 4. The open symbols represent the models that are consistent with a solar Si abundance for different helium abundances, N[He/H] = 0.2 (squares) and N[He/H] = 0.3 (circles). |
Equivalent widths (EW) of the lines used in this analysis, as measured off the Keck HIRES spectrum discussed in Simón-Díaz et al. (2020).
The new solution is illustrated in Fig. 1, now exhibiting a similarly good fit to the UV data (lower panel). We quantify this using the flux errors of the Hubble data to calculate the reduced-χ2 values of the two models. We exclude the Lα and 2200 Å extinction bump regions from this comparison, as these are not sufficiently modeled using a global extinction law (Sect. 3), and proceed with a piece-wise correction for extinction in the resulting sub-regions of the spectrum. We determine reduced-χ2 values of 4.4 and 3.3 for the Be+Bstr and B+BH models, respectively. Evidently, the latter is slightly better at reproducing the data, the larger value for the Be+Bstr model is due to various metal lines in the Be+Bstr model being slightly too strong and broad. However, it is more useful to focus on the features of greatest disagreement in this comparison, such as the Si IV doublet 1393.73 and 1402.73 Å (Fig. 1, lower panel). In Fig. 5, we present a close-up view around this feature that clearly shows the superior performance of the B+BH model (i.e., a single star) as the Si IV doublet is much too strong in the Be+Bstr spectrum. This deficiency in the Be+Bstr model is due to the strong contribution of Si IV and, to a lesser extent Fe III lines, in the red wing of the 1393.73 Å component, from the hotter and UV-brighter Be star. We note that these Si IV resonance lines are so saturated that they are insensitive to even quite large abundance changes and, hence, decreasing the silicon abundance cannot solve this problem. Further, even though the solution illustrated in Fig. 3 implies a silicon abundance for the Bstr star that is roughly twice solar, it is intrinsically weaker in the Bstr star, which is also fainter than the Be star in the UV. Varying ve sin i of the Be star by ±50 km s−1 has a negligible impact on these results, given the spectral resolution.
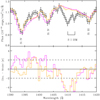 |
Fig. 5. Close-up view of the Si IV doublet lines at 1393.73 and 1402.73 Å, as well as the Si III line at 1417.24 Å. Color coding is the same as in Fig. 1, the observational data now having their statistical error bars added. Lower panel: illustrates the difference between the data and the two models in units of 1σ, horizontal dashed lines indicating the ±2σ level. |
So far we have assumed that vt = 2 km s−1 for the Bstr star, but adopting vt = 0 km s−1 has negligible effect on the strong UV lines as the thermal Doppler widths of the lines are approximately 3 km s−1 for Si and 2 km s−1 for Fe, (see e.g., McErlean et al. 1998; Smith & Howarth 1998). The high silicon abundance referred to above, namely, about twice solar, is clearly at odds with Shenar et al. (2020) who assumed a solar metal abundances for the Bstr star in the determination of its stellar parameters, and in the derivation of the Be/Bstr V-band flux ratio. Based on an analogy with the discussion of vt for the Be star, it may seem that increasing this value above 2 km s−1 to reduce the silicon abundance would be a practical solution. However, this would lead to a value of vt ∼ 4 km s−1, which is well above the thermal speed of the ions at this low Teff and would result in a UV spectrum that is strongly in disagreement with the observations. Also, as discussed in Simón-Díaz et al. (2020), the line profiles imply an upper limit of vt ∼ 2 − 3 km s−1.
In light of the above, we carried out an exploratory calculation in which we varied the flux ratio and the helium abundance of the Bstr star (we adopt grid steps of N[He/H] = 0.1, 0.2 and 0.3) to look for solutions with a solar Si abundance. It is worth noting that there are some trends aimed at explaining how the constraints drive the solution. For instance,  is relatively insensitive to helium abundance, but increases a little with increasing relative brightness of the Bstr star, whereas
  increases with greater Bstr star contribution due to the need to compensate for the brighter Bstr star, but a higher Bstr helium abundance leads to a decrease in
  due to the decrease in the BD of the Bstr star. In Fig. 3, the right-hand panel shows how the derived silicon abundance varies as a function of flux ratio and N[He/H], implying that a solar Si abundance requires a flux ratio such that the Bstr star contributes roughly 65−70% of the V-band flux, depending on helium abundance. Specifically, for the N[He/H] = 0.2 and 67% flux contribution, we derive
  = 12 700 ± 100 K and
  = 20 875 ± 300 K, while for N[He/H] = 0.3 and 64% flux contribution the corresponding values are 12 700 ± 100 K and 20 100 ± 250 K. The derived surface abundances are also illustrated in Fig. 4. Recalling that the specified Δ log g = 1.0 dex ensures that the mass ratio is satisfied for a contribution of 55%, these solar-Si solutions imply only small changes in this parameter of Δ(log g) = 1.1 and 0.9 dex for the N[He/H] = 0.2 and 0.3 cases, respectively. However, the Be star in these cases has a higher temperature than before and the fit to the data is degraded. One possible conclusion is that the Bstr star is enhanced in Si, hence, the flux ratio we inferred is incorrect and undetermined.
Further tests imply that we need to have  18 000 K in order to fit the UV Si IV lines at these flux ratios, which, in turn implies
  K. While these values are close to those of Shenar et al. (2020), they are in disagreement with the BD for the above flux ratios. This suggests the need for an investigation of the full parameter space, relaxing the flux ratio and log g constraints (and hence decoupling the solution from the proposed mass ratio).
Finally, in this section, in the context of the UV, it is informative to consider higher-resolution predictions for the region containing the Si IV lines (Fig. 6) that clarify the separate contributions to the composite spectrum. This also serves to emphasize that higher-resolution spectra in the UV, obtainable with STIS E140M or COS G160M modes, can provide strong constraints on the nature of a potential secondary, and critical leverage for spectral disentangling or synthesis.
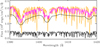 |
Fig. 6. Medium resolution (R = 20 000) view of the Si IV doublet for the single star model (orange) and binary model (magenta) with vt = 2 km s−1 for the Be star. The upper and lower black lines represent the contributions from the Be/Bstr stars, respectively, in the latter scenario. |
5. Discussion
Table 4 lists the stellar parameters derived in the previous section for a Bstr flux contribution of 55%, as well as the estimated extinction, angular radius, stellar radius, and spectroscopic masses for both B+BH and Be+Bstr models.
Stellar parameters of models discussed here, plus derived quantities.
In deriving stellar radii, we use the Gaia EDR3 results (Gaia Collaboration 2021) for the LB-1 parallax of ϖ = 0.3592 ± 0.0296 mas, notably corrected as recommended by the recipe from Lindegren et al. (2021a), which depends on magnitude, color, and ecliptic distance, and that for our target yields a zero point of −0.0511 mas. Such a correction does not include the effect of the covariance for small angular distances seen in the LMC data of Lindegren et al. (2021b), namely, the checkered pattern, and to account for it, we add 0.0260 mas in quadrature to the parallax uncertainty2, resulting in ϖ = 0.4103 ± 0.0394 mas. Using the OB star prior of Maíz Apellániz (2001), Maíz Apellániz et al. (2008) this leads to a distance of  kpc, consistent with
  kpc estimated in Simón-Díaz et al. (2020) using Gaia DR2 data, though with a smaller uncertainty. The EDR3 data for LB-1 are now based on 26 transits, compared to 14 in DR2, and following the discussion in Appendix D of Simón-Díaz et al. (2020), these new data also do not display evidence for orbital motion of the B-star (see also the discussion in Eldridge et al. 2020). The ruwe parameter of 1.22 still indicates a clean astrometric fit, while the image parameter determination quality flags, ipd_multi_peak and ipd_odd_win, are both 0, which is consistent with the PSF from the WFC3/IR image. However, while the goodness of fit parameter ipd_gof_harmonic_amplitude is on the high side at 0.09, this is not reflected in the WFC3/IR images mentioned in Sect. 2, which have negligible ellipticity. As discussed in detail in Appendix D of Simón-Díaz et al. (2020), we attribute the puzzling lack of evidence for the orbital motion of the system to it being aligned almost edge-on and the particular circumstances of its orientation with respect to the sun and its proper motion vector.
The luminosity of the LB-1 objects are now tightly constrained by the Hubble flux-calibrated spectrum, the well-determined extinction law, and the Gaia EDR3 parallax. As the HRD in Fig. 7 demonstrates, for the Be+Bstr solution, the Be star component is close to the zero age main sequence (ZAMS), which is not typical for classical Be stars (Fabregat & Torrejón 2000). This characteristic is shared with the Be star proposed by Bodensteiner et al. (2020) for the system HR 6819. Further, as discussed above, solutions encompassing a solar Si abundance predict an even smaller and hotter Be star, exacerbating this discrepancy. However these models cannot reproduce the observed UV spectrum, which implies the need for a cooler Be star (Teff ∼ 17 500−18 000 K), and hence a hotter silicon-rich Bstr star (Teff ∼ 13 000). This family of solutions effectively relaxes the constraints on the flux and mass ratio and indicates the need for a more complete exploration of the available parameter space, now including the UV. This task is beyond the scope of this paper but would be a useful check to ascertain that the Balmer emission is indeed a measure of the reflex velocity of the companion to the narrow-lined star.
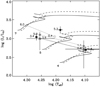 |
Fig. 7. HRD for the components of LB-1 as derived here (with error bars). The single star solution is the filled star, while the binary solution components are filled circles joined by a dotted line. The Be star, or broad lined star, is the hotter of these two components. The Shenar et al. (2020) parameters are indicated (diamonds), as are our estimates using our updated values of extinction and distance (triangles). Also indicated are the positions for HR 6819 (open circles) as determined by Bodensteiner et al. (2020). For context the evolutionary tracks are the non-rotating (solid lines) and rotating (dashed lines) single star models from Ekström et al. (2012). Symbols are labeled with their spectroscopic masses, and each track is labeled with its initial mass. |
The Be+Bstr model also results in a rather small spectroscopic mass for the Be star, namely, 3.4 M⊙, which is also much too small to be considered a classical Be star of this temperature (see Rivinius et al. 2013). However this estimate assumes spherical symmetry, which may not be correct. As discussed by Frémat et al. (2005), oblateness can lead to estimated gravities being up to 0.4 dex lower than those found at the stellar pole. In turn, this can lead to a significant underestimation of the stellar mass. Additionally, if the Gaia parallax were incorrect, then a distance of ∼3.5 kpc is required to move the Be star into the vicinity of the end of the main sequence. The Bstr star would then have a mass of ∼1.7 M⊙.
Figure 7 also demonstrates good agreement between spectroscopic and evolutionary masses of the B-type star in the B+BH solution, demonstrating an improvement on Simón-Díaz et al. (2020). The current mass implies a potential BH mass of  using the revised mass ratio of 5.1 ± 0.1 (Liu et al. 2020). However, if the very low ve sin i is a consequence of binary interaction the agreement of the spectroscopic mass with single-star evolutionary tracks may be fortuitous. Nevertheless, the distance discussed here restricts the upper limit on the X-ray luminosity of LB-1 to ∼6 × 1030 erg s−1, which is consistent with the faintest known quiescent BH accretion disks (Armas Padilla et al. 2014; Ribó et al. 2017).
While the Be nature of the broad lined star has been attributed to the presence of a disk, as implied by the characteristic Balmer emission lines and IR excess, the SED displays no evidence for a second BD or emission in the Mg II 2800 Å doublet, as is often observed in classical Be stars (Cochetti et al. 2020; Slettebak 1994). Liu et al. (2020) have discussed the Balmer and Paschen emission line spectrum at length, and detect emission wings to a velocity of ±250 km s−1, that for a Keplerian disk measure the projected velocity of the inner edge of the disk. The radius and mass of the Be star in Table 3 lead to values of sin i ∼ 0.52 and a dynamical mass of 12.8 M⊙ (assuming Msin3i = 1.78 from Shenar et al. 2020), adding further tension with the estimated spectroscopic mass of the Be-type star. In order to match the spectroscopic mass one requires sin i ∼ 0.8, supporting the argument that the system is viewed almost edge-on. Obviously, in the context of the B+BH scenario in which the emission arises from an accretion disk around the BH, the above argument does not apply. However, in this case, the small line widths tend to favour a low inclination angle for the accretion disk.
6. Conclusions
The Hubble data enable more precise stellar parameters for the LB-1 system within the B+BH and Be+Bstr models. The B+BH (single star) solution is a better fit to the UV, although the Be+Bstr star model remains superior in the optical. We indicate how the B+BH UV performance can be improved by a combination of a fainter Be star and more helium-rich Bstr star. However, the Be is already close to the ZAMS, unusual for a classical Be star, and this solution would shift it even closer to the ZAMS. We find enhanced Si and Mg in the Bstr star, although with a non-solar abundance ratio (Table 3) and signs of extreme CN processing. In the B+BH model, the B-type star’s position in the HRD now provides better agreement between evolutionary and spectroscopic masses, resolving the tension that previously existed between these masses (Simón-Díaz et al. 2020). However, the very low ve sin i and likely low ve hints at an evolutionary path that involves binary interaction.
Indeed, it is difficult to reconcile the properties of the LB-1 with any of the current evolutionary scenarios (see also the discussion by Liu et al. 2020). We find that higher-resolution UV spectra would serve as a powerful diagnostic for characterizing the nature of a potential companion to the narrow-lined star.
This is a conservative estimate based on the measurements for quasars of Lindegren et al. (2021b). It may be possible to refine it in the future using further analysis (Maíz Apellániz et al., in prep.).
Acknowledgments
This work was supported by the Spanish Ministry of Science and Innovation through grants PGC2018-091 3741-B-C22 and PGC2018-095 049-B-C22, the European Regional Development Fund under grants AYA2017-83216-P, AYA2017-86389-P, ProID2017-01011-5 and the Canarian Agency for Research, Innovation and Information Society. TMD and JIGH acknowledge support via the Ramón y Cajal Fellowships RYC-2015-18148 and RYC-2013-14875 respectively. A.I. acknowledges funding by the Deutsche Forschungsgemeinschaft (DFG) through grant HE1356/70-1. RB and SD acknowledge support from NASA through grant number O2064 from the Space Telescope Science Institute, which is operated by AURA, Inc., under NASA contract NAS 5-26555. This work has made use of data from the European Space Agency (ESA) mission Gaia (https://www.cosmos.esa.int/gaia), processed by the Gaia Data Processing and Analysis Consortium (DPAC, https://www.cosmos.esa.int/web/gaia/dpac/consortium). Funding for the DPAC has been provided by national institutions, in particular those participating in the Gaia Multilateral Agreement.
References
- Abdul-Masih, M., Banyard, G., Bodensteiner, J., et al. 2020, Nature, 580, E11 [Google Scholar]
- Armas Padilla, M., Wijnands, R., Degenaar, N., et al. 2014, MNRAS, 444, 902 [Google Scholar]
- Bodensteiner, J., Shenar, T., Mahy, L., et al. 2020, A&A, 641, A43 [CrossRef] [EDP Sciences] [Google Scholar]
- Bohlin, R. C., & Deustua, S. E. 2019, AJ, 157, 229 [Google Scholar]
- Bohlin, R. C., Gordon, K. D., & Tremblay, P. E. 2014, PASP, 126, 711 [NASA ADS] [Google Scholar]
- Bohlin, R. C., Deustua, S. E., & de Rosa, G. 2019, AJ, 158, 211 [Google Scholar]
- Bohlin, R. C., Hubeny, I., & Rauch, T. 2020, AJ, 160, 21 [Google Scholar]
- Cochetti, Y. R., Zorec, J., Cidale, L. S., et al. 2020, A&A, 634, A18 [EDP Sciences] [Google Scholar]
- Dunstall, P. R., Brott, I., Dufton, P. L., et al. 2011, A&A, 536, A65 [NASA ADS] [CrossRef] [EDP Sciences] [Google Scholar]
- Ekström, S., Georgy, C., Eggenberger, P., et al. 2012, A&A, 537, A146 [NASA ADS] [CrossRef] [EDP Sciences] [Google Scholar]
- Eldridge, J. J., Stanway, E. R., Breivik, K., et al. 2020, MNRAS, 495, 2786 [Google Scholar]
- Fabregat, J., & Torrejón, J. M. 2000, A&A, 357, 451 [NASA ADS] [Google Scholar]
- Fitzpatrick, E. L., Massa, D., Gordon, K. D., Bohlin, R., & Clayton, G. C. 2019, ApJ, 886, 108 [Google Scholar]
- Frémat, Y., Zorec, J., Hubert, A.-M., & Floquet, M. 2005, A&A, 440, 305 [NASA ADS] [CrossRef] [EDP Sciences] [Google Scholar]
- Gaia Collaboration (Brown, A. G. A., et al.) 2021, A&A, 649, A1 [NASA ADS] [CrossRef] [EDP Sciences] [Google Scholar]
- Hubeny, I. 1988, Comput. Phys. Commun., 52, 103 [Google Scholar]
- Hubeny, I., & Lanz, T. 1995, ApJ, 439, 875 [Google Scholar]
- Irrgang, A., Geier, S., Kreuzer, S., Pelisoli, I., & Heber, U. 2020, A&A, 633, L5 [CrossRef] [EDP Sciences] [Google Scholar]
- Lanz, T., & Hubeny, I. 2007, ApJS, 169, 83 [Google Scholar]
- Lindegren, L., Bastian, U., Biermann, M., et al. 2021a, A&A, 649, A4 [EDP Sciences] [Google Scholar]
- Lindegren, L., Klioner, S. A., Hernández, J., et al. 2021b, A&A, 649, A2 [EDP Sciences] [Google Scholar]
- Liu, J., Zhang, H., Howard, A. W., et al. 2019, Nature, 575, 618 [Google Scholar]
- Liu, J., Zheng, Z., Soria, R., et al. 2020, ApJ, 900, 42 [Google Scholar]
- Maíz Apellániz, J. 2001, AJ, 121, 2737 [Google Scholar]
- Maíz Apellániz, J. 2004, PASP, 116, 859 [Google Scholar]
- Maíz Apellániz, J., Alfaro, E. J., & Sota, A. 2008, ArXiv e-prints [arXiv:0804.2553] [Google Scholar]
- Maíz Apellániz, J., Evans, C. J., Barbá, R. H., et al. 2014, A&A, 564, A63 [NASA ADS] [CrossRef] [EDP Sciences] [Google Scholar]
- McErlean, N. D., Lennon, D. J., & Dufton, P. L. 1998, A&A, 329, 613 [NASA ADS] [Google Scholar]
- Ribó, M., Munar-Adrover, P., Paredes, J. M., et al. 2017, ApJ, 835, L33 [Google Scholar]
- Rivinius, T., Carciofi, A. C., & Martayan, C. 2013, A&ARv, 21, 69 [Google Scholar]
- Rivinius, T., Baade, D., Hadrava, P., Heida, M., & Klement, R. 2020, A&A, 637, L3 [CrossRef] [EDP Sciences] [Google Scholar]
- Shenar, T., Bodensteiner, J., Abdul-Masih, M., et al. 2020, A&A, 639, L6 [Google Scholar]
- Simón-Díaz, S., Maíz Apellániz, J., Lennon, D. J., et al. 2020, A&A, 634, L7 [NASA ADS] [CrossRef] [EDP Sciences] [Google Scholar]
- Slettebak, A. 1994, ApJS, 94, 163 [Google Scholar]
- Smith, K. C., & Howarth, I. D. 1998, MNRAS, 299, 1146 [Google Scholar]
All Tables
Summary of Hubble spectroscopic data obtained with STIS and WFC3/IR under program 16079.
Equivalent widths (EW) of the lines used in this analysis, as measured off the Keck HIRES spectrum discussed in Simón-Díaz et al. (2020).
All Figures
|
Fig. 1. Comparison of Hubble data (black) with single B-type star model (orange) and binary Be+Bstr model (magenta), as summarized in Table 4, with the main contributing species labeling specific absorption features. Top panel: illustrates the good fit of both models to the G430M data, with the binary model being a better fit to the hydrogen line cores and to the He I 4026 Å line, as indicated by the residuals plotted below the spectra. Also shown are the models of Simón-Díaz et al. (2020, grey) and Shenar et al. (2020, blue). Lower panel: compares the FUV data (same color coding) illustrating that, for example, the Fe III complex of lines around 1900 Å is much too strong in the Shenar et al. (2020) model. Neither interstellar lines nor disk emission are included in the models. |
| In the text | |
|
Fig. 2. Left-hand panel: reduced-χ2 of the fit to the BD region (G430M data). Each curve represents a specific value of |
| In the text | |
|
Fig. 3. Diagnostic diagrams used to characterize the stellar parameters of the stripped star, and its contribution to the total flux. Left-hand panel: fit diagram showing reduced-χ2 contours defining the best fitting |
| In the text | |
|
Fig. 4. Filled star symbols indicate the abundances obtained for the Bstr model parameters listed in Table 4. The open symbols represent the models that are consistent with a solar Si abundance for different helium abundances, N[He/H] = 0.2 (squares) and N[He/H] = 0.3 (circles). |
| In the text | |
|
Fig. 5. Close-up view of the Si IV doublet lines at 1393.73 and 1402.73 Å, as well as the Si III line at 1417.24 Å. Color coding is the same as in Fig. 1, the observational data now having their statistical error bars added. Lower panel: illustrates the difference between the data and the two models in units of 1σ, horizontal dashed lines indicating the ±2σ level. |
| In the text | |
|
Fig. 6. Medium resolution (R = 20 000) view of the Si IV doublet for the single star model (orange) and binary model (magenta) with vt = 2 km s−1 for the Be star. The upper and lower black lines represent the contributions from the Be/Bstr stars, respectively, in the latter scenario. |
| In the text | |
|
Fig. 7. HRD for the components of LB-1 as derived here (with error bars). The single star solution is the filled star, while the binary solution components are filled circles joined by a dotted line. The Be star, or broad lined star, is the hotter of these two components. The Shenar et al. (2020) parameters are indicated (diamonds), as are our estimates using our updated values of extinction and distance (triangles). Also indicated are the positions for HR 6819 (open circles) as determined by Bodensteiner et al. (2020). For context the evolutionary tracks are the non-rotating (solid lines) and rotating (dashed lines) single star models from Ekström et al. (2012). Symbols are labeled with their spectroscopic masses, and each track is labeled with its initial mass. |
| In the text | |
Current usage metrics show cumulative count of Article Views (full-text article views including HTML views, PDF and ePub downloads, according to the available data) and Abstracts Views on Vision4Press platform.
Data correspond to usage on the plateform after 2015. The current usage metrics is available 48-96 hours after online publication and is updated daily on week days.
Initial download of the metrics may take a while.