Fig. 3.
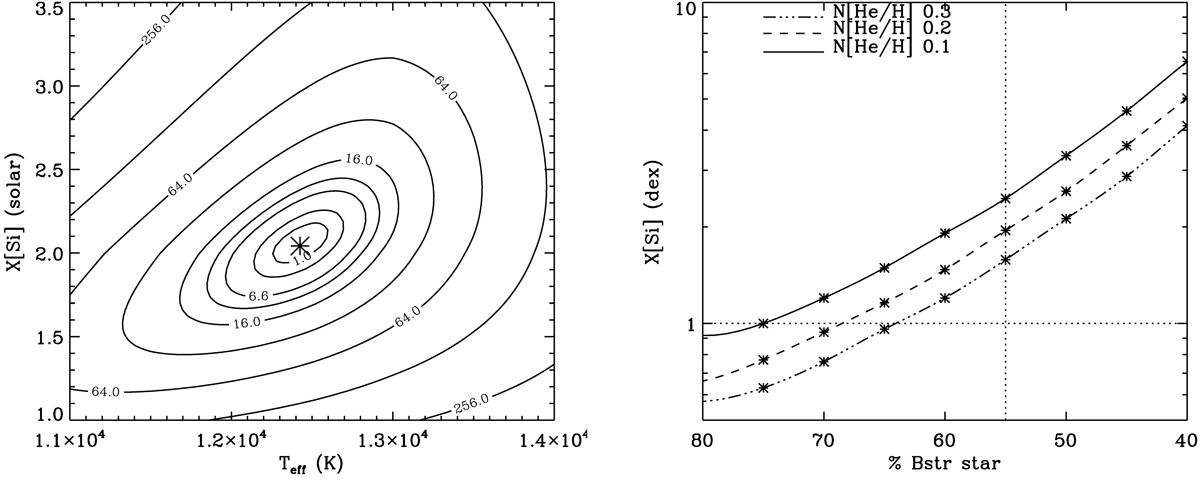
Diagnostic diagrams used to characterize the stellar parameters of the stripped star, and its contribution to the total flux. Left-hand panel: fit diagram showing reduced-χ2 contours defining the best fitting ![]() and silicon abundance. Right-hand panel: dependence of best fitting silicon abundance on percentage contribution of the Bstr star to the V-band, and as a function of helium abundance. The horizontal dotted line indicates solar abundance, and the vertical line is the 55% contribution adopted by Shenar et al. (2020).
and silicon abundance. Right-hand panel: dependence of best fitting silicon abundance on percentage contribution of the Bstr star to the V-band, and as a function of helium abundance. The horizontal dotted line indicates solar abundance, and the vertical line is the 55% contribution adopted by Shenar et al. (2020).
Current usage metrics show cumulative count of Article Views (full-text article views including HTML views, PDF and ePub downloads, according to the available data) and Abstracts Views on Vision4Press platform.
Data correspond to usage on the plateform after 2015. The current usage metrics is available 48-96 hours after online publication and is updated daily on week days.
Initial download of the metrics may take a while.