Fig. 1.
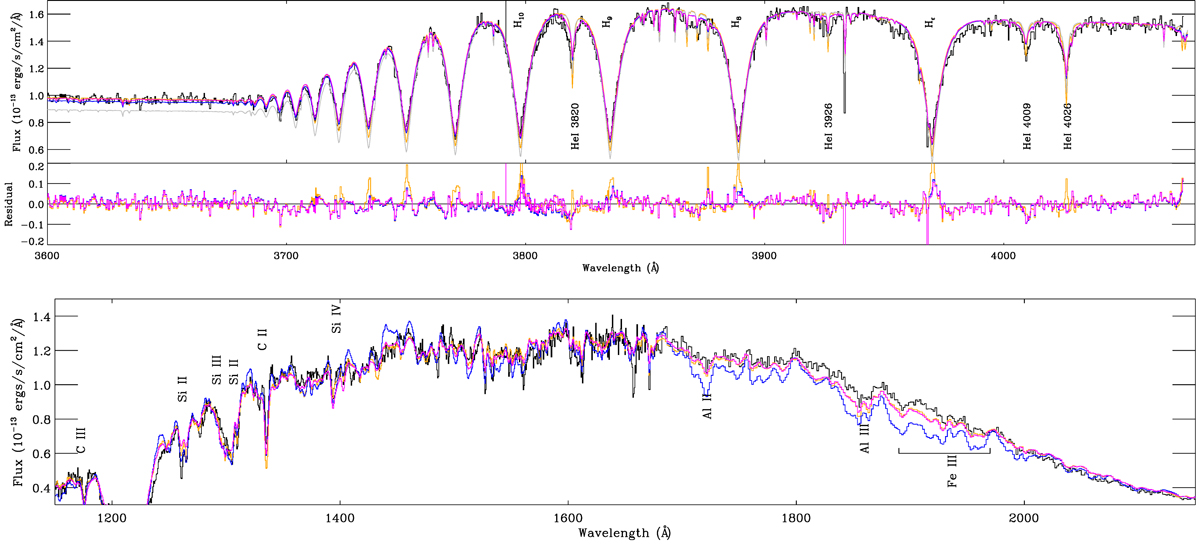
Comparison of Hubble data (black) with single B-type star model (orange) and binary Be+Bstr model (magenta), as summarized in Table 4, with the main contributing species labeling specific absorption features. Top panel: illustrates the good fit of both models to the G430M data, with the binary model being a better fit to the hydrogen line cores and to the He I 4026 Å line, as indicated by the residuals plotted below the spectra. Also shown are the models of Simón-Díaz et al. (2020, grey) and Shenar et al. (2020, blue). Lower panel: compares the FUV data (same color coding) illustrating that, for example, the Fe III complex of lines around 1900 Å is much too strong in the Shenar et al. (2020) model. Neither interstellar lines nor disk emission are included in the models.
Current usage metrics show cumulative count of Article Views (full-text article views including HTML views, PDF and ePub downloads, according to the available data) and Abstracts Views on Vision4Press platform.
Data correspond to usage on the plateform after 2015. The current usage metrics is available 48-96 hours after online publication and is updated daily on week days.
Initial download of the metrics may take a while.