Fig. 2.
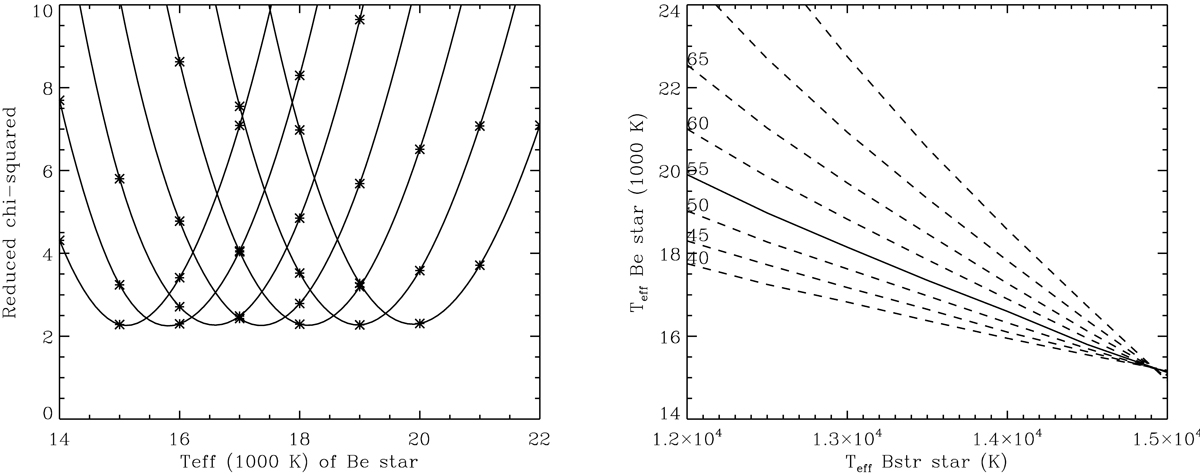
Left-hand panel: reduced-χ2 of the fit to the BD region (G430M data). Each curve represents a specific value of ![]() with values ranging from 12 000 K to 15 000 K, right to left, and for a range of
with values ranging from 12 000 K to 15 000 K, right to left, and for a range of ![]() values. The smooth curves are spline fits to the data points (asterisks). Right-hand panel: minima of the curves define the relationship between
values. The smooth curves are spline fits to the data points (asterisks). Right-hand panel: minima of the curves define the relationship between ![]() and
and ![]() , illustrated by the thick line for a Bstr contribution of 55% of the flux in the V-band. Thin lines indicate analogous relationships for other percentage flux contributions (labeled).
, illustrated by the thick line for a Bstr contribution of 55% of the flux in the V-band. Thin lines indicate analogous relationships for other percentage flux contributions (labeled).
Current usage metrics show cumulative count of Article Views (full-text article views including HTML views, PDF and ePub downloads, according to the available data) and Abstracts Views on Vision4Press platform.
Data correspond to usage on the plateform after 2015. The current usage metrics is available 48-96 hours after online publication and is updated daily on week days.
Initial download of the metrics may take a while.