Fig. 5.
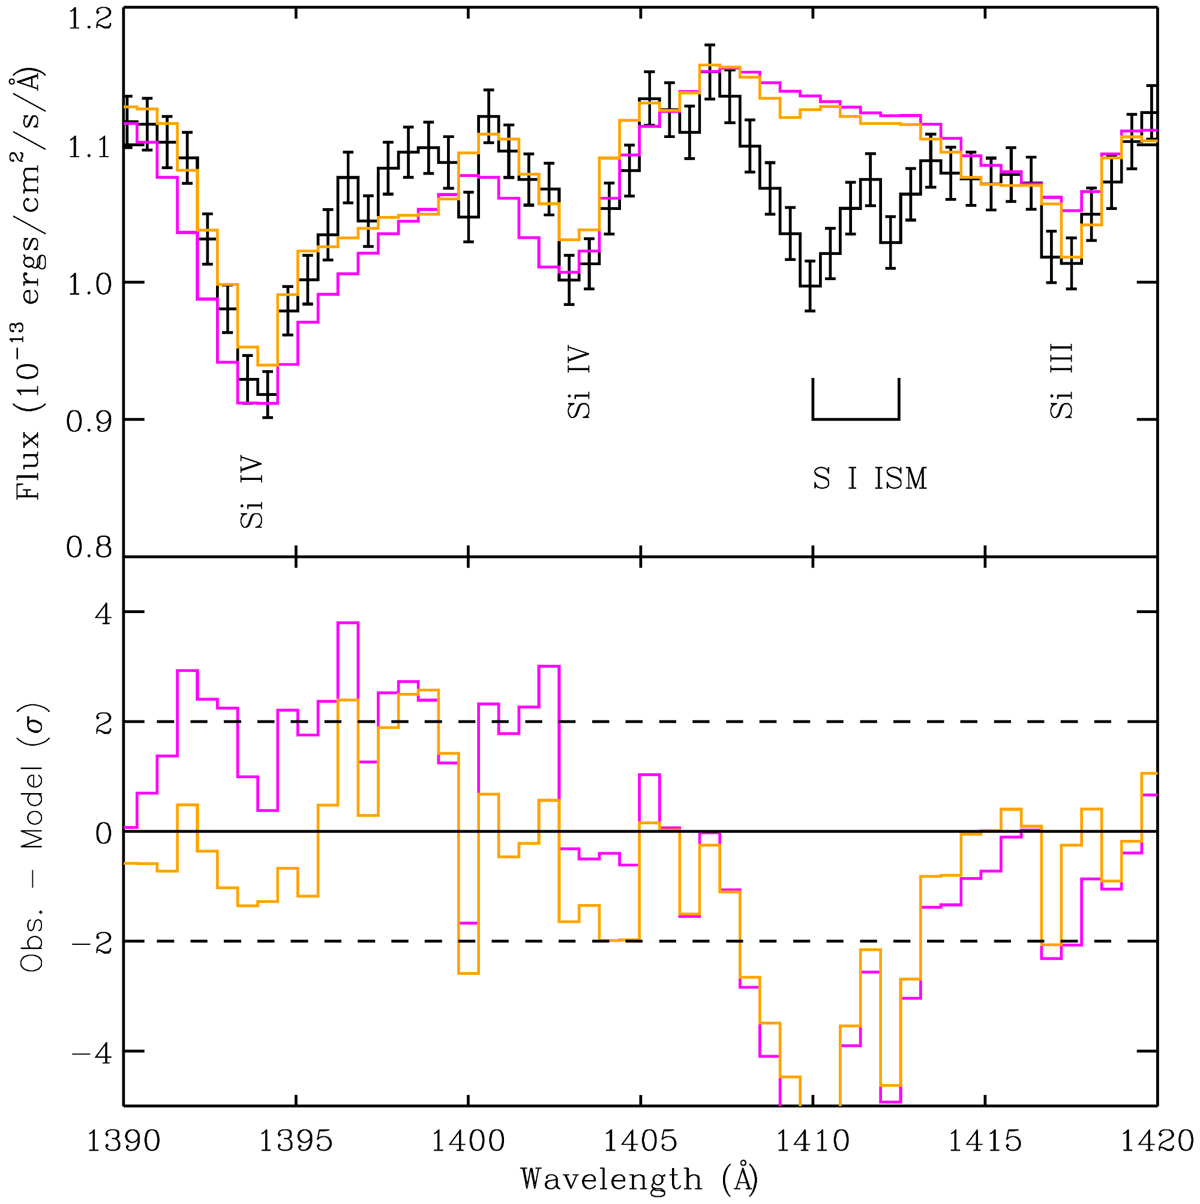
Close-up view of the Si IV doublet lines at 1393.73 and 1402.73 Å, as well as the Si III line at 1417.24 Å. Color coding is the same as in Fig. 1, the observational data now having their statistical error bars added. Lower panel: illustrates the difference between the data and the two models in units of 1σ, horizontal dashed lines indicating the ±2σ level.
Current usage metrics show cumulative count of Article Views (full-text article views including HTML views, PDF and ePub downloads, according to the available data) and Abstracts Views on Vision4Press platform.
Data correspond to usage on the plateform after 2015. The current usage metrics is available 48-96 hours after online publication and is updated daily on week days.
Initial download of the metrics may take a while.