| Issue |
A&A
Volume 648, April 2021
|
|
|---|---|---|
| Article Number | A72 | |
| Number of page(s) | 16 | |
| Section | Interstellar and circumstellar matter | |
| DOI | https://doi.org/10.1051/0004-6361/202140411 | |
| Published online | 13 April 2021 | |
Chemical modeling of the complex organic molecules in the extended region around Sagittarius B2
1
Purple Mountain Observatory and Key Laboratory of Radio Astronomy, Chinese Academy of Sciences,
10 Yuanhua Road,
210023
Nanjing,
PR China
e-mail: This email address is being protected from spambots. You need JavaScript enabled to view it.
; This email address is being protected from spambots. You need JavaScript enabled to view it.
2
School of Astronomy and Space Science, University of Science and Technology of China,
96 Jinzhai Road,
230026
Hefei,
PR China
3
Max Planck Institute for Astronomy,
Königstuhl 17,
69117
Heidelberg,
Germany
4
Department of Chemistry, Ludwig Maximilian University,
Butenandtstr. 5-13,
81377
Munich,
Germany
5
Department of Radio Science and Technology, Shanghai Astronomical Observatory, Chinese Academy of Sciences,
80 Nandan Road,
200030
Shanghai,
PR China
Received:
24
January
2021
Accepted:
8
March
2021
Abstract
Context. The chemical differentiation of seven complex organic molecules (COMs) in the extended region around Sagittarius B2 (Sgr B2) has been previously observed: CH2OHCHO, CH3OCHO, t-HCOOH, C2H5OH, and CH3NH2 were detected both in the extended region and near the hot cores Sgr B2(N) and Sgr B2(M), while CH3OCH3 and C2H5CN were only detected near the hot cores. The density and temperature in the extended region are relatively low in comparison with Sgr B2(N) and Sgr B2(M). Different desorption mechanisms, including photodesorption, reactive desorption, and shock heating, and a few other mechanisms have been proposed to explain the observed COMs in the cold regions. However, they fail to explain the deficiency of CH3OCH3 and C2H5CN in the extended region around Sgr B2.
Aims. Based on known physical properties of the extended region around Sgr B2, we explored under what physical conditions the chemical simulations can fit the observations and explain the different spatial distribution of these seven species in the extended region around Sgr B2.
Methods. We used the macroscopic Monte Carlo method to perform a detailed parameter space study. A static physical model and an evolving physical model including a cold phase and a warm-up phase were used, respectively. The fiducial models adopt the observed physical parameters except for the local cosmic ray ionization rate ζCR. In addition to photodesorption that is included in all models, we investigated how chain reaction mechanism, shocks, an X-ray burst, enhanced reactive desorption and low diffusion barriers could affect the results of chemical modeling.
Results. All gas-grain chemical models based on static physics cannot fit the observations, except for the high abundances of CH3NH2 and C2H5CN in some cases. The simulations based on evolving physical conditions can fit six COMs when T ~ 30−60 K in the warm-up phase, but the best-fit temperature is still higher than the observed dust temperature of 20 K. The best agreement between the simulations and all seven observed COMs at a lower temperature T ~ 27 K is achieved by considering a short-duration ≈102 yr X-ray burst with ζCR = 1.3 × 10⁻¹³ s−1 at the early stage of the warm-up phase when it still has a temperature of 20 K. The reactive desorption is the key mechanism for producing these COMs and inducing the low abundances of CH3OCH3 and C2H5CN.
Conclusions. We conclude that the evolution of the extended region around Sgr B2 may have begun with a cold, T ≤ 10 K phase followed by a warm-up phase. When its temperature reached about T ~ 20 K, an X-ray flare from the Galactic black hole Sgr A* with a short duration of no more than 100 yr was acquired, affecting strongly the Sgr B2 chemistry. The observed COMs in Sgr B2 are able to retain their observed abundances only several hundred years after such a flare, which could imply that such short-term X-rays flares occur relatively often, likely associated with the accretion activity of the Sgr A* source.
Key words: astrochemistry / ISM: abundances / ISM: individual objects: Sgr B2 / ISM: molecules / stars: formation
© ESO 2021
1 Introduction
Over 200 species have been detected to date in the interstellar and circumstellar medium (McGuire 2018). Those that contain six or more atoms are defined as complex organic molecules (COMs; Herbst & van Dishoeck 2009). Among all these species, about one-third were first detected in Sagittarius B2 (Sgr B2; McGuire 2018), which remains the best “hunting ground” for new COMs (Belloche et al. 2013). Sgr B2 is the most massive star-forming region in our Galaxy. It is located at 8.34 ± 0.16 kpc from the Sun (Reid et al. 2014), and the projected distance from the Galactic center is 107 pc (or 43.4′) (Schmiedeke et al. 2016). Due to its proximity to the supermassive black hole Sgr A* at the Galactic center, Sgr B2 is strongly irradiated by the ultraviolet radiation (UV) field and cosmic ray particles (CRPs). The far-ultraviolet (FUV) radiation field has a strength of G0 = 103−104 (Goicoechea et al. 2004; Rodríguez-Fernández et al. 2004) (in units of the average local UV interstellar field by Habing with G0 = 1). The cosmic ray ionization rate is ζCR = 1 − 11 × 10−14 s−1 (Indriolo et al. 2015; Le Petit et al. 2016), which is two to three orders of magnitude higher than the local CRP ionization rate (Spitzer & Tomasko 1968). Sgr B2 consists of three different regions: (1) the high-mass protoclusters Sgr B2(N) and Sgr B2(M) with density  , 2) a moderate density region extending to about 2.5 pc × 5.0 pc (or 60.7′′ × 121.3′′) around the hot cores with
  , and 3) a low-density envelope that extends to about 38 pc (or 15.4′) with
  (Hüttemeister et al. 1993, 1995; Schmiedeke et al. 2016). The gas temperature of the extended low-density envelope is about 65 K, and can be as high as several hundred K near Sgr B2(N) and Sgr B2(M) (Etxaluze et al. 2013). In contrast, the dust temperature is lower than the gas temperature: the extended envelope, Sgr B2(N), and Sgr B2(M) have Tdust of about 20, 28, and 34 K, respectively (Etxaluze et al. 2013).
Molecular species are mostly detected in the hot cores. For example, Belloche et al. (2013) have identified 56 species toward Sgr B2(N) and 46 species toward Sgr B2(M) with the IRAM 30 m telescope. However, emission distributions for some other COMs have been found to be extended over an arcminute scale, covering the region with low density and temperature (Jørgensen et al. 2020). This has been revealed for glycolaldehyde (CH2 OHCHO), propenal (C2 H3CHO), propanal (C2 H5CHO), cyclopropenone (c-H2 C3O), acetamide (CH3 CONH2), cyanoformaldehyde (CNCHO), ethanimine (CH3CHNH), and E-cyanomethanimine (HNCHCN) with GBT observations (Hollis et al. 2004a,b, 2006a,b; Remijan et al. 2008; Loomis et al. 2013; Zaleski et al. 2013), and for methanol (CH3OH), methyl cyanide (CH3CN), methyl acetylene (CH3CCH), formamide (NH2CHO), acetaldehyde (CH3CHO), and cyanodiacetylene (HC5N) with Mopra observations (Jones et al. 2008, 2011). Recently, Li et al. (2020) have performed a large-scale mapping of several COMs around Sgr B2 with the Arizona Radio Observatory (ARO) 12 m telescope. Based on the spatial distributions, glycolaldehyde (CH2 OHCHO), methyl formate (CH3 OCHO), formic acid (t-HCOOH), ethanol (C2 H5OH), and methylamine (CH3 NH2) can be classified as the “extended” molecules since they are distributed over several arcminutes around Sgr B2(N) and Sgr B2(M), while dimethyl ether (CH3 OCH3) and ethyl cyanide (C2 H5CN) can be classified as the “compact” molecules since they can only be detected near Sgr B2(N) and Sgr B2(M).
In addition to the extended region around Sgr B2, COMs have also been detected in other cold environments in the local ISM, such as pre-stellar cores (Bacmann et al. 2012; Vastel et al. 2014; Jiménez-Serra et al. 2016)or cold envelopes around low-mass protostars (Öberg et al. 2010; Cernicharo et al. 2012; Jaber et al. 2014; Bergner et al. 2017). Until recently the presence of COMs in the gas phase at low temperatures (≲ 10−30 K) has provided a puzzling challenge for astrochemical models. In astrochemistry, the relatively large amount of COMs in hot regions can be understood as follows. During the early stages of star formation, when the temperature is low, many atoms and molecules can be adsorbed on the grain surfaces. Then they can either thermally hop over the surface and react with each other to form more complex molecules via the Langmuir-Hinshelwood mechanism or can react more slowly inside bulk ice via radical chemistry driven by UV photons (Herbst & van Dishoeck 2009). Next, molecular ices can be desorbed back into the gas phase through either thermal desorption when the dust temperature becomes high enough or via non-thermal desorption processes, including UV-photodesorption, photodesorption driven by cosmic ray particles (Öberg et al. 2010; Cernicharo et al. 2012; Vastel et al. 2014), and reactive desorption driven by exothermic reactions (Garrod et al. 2007; Vasyunin & Herbst 2013b). In addition, shocks can strip ice mantles from dust grains and enrich the gas composition with COMs (Requena-Torres et al. 2006, 2008; Burkhardt et al. 2019). In addition, surface formation of COMs may proceed via the Eley-Rideal and van der Waals complex induced reaction mechanisms (Ruaud et al. 2015). In the so-called chain reaction mechanism, the products of radical-radical reactions on the grain surface can subsequently react with the species that lie right beneath without undergoing thermal diffusion, which can also drive COM chemistry (Chang & Herbst 2016). A similar mechanism in which the products of photodissociation on the grain surface can immediately react with other species nearby has also been proposed (Garrod 2019; Jin & Garrod 2020). Shingledecker et al. (2018) have suggested that the cosmic-ray bombardment of grain ice mantles can enhance production of COMs from simple ices under cold conditions. More recently, new gas-phase reactions that can produce COMs have been proposed, but they still invoke non-thermal desorption of the COM precursors (Balucani et al. 2015).
Although these mechanisms can explain why many COMs are observed toward Sgr B2(N) and Sgr B2(M) and in the cold extended region, it is not fully clear why CH3 OCH3 and C2 H5CN are deficient in the extended region, as shown by Li et al. (2020). For example, the higher abundance of CH3 OCH3 in comparison with CH3OCHO can be explained by different probabilities of reactive desorption upon their formation (aRRK, Garrod et al. 2007; Vasyunin & Herbst 2013b), by taking new gas-phase routes (Balucani et al. 2015), by the Eley-Rideal and the van der Waals complex induced reaction mechanisms (Ruaud et al. 2015), or by the chain reaction mechanism (Chang & Herbst 2016). Jin & Garrod (2020) have explored the impact of different non-thermal diffusion mechanisms to the formation of CH3 OCHO and CH3 OCH3 in their rate equation-based simulations. They have found that only models including three-body and excited three-body reactions (similar to the chain reaction mechanism; Chang & Herbst 2016) can reproduce higher abundance of CH3 OCHO with respect to CH3 OCH3, but detailed studies of this kind are lacking for other COMs.
In this paper we explore in detail under what physical conditions the chemical simulations can fit the distributions of seven COMs (CH2 OHCHO, CH3 OCHO, t-HCOOH, C2 H5OH, CH3 NH2, CH3 OCH3, and C2 H5CN) in Sgr B2 region. In Sect. 2 we describe the chemical models and the physical model grids for simulating the extended region of Sgr B2. In Sect. 3 we present the model results and the best-fit models compared with the observations. In Sect. 4 we discuss the reason why the best-fit models with some specific physical parameters can fit the observations, and how it occurs in Sgr B2. In Sect. 5 we present our conclusions.
2 Model
2.1 Chemical model
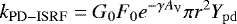
For the extended cold region of Sgr B2, non-thermal desorption must be very important to release COMs produced by surface chemistry into the gas phase. Since Sgr B2 is located nearby the Galactic center, the local UV radiation field should be strong enough to maintain a high photodesorption efficiency, hence the photodesorption mechanism is considered in all models. According to Öberg et al. (2009b) and Chang & Herbst (2014), the UV photodesorption rate coefficients induced by the interstellar radiation field and the cosmic ray particles are respectively
 (1)
(1)
and
 (2)
(2)
where G0 is the external UV radiation scaling factor with a value of 1 for the local ISM,  is the local UV radiation scaling factor induced by the CRPs with a value of 10−4 (Shen et al. 2004), and F0 is the interstellar UV radiation field with a value of 108 photons cm−2 s−1. We adopt different values of G0 and
  spanning four orders of magnitude. Table 1 lists these values, and more details are presented in Sect. 2.2. The exponential factor γ is a measure of the UV extinction relative to the visual extinction with a value of 2 (Roberge et al. 1991; Öberg et al. 2007), and r is the grain radius. The parameter Ypd is the photodesorption yield, and here it is calculated by Eqs. (4)–(6) described in Öberg et al. (2009a). These equations have been derived to describe photodesorption of H2O molecules, since water is the main component on the grain ices; however, we utilize these equations for all kinds of surface molecules in our model.
Other mechanisms that can lead to abundant COMs in the gas phase are also included. We adopt the chain reaction mechanism (Chang & Herbst 2016) in some simulations to investigate whether this mechanism can help us to fit the observations. We assume that all species produced by reactions on the grain can participate in this mechanism, not only the products of Langmuir-Hinshelwood reactions, but also the products of photodissociation and accretion. A similar mechanism for the products of photodissociation is included by Garrod (2019) in the simulations of ice chemistry in cometary nuclei, and the chain reaction mechanism of the products of accretion is in fact the Eley-Rideal mechanism. The products of Langmuir-Hinshelwood reactions, photodissociation, and absorption should affect the results differently through the chain reaction mechanism. Thus, three types of models are simulated, and each one considers only one particular type of product that can participate in the chain reaction mechanism. The fourth type of our model simulates all three types of products participating in the chain reaction mechanism. We also consider in a rough manner shock action in some chemical models by increasing the temperature within a short timescale characteristic of the shock passage. In addition, we consider an X-ray burst in some models by adopting much larger values of ζCR and  since it can ionize and dissociate species just like a large flux of cosmic ray particles. In addition to all these various processes, the reactive desorption is considered in our models with aRRK = 0.01, but we use some larger values (such as 0.1) for testing as well. Furthermore, the diffusion barrier Eb can strongly influence the Langmuir-Hinshelwood reactions. In our models the ratio of the diffusion barrier Eb to the desorption energy Ed is set to be 0.5. Some models are also simulated using a smaller value 0.3.
In this work the two-phase gas-grain model is used as the standard chemical kinetics model. We tried to use a three-phase model in our study, as suggested by Hasegawa & Herbst (1993) and Vasyunin & Herbst (2013a), as well as a multi-phase model, as suggestedby Lu et al. (2018) and Wang et al. (2019), but found that these sophisticated models cannot maintain enough COMs in the gas phase in all the considered cases. This is mainly because in multi-phase models COM ices are assumed to be trapped by many monolayers of the bulk water ice, and hence cannot efficiently desorb unless a grain is heated above ~ 100−150 K or stripped of ices by shocks. A recent laboratory study by Potapov et al. (2020) demonstrated that interstellar grains can be very porous and covered by just several monolayers of ice, thus challenging this widespread assumption. In the rest of this paper, we only discuss the results calculated by the two-phase model.
We combine the gas-grain chemical reaction network used by Belloche et al. (2014) and the network used by Wang et al. (2019) together to cover more COM species and COM reactions. As a result, the combined gas-grain chemical reaction network includes 9710 reactions and 947 species. In addition, we adopt the competition mechanism to calculate the reaction rates for the two surface reactions, CO + H → HCO and H2CO + H → H3 CO (Chang & Herbst 2012; Wang et al. 2019). The other parameters in the simulations are listed in Table 1 by Wang et al. (2019). The value of the sticking coefficient is set to be 1 as the standard value, instead of 0.5. The initial abundances that have been used to simulate the evolution of COMs are shown in Table 2 (e.g. Garrod 2013; Belloche et al. 2014, 2017; Garrod et al. 2017; Bonfand et al. 2019, etc.).
The macroscopic Monte Carlo method used by Wang et al. (2019) is utilized to simulate all these chemical kinetics models. The fractional abundance of a species is defined as the ratio of the population of the species to the total population of H nuclei. In each calculation, the minimum resolvable fractional abundance can only reach ~ 10−12 (Vasyunin et al. 2009; Wang et al. 2019). In order to reduce the stochastic fluctuation, we adopt Eq. (8) in Vasyunin et al. (2009) to calculate the average fractional abundances within chosen time steps. This method can also make the minimum resolvable fractional abundance several orders of magnitude lower than 10−12.
Main parameters considered in our modeling.
Initial abundances (Garrod 2013).
2.2 Physical model
In the simulations we adopt two types of simple physical models: a static model without any physical evolution, and a homogeneous one-point evolving model including two stages, a cold phase and a warm-up phase (Garrod & Herbst 2006; Garrod et al. 2008; Hassel et al. 2008, 2011; Garrod 2013; Wang et al. 2019). To investigate under what physical conditions the evolution of these seven COMs can fit the observations, we run a grid of models in which we adjust values of several key parameters. These parameters and their values are listed in Table 1, and the fiducial values are in boldface. The fixed gas Tgas and dust Tdust temperatures are used in the static models. The temperature in the cold phase of the evolving models is also fixed. In addition, the evolving models use the timescales of the cold phase tcold and warm-up phase twarmup as well as the maximum temperature reached at the end of the warm-up phase Tmax. We vary high-energy UV radiation field intensities χ and G0 by the same multiple compared to their smallest values. The same assumption is used to scale the cosmic ray ionization rate ζCR and the corresponding CRP-induced photodissociation and photodesorption rate  . Thus, we only discuss the changes of G0 and ζCR in the next sections. The fiducial value of nH, Tgas, Tdust, and G0 are derived from observations, while the fiducial value of AV, tcold, twarmup, and Tmax which can also guarantee to produce enough COMs (see Sect. 3), are suggested by Wang et al. (2019). For ζCR, if we adopt a high ζCR = 1−11 × 10−14 s−1 from the observations, it is difficult to preserve COMs in the gas phase for an extended time because of too strong ionization and dissociation (see Sect. 3), and it also makes our Monte Carlo simulations very time-consuming. Thus, a commonly used value ζCR = 1.3 × 10⁻¹⁷ s−1 is set to be the fiducial value. Hereafter we define fiducial model 1 as the static model with nH = 2 × 103 cm−3, AV = 10 mag, Tgas = 65 K, Tdust = 20 K, χ = 104, G0 = 104, ζCR = 1.3 × 10⁻¹⁷ s−1, and
  ; all these parameters remain constant. Similarly, fiducial model 2 is the evolving model with nH = 2 × 103 cm−3, AV = 10 mag, tcold = 3 × 10⁵ yr, twarmup = 2 × 10⁵ yr, Tmax = 200 K, χ = 104, G0 = 104, ζCR = 1.3 × 10⁻¹⁷ s−1, and
  . In addition, ttotal is labeled as the entire evolutionary time span in the simulations.
The homogeneous one-point evolving model is described in more detail by Garrod & Herbst (2006) (also see Garrod et al. 2008; Hassel et al. 2008, 2011; Garrod 2013; Wang et al. 2019), and hence only briefly outlined below. In this evolving model the values of nH, AV, G0, and ζCR are kept constant, and the gas and dust temperatures are assumed to be in equilibrium. In the cold phase the temperature T =10 K and the fiducial value of the timescale tcold = 3 × 10⁵ yr (Wang et al. 2019) are assumed. After the cold phase is over, the temperature during the warm-up phase at a time tcold + Δt is computed as given in Garrod & Herbst (2006) and Wang et al. (2019),
 (3)
(3)
where T0 = 10 K is the initial temperature at the beginning of the warm-up phase, Tmax is the maximum temperature at the end of the warm-up phase, Δt is the time during the warm-up phase, twarmup is the timescale of the warm-up phase, and n = 2 is the order of the heating (Garrod & Herbst 2006). Here we set twarmup = 2 × 10⁵ yr and Tmax = 200 K as the fiducial values according to Garrod & Herbst (2006) and Wang et al. (2019).
3 Results
In this section the fractional abundances of seven COMs, namely CH2OHCHO, CH3OCHO, t-HCOOH, C2 H5OH, CH3NH2, CH3OCH3, and C2 H5CN are modeled and discussed. The results of the static models and the evolving models are investigated in Sects. 3.1 and 3.2, respectively. In Sect. 3.3 we compare the simulations with the observations to find the best-fit model.
3.1 Simulations with the static models
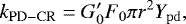
First of all,we verified whether gas-phase relative abundances of CH2OHCHO, CH3OCHO, t-HCOOH, C2 H5OH, and CH3NH2 can become higher than CH3OCH3 and C2 H5CN in the static models. As outlined in Table 1, we changed one key parameter for each static model, starting from fiducial model 1. Figure 1 shows the time-dependent evolution of the abundances of these seven COMs in the basic cases of the static models. In addition, Fig. 2 depicts the time-dependent evolution of these COMs in the more complex static models considering the chain reaction mechanism, the shock passage, the X-ray burst, a larger value of aRRK, or a smaller value of Eb on the basis of fiducial model 1.
3.1.1 Impact of various key parameters on the outcome of static chemical models
According to the median abundances from observations, the relative gas-phase abundances of CH3OCH3 and C2 H5CN are lower than 10−12, while the abundances of the other five COMs are higher than 10−11 (see Sect. 3.3). In fiducial model 1 (nH = 2 × 103 cm−3, AV = 10, Tgas = 65 K, Tdust = 20 K, G0 = 104, and ζCR = 1.3 × 10⁻¹⁷ s−1; see panel A in Fig. 1) only the abundances of CH3NH2 and C2 H5CN become higher than 10−11, while for t-HCOOH it can only reach 10−12, and for the other four COMs they are lower than 10−12. Therefore, only CH3NH2 and CH3OCH3 can match the observations while the other five COMs cannot, and these results cannot fit the observations as a whole. It can also be seen that, similar to fiducial model 1, all the other static models fail to fit the observations.
The static model with a higher density of nH = 2 × 104 cm−3 (panel B in Fig. 1) results in higher peak abundances of the considered COMs, but the differences disappear after 106 yr. It indicates that larger values of nH cannot make deficient gaseous COMs become abundant. This is also true for another static model with a higher density of nH = 2 × 105 cm−3 (panel C in Fig. 1); the gas-phase chemistry is mostly affected, while surface processes are not affected effectively.
For the models using extinction factors AV = 10, 50, and 1000 (panels A, D, and E in Fig. 1), the differences remain small, since the photodissociation rate remains similarly low when AV ≥ 10. For the more UV-irradiated cases with AV = 2 or 5, the abundances of all seven COMs become lower than 10−13, which means COMs are being quickly photodissociated (these two plots are not shown). Thus, AV = 10 is a reasonable value for preventing gaseous COMs from being photodissociated.
For the static model with Tgas = 10 K and Tdust = 10 K (panel F inFig. 1), only abundant gas-phase CH3NH2 can be produced most of the time. When a higher gas temperature of Tgas = 20 K or 100 K is utilized with a higher dust temperature Tdust = 20 K (panels G and H in Fig. 1), the results remain similar to fiducial model 1. Similarly, for the static model with Tgas = 65 K and Tdust = 30 K (panel I in Fig. 1), all considered COMs cannot be efficiently produced except for CH3NH2, whose abundance can reach 10−11, and C2 H5CN, whose abundance can reach 10−10 at ttotal ~ 106 yr. These four models indicate that dust temperature Tdust can affect the COM chemistry more strongly, whereas Tgas cannot, meaning that only surface reactions play a key role in producing COMs, not gas-phase reactions.
The results from the static model using G0 = 1 (panel J in Fig. 1) are similar to those from fiducial model 1 using G0 = 104 because thecorresponding physical conditions are assumed to be “dark,” with AV ≥ 10. In the cases with the higher cosmic ray ionization rates of ζCR = 1.3 × 10⁻¹⁶ s−1 and 1.3 × 10⁻¹⁵ s−1 (panels K and L in Fig. 1), the higher the value of ζCR, the lower the abundances of these seven COMs. For the cases when even higher cosmic ray ionization rates of ζCR= 1.3 × 10⁻¹⁴ s−1 and 1.3 × 10⁻¹³ s−1 are considered, all seven COM abundances are lower than 10−12 due to too enhanced ionization and dissociation (these two plots are not shown).
In summary, the abundances of COMs in the static models are mainly influenced by AV, Tdust, and ζCR. The strength of the local ambient FUV radiation field G0 can influence the results only if visual extinction AV is low. The variations in gas density nH and temperature Tgas also do not strongly affect the outcome of the static models.
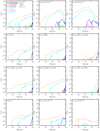 |
Fig. 1 Time-dependent evolution of the relative gas-phase abundances of CH2OHCHO, CH3 OCHO, t-HCOOH, C2H5OH, CH3 NH2, CH3 OCH3, and C2 H5CN in static models. Fiducial model 1 assumes nH = 2 × 103 cm−3, AV = 10, Tgas = 65 K, Tdust = 20 K, G0 = 104, and ζCR = 1.3 × 10⁻¹⁷ s−1. Other staticmodels use different values of each of these parameters at a time. |
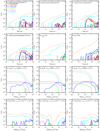 |
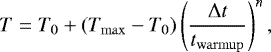
Fig. 2 As in Fig. 1, but adopting additional mechanisms on the basis of fiducial model 1. In panels A–C the chain reaction mechanism for the products of Langmuir-Hinshelwood reactions, photodissociation, and adsorption is considered, respectively. In panel D the chain reaction mechanism for all three types of products is considered. In panel E aRRK = 0.1 is used. In panel F Eb = 0.3Ed is used. In panels G–L the abscissae start with the abundances at ttotal = 106 yr in fiducial model 1, which correspond to ttotal − 106 yr. In panels G–I a case with a shock is considered, assuming peak temperatures of Tpeak = 200 or 1000 K, and shock duration of t = 102 or 104 yr. In panels J–L a case with an X-ray burst is considered, which is described in the models by the elevated cosmic ray ionization rate ζCR = 1.3 × 10⁻¹⁴ s−1 or 1.3 × 10⁻¹³ s−1 during a short timescale of t = 102 or 104 yr, respectively.After the shock or the X-ray burst, all parameters are assumed to be the same as in fiducial model 1. |
3.1.2 Impact of more exotic mechanisms on the outcome of static chemical models
Since the results of the static models with photodesorption and reactive desorption cannot fit the observations, we consider several additional models that adopt the chain reaction mechanism, a shock passage, an X-ray burst, a larger value of aRRK, or a smaller value of Eb (on the basis of fiducial model 1). Figure 2 depicts the time-dependent evolution of the relative abundances in these models.
The static models that consider the chain reaction mechanism for the products of Langmuir-Hinshelwood reactions, photodissociation, and adsorption are respectively labeled chain reaction mechanism A, B, and C (panels A, B, and C in Fig. 2). The static model that considers that all products of these three types of processes can participate in the chain reaction mechanism is labeled chain reaction mechanism A+B+C (panel D in Fig. 2). All seven COM abundances are a little higher than fiducial model 1. However, only the abundance of t-HCOOH in the case of chain reaction mechanism A, the abundances of CH2OHCHO and CH3OCHO in the case of chain reaction mechanism C, and the abundances of CH2OHCHO, CH3OCHO, and t-HCOOH in the case of chain reaction mechanism A+B+C can reach detectable levels of ~ 10−11, while the abundance of C2 H5OH remains lower than 10−12 in all four models. Thus, the addition of the chain reaction mechanism cannot solve the problem.
For the static model where the probability of reactive desorption aRRK = 0.1 (panel E in Fig. 2) is assumed to be ten times higher than the fiducial value 0.01, the enhanced reactive desorption increases the abundances of t-HCOOH, C2 H5OH, CH3NH2, CH3OCH3, and C2 H5CN. However, only the abundances of CH3NH2 and C2 H5CN become higher than 10−11, while the abundances of the other COMs are still lower than 10−12.
For the static model where lower diffusion barriers with Eb = 0.3Ed (panel F in Fig. 2) are assumed, the efficiency of Langmuir-Hinshelwood reactions is enhanced. In this case the abundance of C2 H5CN decreases to 10−11, while the abundances of the other six COMs increase. The abundances of t-HCOOH, C2 H5OH, and CH3OCH3 become about 10−11, while for CH2OHCHO and CH3OCHO they are nearly 10−12.
Next, we consider a static model with a shock that occurs at ttotal = 106 yr (keeping the rest of the parameters in fiducial model 1). We designate the peak temperature that can be reached during the shock as Tpeak, and the timescale of the shock passage as t. For simplicity, the gas and dust temperature both reach the same Tpeak of 200 or 1000 K during the shock, and the shock lasts for 102 or 104 yr (panels G–I in Fig. 2). The onset of the shock is set to be the initial time 0 on the abscissae in panels G–I in Fig. 2. The results of these models are similar, which indicates that the exact value of the temperature in the shock between 200 and 1000 K is not important, and that the timescale of the shock passage between 102 and 104 yr is also not that important. The main reason is that the higher temperatures above 200 K during the shock passage lead to almost instantaneous evaporation of almost all ices (at much shorter timescale than 102 yr), while simultaneously increasing efficiency of gas-phase reactions (important mainly for simple molecules). The resulting abundances of t-HCOOH, C2 H5OH, and CH3OCH3 can reach ~10−11, while the abundances of CH3NH2 and C2 H5CN can become as high as 10−8 for about 104 yr after the shock passage. After that, COM abundances decrease due to freeze out and become lower than 10−11. However, even in this case the abundances of CH2OHCHO and CH3OCHO remain too low.
Finally, we consider a case with an X-ray burst that can be simulated in our modeling by enhancing the cosmic ray ionization rate to higher values of 1.3 × 10⁻¹⁴ s−1 or 1.3 × 10⁻¹³ s−1. We again assume that such a burst occurs at ttotal = 106 yr in fiducial model 1 and lasts for 102 or 104 yr. The corresponding results are shown in panels J–L in Fig. 2. The relative gas-phase abundances of CH3NH2 and C2 H5CN become lower compared to those in fiducial model 1 due to enhanced ionization and dissociation, and the abundances of the other five COMs are still lower than 10−12.
We conclude that the Monte Carlo chemical simulations based on static physical conditions cannot reliably fit the observations. The results are also hardly influenced when considering more exotic scenarios with a shock passage or an X-ray burst since they are mainly determined by the chemical evolution prior to these temporal phenomena.
3.2 Simulations with the evolving models
Since the static models failed to fit the observations, we ran a number of evolving chemical models by including a cold phase and a warm-up phase to simulate the abundances of the seven COMs observed in Sgr B2.
3.2.1 Impact of various key parameters on the outcome of evolving chemical models
Similar to the static models, we changed one parameter each time starting from fiducial model 2 according to Table 1, and discuss the results. Figure 3 shows the time-dependent evolution of the relative gas-phase abundances of these seven COMs in evolving models. Only the warm-up phase is shown because in the cold phase the evolution is similar to the static model using Tgas = 10 K and Tdust = 10 K. Overall, the evolution trends in over one-half of the calculated models are similar.
The results of fiducial model 2 (nH = 2 × 103 cm−3, AV = 10, tcold = 3 × 10⁵ yr, twarmup = 2 × 10⁵ yr, Tmax = 200 K, G0 = 104, ζCR= 1.3 × 10⁻¹⁷ s−1) are depicted in panel A in Fig. 3. At the start of the warm-up phase, all seven COM abundances are still very low. The abundances of CH2OHCHO, CH3OCHO, t-HCOOH, and C2 H5CN start to increase rapidly at T ~ 25 K; the abundances of C2 H5OH and CH3OCH3 start to increase at T ~ 20 K; and the CH3NH2 abundance starts to increase at T ~ 16 K. All seven COM abundances remain relatively stable when T < 60 K. After that the abundances of CH2OHCHO and CH3OCHO decrease, the abundance of CH3OCH3 increases again to reach the peak abundance at T ~ 60 K and then decreases, while for t-HCOOH, C2 H5OH, CH3NH2, and C2 H5CN the abundances increase again to reach their peak values at different T ~ 100 K (and then they decrease). The peak abundances are caused by the evaporation of the COMs from the grain surfaces. In essence, the abundances of CH2OHCHO, CH3OCHO, t-HCOOH, C2 H5OH, and CH3NH2 are higher than the abundances of CH3OCH3 and C2 H5CN when the temperature reaches ~30−40 K, and then they fit the observations reasonably well. When temperatures are higher, T ~ 40−60 K, the abundance of C2 H5CN is about two times higher than that of CH3OCHO, but the overall results can still fit the observations (see Sect. 3.3 below). However, the derived best-fit temperature is a little higher (~37 or 57 K, see Sect. 3.3) in comparison with the observed dust temperature of 20 K in the extended region of Sgr B2.
When different gas densities are considered, namely nH = 2 × 104 cm−3 and 2 × 105 cm−3 (panels B and C in Fig. 3), all seven COM abundances increase and the t-HCOOH, CH3NH2, and CH3OCH3 abundances become higher in comparison with the observations.
For the darker models using AV = 50 and 1000 (panels D and E in Fig. 3), seven COM abundances become a little lower when T ~30−60 K than those in fiducial model 2. After that, at higher temperatures when these molecules are evaporated from grains, the abundances of t-HCOOH, C2 H5OH, CH3OCH3, and C2 H5CN decrease, but the abundances of CH2OHCHO, CH3OCHO, and CH3NH2 increase compared to fiducial model 2. In more FUV irradiated cases when AV = 2 or 5, all seven COM abundances remain lower than 10−13due to a too high intensity of photodissociation (and hence these two plots are not presented). It seems that AV = 10 is a reasonable value, as we found for the static models.
The model using a shorter duration of the cold phase tcold = 105 yr (panel F in Fig. 3) has lower COM abundances in the warm-up phase, while the model with a longer duration of the cold phase tcold = 106 yr (panel G in Fig. 3) has higher COM abundances in the warm-up phase, except for C2 H5CN (compared to those in fiducial model 2). It indicates that a longer timescale of the cold phase tcold can help to produce more key precursors of these COMs before the onset of the warm-up phase. However, the overproduction of t-HCOOH, CH3NH2, and CH3OCH3 in the longer cold-phase model with tcold = 106 yr results in a worse fit to the observations (see Sect. 3.3). The COM abundances in the models with other values of the cold-phase duration lie between these two extremes, and the discrepancies are insignificant compared to the results of fiducial model 2. Thus, we conclude that a moderately long cold-phase duration tcold ~ 3 × 10⁵ yr is necessary for attaining a good fit to the Sgr B2 observations.
Next, we adopt four different values for the duration of the warm-up phase twarmup. The results for the model with twarmup = 104 yr (panel H in Fig. 3) are very different from those in fiducial model 2. The abundances of CH2OHCHO and CH3OCHO become higher than the abundances of the other five COMs, and both increase when T ~ 100 K because of the evaporation. Similarly, in the model with the warm-up duration of 5 × 10⁴ yr (panel I in Fig. 3), the CH2OHCHO and CH3OCHO abundances continue to increase at higher temperatures compared to their values at T ~ 30−60 K due to more efficient thermal desorption (all the way up to ~100 K). In contrast, abundances of these two species decrease at T ~ 50 K in the models with longer duration of the warm-up phase, 5 × 10⁵ and 106 yr (panels J and K in Fig. 3). Due to the short timescale of 104 yr, the CH2OHCHO and CH3OCHO molecules produced on the grains are not destroyed by OH radicals when T ~50 K (see Sect. 4.1) before their evaporation, thus the evaporated CH2OHCHO and CH3OCHO molecules can increase their abundances again when T ~ 100 K. In the model using a longer timescale of 5 × 10⁴ yr, the longer duration at T ~ 50 K already induces more CH2OHCHO and CH3OCHO molecules on the grains to be destroyed by OH radicals, so their abundances in the gas-phase increase only a little when T ~100 K. For even longer timescales of 2 × 10⁵ yr, 5 × 10⁵ yr, and 106 yr, the duration at T ~50 K is long enough to destroy most CH2OHCHO and CH3OCHO molecules on the grains, and these molecules in the gas-phase are destroyed by C+ (see Sect. 4.1), so the decreased curves occur when T > 50 K. The abundances of other five COMs also decrease more strongly at higher temperatures (T > 100 K) in these two models using twarmup = 5 × 10⁵ and 106 yr compared tofiducial model 2. The longer duration of the warm-up phase, while allowing COMs to be desorbed into the gas phase, also leads to more efficient destruction of these COMs through the ion-molecule reactions (see Sect. 4.1). Hence twarmup should be longer than 5 × 10⁴ yr and should not be too long, since long timescales of twarmup can induce more ion-molecule reactions to destroy these COMs in the gas-phase, although it is not obvious in the models using twarmup = 5 × 10⁵ and 106 yr. A moderate value of around 2 × 10⁵ yr is a good choice, and it is better not to deviate from this value too much.
In panel L in Fig. 3, the results for the model with linear slope of the warm-up power law are shown. They are similar to fiducial model 2 with a steeper quadratic warm-up power law if we set the same temperature intervals on the abscissa. This implies that the temperature values are more significant for the chemistry than the pace of the warm-up process.
Next, we consider three models with different maximum temperature values Tmax of 50, 100, and 1000 K (panels M, N, and O in Fig. 3). Similarly to the case with a linear warm-up rate, if we set the same temperature intervals on the abscissa the evolution curves in these model look similar to those in fiducial model 2. Hence, the maximum temperature Tmax at the end of the warm-up phase is not that important if it is higher than 50− 100 K.
The model with a lower FUV radiation field of G0 = 1 (panel P in Fig. 3) leads to lower COM abundances at T ~30−60 K; higher peak abundances of CH2OHCHO, CH3OCHO, and CH3NH2; and lower peak abundances of t-HCOOH, C2 H5OH, CH3OCH3, and C2 H5CN compared to fiducial model 2, which contradicts the observations. For the models using G0 = 10, 100, and 1000, their results are similar to the model using G0 = 1 (these plots are not shown). Thus, the high intensity of the UV-photodissociation and photodesorption are needed, with G0 ≈ 104.
In the evolving model with a higher cosmic ray ionization rate ζCR = 1.3 × 10⁻¹⁶ s−1 (panel Q in Fig. 3), the results at T ~ 30−60 K are similar to those in fiducial model 2. At later times (and higher temperatures) all seven COM abundances decrease more rapidly due to enhanced ionization and dissociation. In the model with even higher ζCR = 1.3 × 10⁻¹⁵ s−1 (panel R in Fig. 3), all COM abundances are lower than 10−11, and for the extreme ionization models with ζCR = 1.3 × 10⁻¹⁴ s−1 and 1.3 × 10⁻¹³ s−1, the COM abundances are lower than 10−13 (these two plots are not shown). Thus, the cosmic ray ionization rate ζCR should not be very high on long timescales, at most several times higher than 1.3 × 10⁻¹⁶ s−1.
To conclude, AV and ζCR can affect the results dramatically, nH and G0 can influence the results to some extent, while Tmax is not that important. Timescales of the cold and warm-up phase, tcold and twarmup, are also not influential if moderate values are selected, such as tcold = 3 × 10⁵ yr and twarmup = 2 × 10⁵ yr.
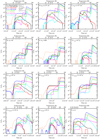 |
Fig. 3 Time-dependent evolution of the relative gas-phase abundances of CH2OHCHO, CH3 OCHO, t-HCOOH, C2H5OH, CH3 NH2, CH3 OCH3, and C2 H5CN in the warm-up phase in evolving models. Fiducial model 2 adopts nH = 2 × 103 cm−3, AV = 10, tcold = 3 × 10⁵ yr, twarmup= 2 × 10⁵ yr, Tmax =200 K, G0 = 104, ζCR = 1.3 × 10⁻¹⁷ s−1. Other evolving models adopt a different value of each of these parameters at a time. In panel L, a linear rather than a quadratic warm-up rate is used in Eq. (3) (n = 1). |
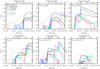 |
Fig. 3 continued. |
3.2.2 Impact of more exotic mechanisms on the outcome of evolving chemical models
Although in some evolving models the abundances of CH2OHCHO, CH3OCHO, t-HCOOH, C2 H5OH, and CH3NH2 are higher than the abundances of CH3OCH3 and C2 H5CN when T ~ 30−60 K, all seven COM abundances cannot fit the observed values at the same time moment (see Sect. 3.3). Moreover, the observed dust temperature is also lower than the dust temperature in the evolving models with COM abundances closest to the observed values. To try to achieve a better, more physically correct best fit with a dust temperature of 20 K, we also consider several additional evolving models by considering more exotic mechanisms and parameter values, namely larger values of aRRK, a smaller value of Eb, a shock passage, or an X-ray burst (based on fiducial model 2). The time-dependent evolution of the relative COM gas-phase abundances in these models are shown in Fig. 4.
In the model without reactive desorption (aRRK = 0, panel A in Fig. 4), all seven COM abundances are low and only the relative abundances of t-HCOOH and CH3NH2 can reach 10−12 at T ~20−60 K. This indicates the significance of the reactive desorption for producing enough COMs in the gas phase when thermal evaporation does not work. In the models with aRRK = 0.05 and 0.1 (panels B and C in Fig. 4), the differences in the COM abundances with those in fiducial model 2 are subtle. Thus, the efficiency of the reactive desorption with a reasonable value aRRK = 0.01 is required to fit the observations.
In the model with a lower diffusion barrier Eb = 0.3Ed (panel D in Fig. 4), the abundances of CH2OHCHO and CH3NH2 increase, while the abundances of t-HCOOH and CH3OCH3 decrease slightly at T ~ 30−60 K and produce a better fit to the observations than fiducial model 2 (see Sect. 3.3). Thus, the ratio of Eb to Ed is an important parameter, and is likely ~0.3−0.5, as derived in laboratory experiments (Cuppen et al. 2017).
Next, we consider an evolving model with a shock (based on fiducial model 2). The shock passage is assumed to start when T = 10 or 20 K (at ttotal = 3 × 10⁵ or 3.459 × 10⁵ yr) in the warm-up phase, the peak temperature during the shock passage is Tpeak = 200 or 1000 K, and the shock passage lasts t = 102 yr (panels E-H in Fig. 4). After the shock all parameters return to the same values as in fiducial model 2. In the model with the shock happening at T =10 K and with Tpeak = 200 K (panel E in Fig. 4), the abundance of t-HCOOH becomes higher when T < 25 K and then lower when T > 25 K, but CH3NH2 becomes higher when T < 100 K and then lower when T > 100 K in comparison with fiducial model 2. The abundances of the other five COMs change insignificantly. In the case when the shock happens at T =10 K but with higher Tpeak = 1000 K (panel F in Fig. 4), the abundances of CH2OHCHO, CH3OCHO, and CH3OCH3 become higher, but the abundances of t-HCOOH, CH3NH2, and C2 H5CN become lower compared to the results of fiducial model 2 when T > 30 K. In the models where the shock passage occurs later at T =20 K (panels G and H in Fig. 4) CH3NH2 is overproduced, while the abundances of CH2OHCHO and CH3OCHO are lower than 10−12. The longer timescales of the shock (t = 103 or 104 yr) are also simulated, and their results are similar to the short duration shock passage model using t = 102 yr (these plots are not shown). Therefore, the models with an early shock passage when T =10 K can fit the COM observations in Sgr B2 at a later moment, when T ~ 30−60 K. However, these models cannot reproduce the observations at a more feasible temperature T =20 K (see Sect. 3.3).
Finally, we consider evolving models with an X-ray burst instead of a shock. The outburst also begins early, when T = 10 or 20 K, and leads to temporarily high ionization rates of ζCR = 1.3 × 10⁻¹⁴ s−1 or 1.3 × 10⁻¹³ s−1 (panels I–L in Fig. 4). The duration of the X-ray burst is short, t = 102 yr. The differences between computed COM abundances of these X-ray burst models with the burst onset at T = 10 K (panels I and J in Fig. 4) and the results of fiducial model 2 are small. In contrast, in the case when such an X-ray burst occurs later, at T = 20 K (panels K and L in Fig. 4), more C2 H5OH but less CH3NH2 and CH3OCH3 are produced at T = 20−30 K compared with the outcome of fiducial model 2. This makes the modeling results fit the COM observations in Sgr B2 at more realistic dust temperatures T < 30 K (see Sect. 3.3). The longer timescales of the X-ray burst lead to worse fits due to excessive COM destruction (these plots are not shown).
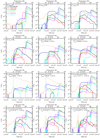 |
Fig. 4 As in Fig. 3, but adopting additional mechanisms on the basis of fiducial model 2. In panels A–C three cases with aRRK = 0, 0.05, and 0.1 are considered, respectively. In panel D a case with faster diffusion rates Eb = 0.3Ed is considered. In panels E–H a scenario with a shock passage is considered, where T = 10 and 20 K represent the temperature when the shocks occurs in the warm-up phase (ttotal = 3 × 10⁵ yr and 3.459 × 10⁵ yr, respectively). Peak temperatures Tpeak = 200 and 1000 K are the temperatures during shock passage, and t = 102 yr is the duration the passage. In panels I–L a scenario with an X-ray burst is considered, which is described in the models by the elevated cosmic ray ionization rate of ζCR = 1.3 × 10⁻¹⁴ s−1 and 1.3 × 10⁻¹³ s−1, T = 10 and 20 K, and the X-ray burst duration is t = 102 yr. After the shock passage and the X-ray burst, all parameters are the same as in fiducial model 2. |
3.3 Comparison with observations
The “mean confidence level” method (Garrod et al. 2007; Hassel et al. 2008; Wang et al. 2019) was adopted to compare the simulations of several evolving models with the observations to quantify the best-fit value of each model. In this method, for species j the confidence level κj is defined as the agreement between the abundance Xj in the simulation and the observation Xobs,j, which is calculated by
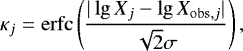 (4)
(4)
where erfc is the complementary error function and σ = 1 is the standard deviation. Thus, the value of κj lies between 0 and 1, and the larger the κj value, the better agreement between the simulations and the observations. To quantify the global agreement, the average κ for all seven COMs is calculated. Furthermore, the maximum of the average κ can be obtained;the specific time, the temperature, and the number of fits (which is the number of species that can fit the observations) can also be obtained.
Table 3 shows the comparison of the simulations of several evolving models with the observationsin the extended region of Sgr B2. For each species, if its abundance is higher than the upper limit or lower than the lower limit, the simulation of this species cannot fit the observation. We consider both the value of κ and the number of fits to evaluate the best agreement of model with the data.
For fiducial model 2, two agreement values are presented, κ = 0.473 when T =36.8 K and κ = 0.565 when T =57.2 K. In both these cases, observations of six COMs can be fitted well, except for t-HCOOH which remains overproduced. However, despite such a reasonable agreement, the best-fit dust temperatures are higher than the observed value of about 20 K. Other models also show two best-fit cases, when T ~ 30 K and T ~60 K, respectively. Only the agreement of the maximum κ is listed in Table 3. Most of these models cannot fit the observations better than fiducial model 2.
In the models with different “usual” key parameters (nH, AV, tcold, twarmup, Tmax, G0, or ζCR), the number of fitted COM abundances can reach six in about half of the 17 models, while most values of κ in these models are larger than that in fiducial model 2. Even so, the best-fit abundances in these models occur at T ~50 K, which is higher than the observed dust temperature. In the other half of these models, the number of fitted COM abundances is less than six, so they deviate from the observations farther than fiducial model 2. Thus, these 17 models cannot fit the observations better than fiducial model 2. In the models with aRRK = 0, 0.05, 0.1, and Eb = 0.3Ed, the overall agreement is as mediocre as it is in the17 models. Thus, adopting different key parameters cannot much improve the agreement with the observations at T < 30 K.
In the models with a shock, if it happens early when T = 10 K, the agreement with observations also does not improve. If the shock occurs when T = 20 K, the results become worse and still cannot fit the observations because of the underproduction of CH2OHCHO, CH3OCHO, and C2 H5OH, and the overproduction of CH3NH2 and CH3OCH3. Thus, an addition of a shock to the evolving model does not help to improve its feasibility.
Finally, the models with an early X-ray burst at T = 10 K still cannot fit all seven COMs at the same time. Only the models with an X-ray burst at a later time moment, when T = 20 K and the effective ionization rate becomes ζCR = 1.3 × 10⁻¹⁴ s−1, while the X-ray burst duration is t = 103 yr or when ζCR = 1.3 × 10⁻¹³ s−1 and t = 102 yr can fit all seven COMs at the same time moment when T ~ 28 K. The corresponding agreement value κ is 0.622 and 0.676, respectively. Thus, by considering an extra X-ray burst when T = 20 K in the warm-up phase with a short timescale, a good fit to the COM observations in Sgr B2 can be achieved. We conclude that in the framework of the present study, we achieve the best agreement with the observations with the evolving model with the following parameters: nH = 2 × 103 cm−3, AV = 10, tcold = 3 × 10⁵ yr, twarmup = 2 × 10⁵ yr, Tmax = 200 K, G0 = 104 with an X-ray burst at T = 20 K (ttotal = 3.459 × 10⁵ yr), effective ionization rate ζCR = 1.3 × 10⁻¹³ s−1 and t = 102 yr.
4 Discussions
4.1 Importance of reactive desorption
Since only the results in the warm-up phase in the evolving models can fit the observations, we need to figure out how these COMs are produced. In fiducial model 2, when T ~ 30−60 K, the key mechanism for producing these COMs is the reactive desorption due to the exothermic reactions on the grain surfaces. The most important reactions are listed below:
Here the letter J represents species on the grain. These COMs are mainly destroyed by the ion-molecule reactions in the gas which are listed below:
Here C+ is the key species that destroys them. The products of these reactions react with e− and produce multiple smaller molecules, which cannot be re-assembled into COMs in the gas phase. The relatively high abundances of CH2OHCHO, CH3OCHO, t-HCOOH, C2 H5OH, and CH3NH2 and low abundances of CH3OCH3 and C2 H5CN are mainly determined by the reactive desorption.
The importance of the reactive desorption for the gas-phase abundances of the seven COMs can be explained as follows. Reactions 5–17 belong to the Langmuir-Hinshelwood formation mechanism, and the reaction rates are mainly determined by the diffusion rates of radicals, especially the ones with lower Eb (or Ed). The evaporation temperatures of JHCO, JCH3, JH, and JCN are about 26, 20, 8, and 26 K, respectively, according to their desorption energies Ed. Reactions 5–7 should be highly efficient when T ~ 26 K because of the high diffusion rate of JHCO. They produce CH2OHCHO, CH3OCHO, and t-HCOOH rapidly. The abundance of JOH is higher than that of JCH2OH and JCH3O, because it is easier for JH to react with JO and produce JOH than to react with JCO, JHCO, and JCH2O and produce more complex ices JCH2OH and JCH3O. This leads to the overall higher abundance of t-HCOOH compared to the other six larger COMs. JCH3OH can be photodissociated by the UV photons to produce JCH2OH and JCH3O, but the efficiency for producing JCH2OH is five times higher than the efficiency for producing JCH3O. Thus, the abundance of JCH2OH is larger than JCH3O and results in more abundant CH2OHCHO and less abundant CH3OCHO molecules. Similarly, the increase in C2 H5OH and CH3OCH3 abundances when T ~ 20 K is associated with the high diffusion rate of JCH3 in reactions8 and 13 and with the higher abundance of JCH2OH leads to more C2 H5OH molecules, while the lower abundance of JCH3O results in fewer CH3OCH3 molecules. In addition, reaction 9 can also increase the abundance of C2 H5OH slightly. According to reactions 6 and 13, the lower abundance of JCH3 radicals compared to JHCO radicals leads to the lower abundance of CH3OCH3 compared toCH3OCHO, which also makes the abundance of CH3OCH3 the lowest of all seven COMs. For CH3NH2, reactions 10 and 11 can be efficient when T ~ 8 K, so CH3NH2 can be produced in the cold phase and hence also in the static models. However, the low abundances of JCH2NH2 and JCH3NH molecules prevent CH3NH2 from being produced efficiently. When T ~ 20 K, the high diffusion rate of JCH3 in reaction 12 leads to the increase in abundance of CH3NH2. For C2 H5CN reaction 14 is significant if T ~ 26 K, when the high diffusion rate of JCN leads to the increased production of C2 H5CN. In addition to the ion-molecule reactions with C+, reaction 28 can decrease the abundance of C2 H5CN slightly to maintain its relatively low abundance. Therefore, the relatively high abundances of CH2OHCHO, CH3OCHO, t-HCOOH, C2 H5OH, and CH3NH2 and low abundances of CH3OCH3 and C2 H5CN can be obtained when T ~ 30−40 K.
Since CH2OHCHO, CH3OCHO, and t-HCOOH are produced efficiently after the temperature exceeds about 26 K, it is difficult to fit the observations of COMs when the measured dust temperature is lower (~ 20 K). At higher temperatures (T > 60 K), t-HCOOH, C2 H5OH, CH3NH2, CH3OCH3, and C2 H5CN abundances reach their peak abundances due to thermal evaporation. However, CH2OHCHO and CH3OCHO abundances decrease because the radical JOH begins to react with JCH2OHCHO and JCH3OCHO when T ~ 50 K, which leads to their destruction and prevents their evaporation from increasing the abundances in the gas-phase. In addition, the ion-molecule reactions in the gas-phase destroy CH2OHCHO and CH3OCHO molecules todecrease their abundances. These reactions also become important when the temperature is high, so all seven abundances decrease at the end of the warm-up phase. Thus, the COM abundances representative of the observations are obtained when T ~ 30−60 K in the models without an extra X-ray burst.
It is clear from the above analysis of the importance of reactive desorption that the simulations of the static models cannot fit the observations. If Tdust = 20 K, then JCO and JCH3 evaporate, while more complex radicals (JC2OH, JCH3O, JHCO, and JC2H5O) are not produced efficiently, such that the abundances of CH2OHCHO, CH3OCHO, t-HCOOH, C2 H5OH, and CH3OCH3 remain very low. Only CH3NH2 and C2 H5CN can be produced through reactions 10, 11, and 14 and become abundant in the gas phase due to reactive desorption. Considering other mechanisms cannot solve the problem fundamentally.
In the evolving models, the parameters that can enhance the reaction rates of reactions 5–17 may result in better fits compared to the observations. This explains why the impact of different values of nH, tcold, twarmup, and Tmax is negligible. The value of AV must be larger than 10 mag, otherwise these COMs and their large precursor radicals are too strongly photodissociated by the UV photons. At the dark conditions with AV ≥ 10, the unattenuated FUV intensity G0 is not that important to the simulations if it is lower than ~104. Similarly, the cosmic ray ionization rate ζCR should be less than ~10−15 s−1 on long timescales to avoid from destroying these COMs by cosmic ray ionization and dissociation, which is consistent with the derived values from chemical simulations for the hot cores in Sgr B2(N) (Bonfand et al. 2019; Willis et al. 2020). The larger value of aRRK (0.05 or 0.1) allow more COMs to reach the gas phase, but CH3NH2 and CH3OCH3 abundances are overproduced. Thus, aRRK = 0.01 is a reasonable value. The lower Eb can enhance the diffusion rates, leading to more efficient surface chemistry, higher COM ice abundances and a better agreement with the observations. The diffusion and binding energies for complex ices are poorly known and require more laboratory studies to help to improve the results of astrochemical models, including this study.
During a shock passage, gas and dust temperatures can temporarily reach high values. If it happens when T = 10 K, all ices on the grain evaporate, shortening the surface chemistry efficiency. Most of the complex molecules are destroyed by ion-molecule reactions before freezing out back to the grain surfaces. Most radicals are adsorbed on the grain surface intact after the shock passage, but the COMs produced from them later cannot easily reach the gas phase. However, if a shock happens at a later time when T = 20 K, t-HCOOH, C2 H5OH, CH3NH2, CH3OCH3, and C2 H5CN abundances increase rapidly during its passage. The last four can be produced efficiently through reactions 8, 12, 13, and 15 on the grains and then become evaporated during the shock, while t-HCOOH can be partly produced through the gas-phase reactions. CH2OHCHO and CH3OCHO take longer to produce in sufficient amounts on the dust surfaces, and the lack of JCH2OH, JCH3O, and JHCO after the shock passage blocks production of these two COMs through reactions 5 and 6. This explains why models with a shock cannot explain the observations.
An X-ray burst can enhance ionization and dissociation reactions, like those produced by cosmic rays, and can increase non-thermal desorption. If it happens early, when T = 10 K, its impact can be ignored since surface chemistry has no time to produce abundant COMs ices. If it happens later, when T = 20 K, the photodesorption induced by the X-rays increases the gas-phase abundances of all COMs immediately, but later leads to their destruction in the gas via ion-molecule reactions. This mechanism leads to peak COM gas-phase abundances that are achieved shortly after the onset of the burst, and they decrease afterwards. After the X-ray burst ends, the COM abundances decrease slightly when T ~ 30 K. The reason is that the radicals on the grain surfaces producing these COMs become dissociated during the X-ray burst, which thus suppresses the production of COMs at later times. This is the scenario that shows the best agreement between our models and the Sgr B2 observations.
Observed and simulated fractional abundances of the seven COMs in the extended region of Sgr B2.
4.2 Origin of the chemical differentiation of COMs
The X-ray flare released by the supermassive black hole Sgr A* at the center of the Milky Way has been observed (Baganoff et al. 2001; Marrone et al. 2008; Rea et al. 2013; Churazov et al. 2017), presumably created by the accretion of gas onto the black hole. It probably occurred about 100 yr ago (Churazov et al. 2017). Such a flare could be multiple, shorter-duration flares superposed on a long-term high state, since two short-term flares of 5–10 yr have been found (Ryu et al. 2013). The X-ray echo from Sgr B2 has also been observed (Terrier et al. 2010; Nobukawa et al. 2011), which indicates that the region around Sgr B2 can be continuously affected by the X-ray flares from Sgr A*. The abundances of two organic molecules CH3OH and H2 CO can be enhanced by the X-ray irradiation from Sgr A*, which has been simulated by Liu et al. (2020). Combining our simulations with the observations, a possible explanation for the chemical differentiation in the extended region around Sgr B2 is proposed.
The extended region around Sgr B2 underwent a cold phase with T ≤ 10 K for 105−106 yr and then a warm-up phase began due to the star formation. When the temperature reached roughly T ~ 20 K, a short-term X-ray flare lasting no more than 100 yr from Sgr A* occurred and affected the region. It enhanced the high-energy ionization and dissociation rates, as well as high-energy-driven desorption and induced photodesorption, while simultaneously heating the gas up to temperature of 65 K. The X-ray and UV photons produced near the Galactic center would be the major heating agent. After the flare ended, the dust temperature continued to rise to about 27 K because of the star formation. At that moment the abundances of the seven COMs were obtained. The timescale for this period is variable and depends on the warm-up mechanism. After that, the gas and dust temperature could continue to rise. Under such circumstances, the observed COM abundances can be sustained at T ~ 27−50 K, which lasts for about 3 × 10⁴ yr in our fiducial model 2. An alternative is that the gas and dust temperature remain 65 and 20 K, respectively. However, the best fit cannot be sustained for a long time. We reran static fiducial model 1 by adopting the results when the best fit occurs according to Table 3 as the initial abundances, so the abundances at ttotal = 3.605 × 10⁵ yr in fiducial model 2 with an X-ray burst at T = 20 K, ζCR = 1.3 × 10⁻¹³ s−1 and t = 102 yr are selected. Figure 5 depicts the results. The best fit for all seven COMs can remain for only several hundred years, which seems to be consistent with the observed flare that could have happened about 100 yr ago (Churazov et al. 2017). If the observed abundances need to be sustained longer, multiple short-term flares may have to be considered.
In addition to these seven COMs, we also check the chemical differentiation of other organic molecules when T ~ 30 K. Some organic molecules are similar to five extended COMs and can reach relatively high abundances including CH3CCH, HC3N, HC5N, CH3OH, CH3CN, H2 CO, CH3CHO, NH2CHO, and c-H2C3O. Some of them have been observed in the extended region around Sgr B2 (Hollis et al. 2006b; Jones et al. 2008, 2011). In contrast, some COMs show very low abundances including C2 H5CHO, CH2OHCH2OH, HCOOCH2CH3, CH3COOH, C2 H5COOH, C2 H3CN, C3 H7CN, CH3CONH2, NH2CH2CN, and NH2CH2COOH, and they may not be observable in the extended region around Sgr B2 just like CH3OCH3 and C2 H5CN. However, C2 H5CHO and CH3CONH2 have actually been detected in Sgr B2 (Hollis et al. 2004b, 2006a), which is at odds with our model. Other detected species such as C2 H3CHO, CNCHO, CH3CHNH, and HNCHCN (Hollis et al. 2004b; Remijan et al. 2008; Loomis et al. 2013; Zaleski et al. 2013) are not included in our reaction network yet. It indicates that our chemical models still can be improved, including additional reactions related to these species, and more studies about the chemical mechanisms and reactions for producing COMs at low temperature are needed. More observations searching for COMs not only in this region but also in the cold regions around other star-forming regions can help to verify the validity of our simulations.
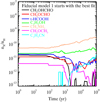 |
Fig. 5 Time-dependent evolution of the relative gas-phase abundances of CH2OHCHO, CH3 OCHO, t-HCOOH, C2H5OH, CH3 NH2, CH3 OCH3, and C2H5CN in fiducial model 1, when adopting the abundances at ttotal = 3.605 × 10⁵ yr from fiducialmodel 2 with an X-ray burst at T = 20 K with ζCR = 1.3 × 10⁻¹³ s−1 and t = 102 yr as the initial abundances. |
5 Conclusions
Based on the known physical parameters in the extended region around Sgr B2, we calculate a series of models to explore under what physical conditions the chemical simulations can fit the observations with the relatively high abundances of CH2OHCHO, CH3OCHO, t-HCOOH, C2 H5OH, and CH3NH2, but the low abundances of CH3OCH3 and C2 H5CN. We also try to explain the deficiency of CH3OCH3 and C2 H5CN. The macroscopic Monte Carlo method is used in the simulations. Photodesorption is included in all models. We study the influences of the chain reaction mechanism, shock action, X-ray burst, enhanced reactive desorption, and low diffusion barriers in some models. We adopt two types of simple physical models, a static model and an evolving model that includes a cold phase and a warm-up phase. The fiducial models adopt the observed physical parameters except for an ill-defined local cosmic ray ionization rate ζCR, and we simulate a series of models by changing the value of one parameter each time. All static models are not able to fit the observations, and in most models only the abundances of CH3NH2 and C2 H5CN can become relatively high. Most evolving models can fit at most six out of the seven COMs for T ~ 30−60 K in the warm-up phase, but the best-fit temperature is still higher than the observed dust temperature of 20 K. The best agreement between the simulations and all seven observed COMs at a lower temperature T ~ 27 K is achieved by considering a short-duration, ≈102 yr X-ray burst with ζCR = 1.3 × 10⁻¹³ s−1 at the early stage of the warm-up phase, when it still has a temperature of 20 K. The reactive desorption is the key mechanism for producing these COMs and inducing the low abundances of CH3OCH3 and C2 H5CN, because the radicals on the grain for producing these two COMs are less abundant than the radicals for producing the other five COMs. A possible explanation for the chemical differentiation is that the extended region around Sgr B2 underwent a cold phase with T ≤ 10 K and then a warm-up phase, whenT ~ 20 K an X-ray flare from a Galactic black hole Sgr A* with a short duration of no more than 100 yr was acquired, affecting strongly the Sgr B2 chemistry. The observed COM abundances in Sgr B2 can remain only several hundred years after such a flare, which could imply that such short-term X-rays flares occur relatively often, likely associated with the accretion activity of the Sgr A* source.
Acknowledgements
We thank Robin T. Garrod for providing the chemical reaction network he uses for the simulations of COMs. Y.W. thanks Qiang Chang for the suggestions of the Monte Carlo method and Chong Li for helping calculate some column densities. Y.W. and H.W. thank the supports by the National Key R&D Program of China (No. 2017YFA0402701) and by National Natural Science Foundation of China (NSFC) grant No. 11973091. Y.W. acknowledges the support from China Scholarship Council (CSC) grant No. 201906340047. F.D. is supported by the National Natural Science Foundation of China (NSFC) grant No. 11873094 and 12041305. D.S. acknowledges support by the Deutsche Forschungsgemeinschaft through SPP 1833: “Building a Habitable Earth” (SE 1962/6-1). This research made use of NASA’s Astrophysics Data System.
References
- Bacmann, A., Taquet, V., Faure, A., Kahane, C., & Ceccarelli, C. 2012, A&A, 541, L12 [NASA ADS] [CrossRef] [EDP Sciences] [Google Scholar]
- Baganoff, F. K., Bautz, M. W., Brandt, W. N., et al. 2001, Nature, 413, 45 [Google Scholar]
- Balucani, N., Ceccarelli, C., & Taquet, V. 2015, MNRAS, 449, L16 [Google Scholar]
- Belloche, A., Müller, H. S. P., Menten, K. M., Schilke, P., & Comito, C. 2013, A&A, 559, A47 [NASA ADS] [CrossRef] [EDP Sciences] [Google Scholar]
- Belloche, A., Garrod, R. T., Müller, H. S. P., & Menten, K. M. 2014, Science, 345, 1584 [Google Scholar]
- Belloche, A., Meshcheryakov, A. A., Garrod, R. T., et al. 2017, A&A, 601, A49 [NASA ADS] [CrossRef] [EDP Sciences] [Google Scholar]
- Bergner, J. B., Öberg, K. I., Garrod, R. T., & Graninger, D. M. 2017, ApJ, 841, 120 [NASA ADS] [CrossRef] [Google Scholar]
- Bonfand, M., Belloche, A., Garrod, R. T., et al. 2019, A&A, 628, A27 [NASA ADS] [CrossRef] [EDP Sciences] [Google Scholar]
- Burkhardt, A. M., Shingledecker, C. N., Le Gal, R., et al. 2019, ApJ, 881, 32 [Google Scholar]
- Cernicharo, J., Marcelino, N., Roueff, E., et al. 2012, ApJ, 759, L43 [NASA ADS] [CrossRef] [Google Scholar]
- Chang, Q., & Herbst, E. 2012, ApJ, 759, 147 [Google Scholar]
- Chang, Q., & Herbst, E. 2014, ApJ, 787, 135 [Google Scholar]
- Chang, Q., & Herbst, E. 2016, ApJ, 819, 145 [Google Scholar]
- Churazov, E., Khabibullin, I., Sunyaev, R., & Ponti, G. 2017, MNRAS, 465, 45 [Google Scholar]
- Cuppen, H. M., Walsh, C., Lamberts, T., et al. 2017, Space Sci. Rev., 212, 1 [Google Scholar]
- Etxaluze, M., Goicoechea, J. R., Cernicharo, J., et al. 2013, A&A, 556, A137 [NASA ADS] [CrossRef] [EDP Sciences] [Google Scholar]
- Garrod, R. T. 2013, ApJ, 765, 60 [Google Scholar]
- Garrod, R. T. 2019, ApJ, 884, 69 [Google Scholar]
- Garrod, R. T., & Herbst, E. 2006, A&A, 457, 927 [NASA ADS] [CrossRef] [EDP Sciences] [Google Scholar]
- Garrod, R. T., Wakelam, V., & Herbst, E. 2007, A&A, 467, 1103 [NASA ADS] [CrossRef] [EDP Sciences] [Google Scholar]
- Garrod, R. T., Widicus Weaver, S. L., & Herbst, E. 2008, ApJ, 682, 283 [NASA ADS] [CrossRef] [Google Scholar]
- Garrod, R. T., Belloche, A., Müller, H. S. P., & Menten, K. M. 2017, A&A, 601, A48 [NASA ADS] [CrossRef] [EDP Sciences] [Google Scholar]
- Goicoechea, J. R., Rodríguez-Fernández, N. J., & Cernicharo, J. 2004, ApJ, 600, 214 [NASA ADS] [CrossRef] [Google Scholar]
- Hasegawa, T. I., & Herbst, E. 1993, MNRAS, 263, 589 [NASA ADS] [CrossRef] [Google Scholar]
- Hassel, G. E., Herbst, E., & Garrod, R. T. 2008, ApJ, 681, 1385 [Google Scholar]
- Hassel, G. E., Harada, N., & Herbst, E. 2011, ApJ, 743, 182 [Google Scholar]
- Herbst, E., & van Dishoeck, E. F. 2009, ARA&A, 47, 427 [NASA ADS] [CrossRef] [Google Scholar]
- Hollis, J. M., Jewell, P. R., Lovas, F. J., & Remijan, A. 2004a, ApJ, 613, L45 [Google Scholar]
- Hollis, J. M., Jewell, P. R., Lovas, F. J., Remijan, A., & Møllendal, H. 2004b, ApJ, 610, L21 [Google Scholar]
- Hollis, J. M., Lovas, F. J., Remijan, A. J., et al. 2006a, ApJ, 643, L25 [Google Scholar]
- Hollis, J. M., Remijan, A. J., Jewell, P. R., & Lovas, F. J. 2006b, ApJ, 642, 933 [NASA ADS] [CrossRef] [Google Scholar]
- Hüttemeister, S., Wilson, T. L., Henkel, C., & Mauersberger, R. 1993, A&A, 276, 445 [NASA ADS] [Google Scholar]
- Hüttemeister, S., Wilson, T. L., Mauersberger, R., et al. 1995, A&A, 294, 667 [NASA ADS] [Google Scholar]
- Indriolo, N., Neufeld, D. A., Gerin, M., et al. 2015, ApJ, 800, 40 [NASA ADS] [CrossRef] [Google Scholar]
- Jaber, A. A., Ceccarelli, C., Kahane, C., & Caux, E. 2014, ApJ, 791, 29 [Google Scholar]
- Jiménez-Serra, I., Vasyunin, A. I., Caselli, P., et al. 2016, ApJ, 830, L6 [Google Scholar]
- Jin, M., & Garrod, R. T. 2020, ApJS, 249, 26 [Google Scholar]
- Jones, P. A., Burton, M. G., Cunningham, M. R., et al. 2008, MNRAS, 386, 117 [Google Scholar]
- Jones, P. A., Burton, M. G., Tothill, N. F. H., & Cunningham, M. R. 2011, MNRAS, 411, 2293 [Google Scholar]
- Jørgensen, J. K., Belloche, A., & Garrod, R. T. 2020, ARA&A, 58, 727 [Google Scholar]
- Le Petit, F., Ruaud, M., Bron, E., et al. 2016, A&A, 585, A105 [NASA ADS] [CrossRef] [EDP Sciences] [Google Scholar]
- Li, J., Wang, J., Qiao, H., et al. 2020, MNRAS, 492, 556 [Google Scholar]
- Liu, C., Chen, X., & Du, F. 2020, ApJ, 899, 92 [Google Scholar]
- Loomis, R. A., Zaleski, D. P., Steber, A. L., et al. 2013, ApJ, 765, L9 [NASA ADS] [CrossRef] [Google Scholar]
- Lu, Y., Chang, Q., & Aikawa, Y. 2018, ApJ, 869, 165 [Google Scholar]
- Marrone, D. P., Baganoff, F. K., Morris, M. R., et al. 2008, ApJ, 682, 373 [Google Scholar]
- McGuire, B. A. 2018, ApJS, 239, 17 [Google Scholar]
- Nobukawa, M., Ryu, S. G., Tsuru, T. G., & Koyama, K. 2011, ApJ, 739, L52 [Google Scholar]
- Öberg, K. I., Fuchs, G. W., Awad, Z., et al. 2007, ApJ, 662, L23 [Google Scholar]
- Öberg, K. I., Linnartz, H., Visser, R., & van Dishoeck, E. F. 2009a, ApJ, 693, 1209 [NASA ADS] [CrossRef] [Google Scholar]
- Öberg, K. I., van Dishoeck, E. F., & Linnartz, H. 2009b, A&A, 496, 281 [NASA ADS] [CrossRef] [EDP Sciences] [Google Scholar]
- Öberg, K. I., Bottinelli, S., Jørgensen, J. K., & van Dishoeck, E. F. 2010, ApJ, 716, 825 [Google Scholar]
- Potapov, A., Jäger, C., & Henning, T. 2020, Phys. Rev. Lett., 124, 221103 [Google Scholar]
- Rea, N., Esposito, P., Pons, J. A., et al. 2013, ApJ, 775, L34 [NASA ADS] [CrossRef] [Google Scholar]
- Reid, M. J., Menten, K. M., Brunthaler, A., et al. 2014, ApJ, 783, 130 [Google Scholar]
- Remijan, A. J., Hollis, J. M., Lovas, F. J., et al. 2008, ApJ, 675, L85 [Google Scholar]
- Requena-Torres, M. A., Martín-Pintado, J., Rodríguez-Franco, A., et al. 2006, A&A, 455, 971 [NASA ADS] [CrossRef] [EDP Sciences] [Google Scholar]
- Requena-Torres, M. A., Martín-Pintado, J., Martín, S., & Morris, M. R. 2008, ApJ, 672, 352 [Google Scholar]
- Roberge, W. G., Jones, D., Lepp, S., & Dalgarno, A. 1991, ApJS, 77, 287 [Google Scholar]
- Rodríguez-Fernández, N. J., Martín-Pintado, J., Fuente, A., & Wilson, T. L. 2004, A&A, 427, 217 [NASA ADS] [CrossRef] [EDP Sciences] [Google Scholar]
- Ruaud, M., Loison, J. C., Hickson, K. M., et al. 2015, MNRAS, 447, 4004 [Google Scholar]
- Ryu, S. G., Nobukawa, M., Nakashima, S., et al. 2013, PASJ, 65, 33 [Google Scholar]
- Schmiedeke, A., Schilke, P., Möller, T., et al. 2016, A&A, 588, A143 [NASA ADS] [CrossRef] [EDP Sciences] [Google Scholar]
- Shen, C. J., Greenberg, J. M., Schutte, W. A., & van Dishoeck, E. F. 2004, A&A, 415, 203 [NASA ADS] [CrossRef] [EDP Sciences] [Google Scholar]
- Shingledecker, C. N., Tennis, J., Le Gal, R., & Herbst, E. 2018, ApJ, 861, 20 [Google Scholar]
- Spitzer, Lyman, J., & Tomasko, M. G. 1968, ApJ, 152, 971 [Google Scholar]
- Terrier, R., Ponti, G., Bélanger, G., et al. 2010, ApJ, 719, 143 [Google Scholar]
- Vastel, C., Ceccarelli, C., Lefloch, B., & Bachiller, R. 2014, ApJ, 795, L2 [Google Scholar]
- Vasyunin, A. I., & Herbst, E. 2013a, ApJ, 762, 86 [Google Scholar]
- Vasyunin, A. I., & Herbst, E. 2013b, ApJ, 769, 34 [Google Scholar]
- Vasyunin, A. I., Semenov, D. A., Wiebe, D. S., & Henning, T. 2009, ApJ, 691, 1459 [Google Scholar]
- Wang, Y., Chang, Q., & Wang, H. 2019, A&A, 622, A185 [NASA ADS] [CrossRef] [EDP Sciences] [Google Scholar]
- Willis, E. R., Garrod, R. T., Belloche, A., et al. 2020, A&A, 636, A29 [CrossRef] [EDP Sciences] [Google Scholar]
- Zaleski, D. P., Seifert, N. A., Steber, A. L., et al. 2013, ApJ, 765, L10 [Google Scholar]
All Tables
Observed and simulated fractional abundances of the seven COMs in the extended region of Sgr B2.
All Figures
|
Fig. 1 Time-dependent evolution of the relative gas-phase abundances of CH2OHCHO, CH3 OCHO, t-HCOOH, C2H5OH, CH3 NH2, CH3 OCH3, and C2 H5CN in static models. Fiducial model 1 assumes nH = 2 × 103 cm−3, AV = 10, Tgas = 65 K, Tdust = 20 K, G0 = 104, and ζCR = 1.3 × 10⁻¹⁷ s−1. Other staticmodels use different values of each of these parameters at a time. |
| In the text | |
|
Fig. 2 As in Fig. 1, but adopting additional mechanisms on the basis of fiducial model 1. In panels A–C the chain reaction mechanism for the products of Langmuir-Hinshelwood reactions, photodissociation, and adsorption is considered, respectively. In panel D the chain reaction mechanism for all three types of products is considered. In panel E aRRK = 0.1 is used. In panel F Eb = 0.3Ed is used. In panels G–L the abscissae start with the abundances at ttotal = 106 yr in fiducial model 1, which correspond to ttotal − 106 yr. In panels G–I a case with a shock is considered, assuming peak temperatures of Tpeak = 200 or 1000 K, and shock duration of t = 102 or 104 yr. In panels J–L a case with an X-ray burst is considered, which is described in the models by the elevated cosmic ray ionization rate ζCR = 1.3 × 10⁻¹⁴ s−1 or 1.3 × 10⁻¹³ s−1 during a short timescale of t = 102 or 104 yr, respectively.After the shock or the X-ray burst, all parameters are assumed to be the same as in fiducial model 1. |
| In the text | |
|
Fig. 3 Time-dependent evolution of the relative gas-phase abundances of CH2OHCHO, CH3 OCHO, t-HCOOH, C2H5OH, CH3 NH2, CH3 OCH3, and C2 H5CN in the warm-up phase in evolving models. Fiducial model 2 adopts nH = 2 × 103 cm−3, AV = 10, tcold = 3 × 10⁵ yr, twarmup= 2 × 10⁵ yr, Tmax =200 K, G0 = 104, ζCR = 1.3 × 10⁻¹⁷ s−1. Other evolving models adopt a different value of each of these parameters at a time. In panel L, a linear rather than a quadratic warm-up rate is used in Eq. (3) (n = 1). |
| In the text | |
|
Fig. 3 continued. |
| In the text | |
|
Fig. 4 As in Fig. 3, but adopting additional mechanisms on the basis of fiducial model 2. In panels A–C three cases with aRRK = 0, 0.05, and 0.1 are considered, respectively. In panel D a case with faster diffusion rates Eb = 0.3Ed is considered. In panels E–H a scenario with a shock passage is considered, where T = 10 and 20 K represent the temperature when the shocks occurs in the warm-up phase (ttotal = 3 × 10⁵ yr and 3.459 × 10⁵ yr, respectively). Peak temperatures Tpeak = 200 and 1000 K are the temperatures during shock passage, and t = 102 yr is the duration the passage. In panels I–L a scenario with an X-ray burst is considered, which is described in the models by the elevated cosmic ray ionization rate of ζCR = 1.3 × 10⁻¹⁴ s−1 and 1.3 × 10⁻¹³ s−1, T = 10 and 20 K, and the X-ray burst duration is t = 102 yr. After the shock passage and the X-ray burst, all parameters are the same as in fiducial model 2. |
| In the text | |
|
Fig. 5 Time-dependent evolution of the relative gas-phase abundances of CH2OHCHO, CH3 OCHO, t-HCOOH, C2H5OH, CH3 NH2, CH3 OCH3, and C2H5CN in fiducial model 1, when adopting the abundances at ttotal = 3.605 × 10⁵ yr from fiducialmodel 2 with an X-ray burst at T = 20 K with ζCR = 1.3 × 10⁻¹³ s−1 and t = 102 yr as the initial abundances. |
| In the text | |
Current usage metrics show cumulative count of Article Views (full-text article views including HTML views, PDF and ePub downloads, according to the available data) and Abstracts Views on Vision4Press platform.
Data correspond to usage on the plateform after 2015. The current usage metrics is available 48-96 hours after online publication and is updated daily on week days.
Initial download of the metrics may take a while.