| Issue |
A&A
Volume 648, April 2021
First science highlights from SRG/eROSITA
|
|
|---|---|---|
| Article Number | A39 | |
| Number of page(s) | 10 | |
| Section | Stellar structure and evolution | |
| DOI | https://doi.org/10.1051/0004-6361/202040145 | |
| Published online | 09 April 2021 | |
Observations of Her X-1 in low states during SRG/eROSITA all-sky survey
1
Moscow State University, Sternberg Astronomical Institute,
119234
Moscow,
Russia
e-mail: This email address is being protected from spambots. You need JavaScript enabled to view it.
2
Kazan Federal University,
420008
Kazan,
Russia
3
Space Research Institute of the Russian Academy of Sciences,
117997
Moscow,
Russia
4
Max-Planck-Institut für Astrophysik (MPA),
Karl-Schwarzschild-Str 1,
85741
Garching, Germany
Received:
16
December
2020
Accepted:
20
February
2021
Abstract
eROSITA (extended ROentgen Survey with an Imaging Telescope Array) instrument onboard the Russian-German ‘Spectrum-Roentgen-Gamma’ (SRG) mission observed the Her X-1/HZ Her binary system in multiple scans over the source during the first and second SRG all-sky surveys. Both observations occurred during a low state of the X-ray source when the outer parts of the accretion disk blocked the neutron star from view. The orbital modulation of the X-ray flux was detected during the low states. We argue that the detected X-ray radiation results from scattering of the emission of the central source by three distinct regions: (a) an optically thin hot corona with temperature ~(2−4) × 106 K above the irradiated hemisphere of the optical star; (b) an optically thin hot halo above the accretion disk; and (c) the optically thick cold atmosphere of the optical star. The latter region effectively scatters photons with energies above 5–6 keV.
Key words: accretion, accretion disks / binaries : close / stars: neutron / X-rays: binaries
© ESO 2021
1 Introduction
HZ Her/Her X-1 is an intermediate-mass X-ray binary consisting of an accreting neutron star with mass mx = 1.4 M⊙ and spin period Px ≈ 1.24 s, and a donor star with mass mo = 2.0 M⊙ (Tananbaum et al. 1972). The light curve of HZ Her/Her X-1 demonstrates clear eclipses because of the high inclination of the binary system to the line of sight, about 90°. The optical star HZ Her fills its Roche lobe (Crampton 1974) and shows a significant modulation with an orbital period of Pb = 1.7 d (Bahcall & Bahcall 1972). This modulation is due to a strong irradiation effect of the donor star (Lyutyi et al. 1973), as was first found from the inspection of archival photo-plates (Cherepashchuk et al. 1972). The reflection effect from the heated atmosphere of HZ Her was also observed in the extreme ultraviolet by the EUVE (Extreme Ultraviolet Explorer) satellite (Leahy & Marshall 1999; Leahy 2000, 2003; Leahy & Dupuis 2010) and by the Astron satellite (Sheffer et al. 1992).
Soon after the discovery of the X-ray source in 1971 (Schreier et al. 1972; Tananbaum et al. 1972), a 35-day modulation of the X-ray flux was discovered by the Uhuru satellite (Giacconi et al. 1973). For some time, only the Main-on state of the 35-day cycle was known. Using the data obtained by Copernicus and Ariel V satellites, Fabian et al. (1973) and Cooke & Page (1975), respectively, discovered a lower-amplitude Short-on state. Later on, Jones & Forman (1976) analyzed the archive Uhuru observations and revealed the presence of the “Short-on” state in the data. Therefore, the 35-day X-ray cycle of Her X-1 comprises four states: (1) the Main-on lasting approximately seven orbits with the highest X-ray flux; (2) the first low state lasting approximately four orbits; (3) the Short-on lasting approximately four orbits with the X-ray flux about three times as low as in the Main-on; and (4) the second low-state lasting approximately four orbits (see, e.g., Shakura et al. 1998 for more details and Leahy & Wang 2020 for a recent update). The 35-day cycle is associated with a tilted, retrograde precessing accretion disk. In the middle of the Main-on and Short-on, the disk is maximum open to the observer’s view, and the X-ray source is visible. During the low states, the outer parts of the tilted disk block the X-ray source from the observer’s view. The analysis of a large amount of optical photometric data for HZ Her (Boynton et al. 1973; Boynton 1978) supports the presence of such a disk. However, this interpretation is not unique. For example, in the model elaborated by Leahy (2002), a geometrically thin twisted disk with a thick inner ring and extended central X-ray source is used to explain the ASM/RXTE (All-Sky Monitor of the Rossi X-ray Timing Explorer) light curve. This model was also applied to explain orbital modulation of the extreme ultraviolet emission at low states of Her X-1 observed by the EUVE satellite (Leahy 2003). Recent joint observations of Her X-1 by XMM-Newton (X-ray Multi-Mirror Mission) and NuSTAR (Nuclear Spectroscopic Telescope Array) telescopes confirmed the presence of the warped, retrograde precessing accretion disk Brumback et al. (2021).
In 1985, using observations from EXOSAT (The European X-ray Observatory SATellite), Parmar et al. (1985) for the first time detected X-ray flux during both the first and second low states. X-ray flux detected by the RXTE/ASM observations of Her X-1 in the low state (Fig. 4, bottom panel, in Scott & Leahy 1999) does not show significant orbital modulation outside X-ray eclipses. More detailed RXTE/PCA (RXTE Proportional Counter Array) observations of Her X-1 in the low state starting at MJD 52 261.52 measured orbital modulation of the flux (İnam & Baykal 2005; Leahy & Igna 2011; Abdallah & Leahy 2015). In 2002, Chandra detected Her X-1 during its low-state (Ji et al. 2009). In 2017, a low-state preceding a turn-on of Her X-1 wasobserved with the AstroSat satellite (Leahy & Chen 2019).
Mavromatakis (1993) analyzed a Short-on of Her X-1 using the data obtained by the ROSAT (ROentgen SATellite) all-sky X-ray survey. Since 2019, a new, deeper all-sky X-ray survey has been carrying out by SRG/eROSITA mission from the vicinity of the Earth-Moon L2 point (see Predehl et al. 2021 for a description of the SRG/eROSITA telescope).
Her X-1 was observed several times at the beginning of March and September 2020. The period of rotation of the SRG/eROSITA satellite is about four hours. The spin axis of the satellite precesses around the direction to the ecliptic poles with a rate of about 1° d−1. In the sky scans, Her X-1 was seen in the field of view of the SRG/eROSITA telescope during 14–16 four-hour intervals, which amounts to 1.5 orbital periods of Her X-1. All the observations of Her X-1 happened during the low state of the X-ray source; see Fig. 1.
The SRG/eROSITA telescope has detected a clear signal from the source modulated with the orbital period of the Her X-1/HZ Her binary. Near the orbital phase zero (the eclipse center), the X-ray flux was minimal. Outside the minimum, the X-ray flux was observed to vary with the orbital phase.
In the present paper, we analyze and model the X-ray flux variation from Her X-1 detected by the SRG/eROSITA in the low state of the source. The structure of the paper is as follows. In Sect. 2, SRG/eROSITA observations and their spectral modeling are presented. In Sect. 3, scattering of X-rays in a hot corona above the irradiated atmosphere of HZ Her is described and calculated. Orbital modulation in the low states of Her X-1 observed by SRG/eROSITA are computed in Sect. 4. In Sect. 5 we discuss X-ray reflection in the cold photosphere of HZ Her and in Sect. 6 we formulate our main results. In Appendices A and B, we provide details of the calculation of X-ray scattering in a hot optically thin corona above the illuminated part and photosphere of the optical star, respectively.
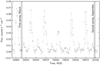 |
Fig. 1 Swift/BAT X-ray flux of Her X-1 as a function of time (Krimm et al. 2013). Vertical lines indicate the SRG/eROSITA observations of Her X-1. |
2 X-ray data
In the first all-sky survey, the position of Her X-1 was scanned by the SRG observatory 14 times with a four-hour cadence during March 5–7, 2020. In these observations, we used data from six eROSITA cameras, excluding the fifth telescope module (TM). The net count rate for the source was 3.94 ± 0.08 cts s−1 in the 0.3–10 keV energy band with a total exposure time of 570 sec. During the second all-sky survey, the source was observed with SRG/eROSITA on Sep. 4–6, 2020 in a similar manner. All seven TMs were watching the source simultaneously, and the total exposure time was 588 sec. The net count rate for the source was obtained at the level of 5.8 ± 0.1 cts s−1 in the 0.3–10 keV energy band.
The eROSITA raw data were processed by the calibration pipeline based on the eROSITA Science Analysis Software System (eSASS) and using pre-flight calibration data. We extracted the source spectra and light curves using a circular region with a radius of 80 arcsec (corresponding to 99% encircled energy) centered on the source position. An annulus region with inner and outer radii of 100 arcsec and 200 arcsec around Her X-1 was chosen for the background extraction. We also exclude a circular part with a 15 arcsec radius masking a faint source in the background extraction area.
Although the source is quite bright, it is not bright enough for the photon pile-up to become important. Indeed, the source count rate did not exceed the nominal ~1 count per second per TM level, which is currently recommended by the calibration team as a threshold signaling that the photon pile-up may be important. The highest full band count rate of ≈ 1.2 counts s−1 was achieved in TM5 during the second sky survey, which is compatible with the above threshold. We further checked the source image and spectrum for the pile-up signatures and did not find any. We thus conclude that the source is not subject to significant pile-up effects.
The spectra were extracted for the total exposure in each survey and for each source passage by SRG/eROSITA (14 spectra per survey). We fitted spectra in the 0.3–8 keV energy range. For the final spectral analysis (Table 1, Figs. 2, 4) we used combined data of all operational telescope modules. The spectra were next rebinned so as to ensure a minimum of five counts per energy bin by means of the standard tool GRPPHA. We then used the C-statistic (Cash 1979) with correction for the background subtraction (“W-statistic”) in the XSPEC package (version 12.11.0, Arnaud 1996) to analyze the data.
Best-fit parameters obtained from fitting to the survey-averaged energy spectrum of Her X-1 from the first and the second SRG all-sky surveys.
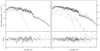 |
Fig. 2 eROSITA spectra of Her X-1 obtained during the first and the second sky surveys (left and right panels, respectively). The solid black line shows the best-fit model (see Table 1), and the green dashed line shows the contribution from the proper emission of hot photoionized plasma (not detected in the first survey). Thin red and blue lines show the blackbody and power-law components, respectively. The bottom panels show the ratio of the data to the folded model. The visible excess in the residuals at higher energies is due to the Fe K complex and possible reflection from the cold photosphere of the optical star, which are unaccounted for in the spectral modeling (see Sect. 5). |
2.1 Average spectra
We start with analyzing the spectra averaged over all passages in each survey. The X-ray spectra obtained from the first and second all-sky surveys have similar shapes (see Fig. 2), with normalization being higher during the scans in September 2020. The spectra can be characterized by a complex shape at low energies, an almost flat continuum above 2 keV, and a hint of the presence of emission lines.
Extensive studies of Her X-1 at different phases of the 35-day cycle by different X-ray satellite have established the broadband continuum emission model involving, in particular, a thermal blackbody component with a temperature of ≈ 0.1 keV that dominates the spectrum at low energies and a broken power law with an exponential cut-off at higher energies (up to ~ 200 keV, see McCray et al. 1982; Leahy et al. 1994; Leahy 1995, 1997, 2001; Leahy & Yoshida 1995; Oosterbroek et al. 1997; dal Fiume et al. 1998; Kuster et al. 2005; Klochkov et al. 2008; Leahy & Chen 2019). It was also suggested that outside the Main-on state, a partial covering model is needed to account for the spectral shape change (Ramsay et al. 2002). However, given the limited statistics of our ≈ 200 sec observations, we use a simplified model to describe the continuum emission by combining a blackbody component and a power law. We also apply the TBabs model (Wilms et al. 2000) with the neutral hydrogen column density fixed at the Galactic value in the direction to Her X-1, NH = 1.54 × 1020 cm−2, obtained from the HI4PI map (HI4PI Collaboration 2016).
In addition to the complex continuum, the spectrum of Her X-1 shows a wealth of X-ray lines. The first spectral features were discovered in observations by BeppoSAX (Satellite per Astronomia X), which revealed a broad Fe L line complex at 0.9–1 keV, the Fe K line complex at 6.4 keV (Oosterbroek et al. 1997, 2001; McCray et al. 1982), and also a cyclotron absorption feature at ~ 40 keV (see Truemper et al. 1978, Staubert et al. 2016, 2017, 2020 for a recent discussion). The low-energy X-ray lines were then studied in depth by Jimenez-Garate et al. (2005) and Ji et al. (2009) using high-resolution gratings spectra from Chandra, which resolved a dozen recombination lines originating from photoionized gas emission.
2.2 X-ray spectral modeling
In this paper, we put forward a model that attributes the photoionized component to the emission from a hot optically thin corona above the donor star (see Sect. 3 and Fig. 3). To investigate the contribution of this component to the Her X-1 spectrum in the low state, we use XSTAR’s PHOTEMIS (v. 2.54, Kallman & Bautista 2001) semi-analytic model in XSPEC. Using XSTAR, we calculate the ion fractions and atomic level populations file to reproduce relevant physical conditions. In XSTAR run, we assume a spherical geometry of the wind, set the gas density to 1012 cm−3, and fix elemental abundances to the solar values which are defined in XSTAR relative to Grevesse et al. (1996). For the illuminating source, we set the luminosity 2 × 1037 erg s−1 and a power-law spectrum with photon index Γ = 1, which roughly corresponds to the central source in Her X-1. We set the initial gas temperature at Tinit = 105 K and allow XSTAR to calculate it assuming the thermal equilibrium of gas. Due to insufficient counts, we do not try to fit the ionization parameter value and fix it at ξ = Li ∕nR2 = 1000 (see Sect. 3), where Li is the ionizing luminosity, R is distance from the ionizing source, and n is the gas number density. This photoionization parameter value follows from theoretical calculations of induced stellar wind from X-ray illuminated atmosphere of HZ Her (Basko & Sunyaev 1973; Basko et al. 1974). Then the equilibrium gas temperature is Teq ≈ 2 × 10⁶ K.
We thus fit the broadband (0.3–8 keV) spectra using the combined model which reads in XSPEC as TBABS (BBODYRAD + POWERLAW + PHOTEMIS). Figure 2 shows the best-fit model and the contribution of various components to the eROSITA spectra. The best-fit parameters and the 90% confidence ranges are listed in Table 1. We found no evidence for the photoionization component in the spectrum from the first survey with a 90% upper limit on its emission measure at 8 × 1056 cm−3. For the second survey, we found a marginal improvement of the fit (δC-statistic = -6 for δd.o.f. = + 1), which corresponds to a statistical significance of ≈2.6σ. We found no significant variation in the blackbody temperature and normalization between the averaged spectra from the first and the second surveys. The found best-fit values are in good agreement with the Chandra results for observations in the low state of Her X-1 (Ji et al. 2009).
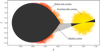 |
Fig. 3 Schematic geometrical model of Her X-1/HZ Her used to calculate the X-ray orbital light curve. The model includes the Roche-lobe filling star (to the left), a hot corona above its X-ray-illuminated part (in orange), the accretion disk around the neutron star (to the right), and a hot halo above the accretion disk (disk corona, in yellow). Also shown is the accretion disk shadow on the illuminated part of HZ Her. |
2.3 X-ray orbital light curve
Due to a minor contribution from the photoionized emission (see Fig. 2), to construct the X-ray orbital light curve during the first and the second survey, we simplify the spectral model by eliminating the photoionization component. We also fix the blackbody component temperature at 0.1 keV (see Table 1). Thus, the broadband spectral model in the low state of Her X-1 can be fitted by three parameters: the power-law and blackbody component normalizations and the power-law photon index. The obtained model makes it possible to investigate the evolution of the continuum components during individual scans, for which the total number of counts is low, namely about 100. We note that the X-ray spectrum of Her X-1 was described by the blackbody and power-law components for the first time by McCray et al. (1982) using the Einstein observations. The blackbody radiation is emitted by the inner parts of the accretion disk. The power-law tail is produced near the surface of the accreting magnetized neutron star. During the low state, the accretion disk and the inner parts of the neutron star are obscured from the view of the observer by the outer parts of the warped disk. Both spectral components are observed directly at the Main-on and Short-on states of the 35-day cycle.
The obtained X-ray flux of the power-law component, dominating in the energy range 0.2–8 keV, as a function of time during the first and the second SRG all-sky surveys is shown in Fig. 4 by dots with error bars. The power-law component dominates over the blackbody one above ~ 0.7 keV, and therefore below, we use the power-law component as a proxy for the observed X-ray flux in the low state of Her X-1.
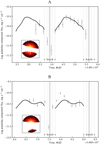 |
Fig. 4 X-ray flux of the power-law component in the energy range 0.2 – 8 keV from Her X-1 as a function of time during the first (A)and second (B) survey. The solid line is the theoretical flux calculated as described in Sect. 4. Figures inside plots show the brightness of scattered X-rays in the corona at the orbital phase 0.5. The white region is the X-ray shadow. The solid vertical lines indicate the orbital phase zero. The dotted vertical lines a, b, and c before and after the orbital phase zero indicate different accretion disk ingress and egress moments. Here, c–a and a–c intervals before and after phase zero, respectively, indicate the orbital phases where the donor star partially covers the accretion disk. Line b indicates expected moments of ingress and egress of the X-ray source. The a–a interval covers the total eclipse of the disk by the donor star. |
3 Scattering in a hot optically thin corona above the donor star
Basko & Sunyaev (1973) and Basko et al. (1974) were the first to show that, in an X-ray binary with an optical donor star, above the irradiated side of the donor, a hot (T ~ (2−4) × 106 K) corona is formed that is optically thin to scattering free electrons (τs ≲ 0.05−0.1). The gas number density of the corona is n ~ 1012 cm−3. The absorption optical depth in the corona is negligible (τa ≪ 1).
Following Krolik et al. (1981), the photoionization parameter Ξ is defined as
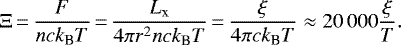 (1)
(1)
The value of Ξ in the corona is about 5–10. Along with thermally stable states, there are thermally nonstable states of the corona (see, e.g., Mehdipour et al. 2016). Therefore, we expect thermal stratification of the coronal plasma and hence time variations of the scattered X-ray flux, which is indeed observed (see Fig. 4). Further away from the stellar surface, the corona is transformed into a hot stellar wind with a temperature of about 107 K.
In Appendix A, the scattered X-ray flux from such a corona illuminated by a point-like central X-ray source is computed analytically using the single scattering approximation. The calculations presented in Appendix A suggest that the scattered X-ray luminosity of the corona is about 2 × 1035 erg s−1. The proper X-ray luminosity of the hot photoionized coronal plasma is much smaller, of the order of 3 × 1034 erg s−1. The characteristic time of emission is approximately some tens of seconds.
In the case of Her X-1, accurate computation of scattering from the hot corona above the X-ray-illuminated atmosphere of HZ Her requirestaking into account the shadow from the tilted, twisted accretion disk around the neutron star and the complicated geometry of the corona. In our calculations, we use several simplifying approximations.
- 1.
The corona is assumed to have a constant density and temperature; its size is equal to that of exponential atmosphere, H = kBTR2∕mpGM. Depending on the temperature, H ~ 0.1–0.3R. The corona is virtually absent inside the X-ray shadow produced by a warped accretion disk around the central source; see Fig. 4.
- 2.
The observed X-ray flux is assumed to be proportional to the visible volume of the hot irradiated plasma. The corona can be partially screened from the observer by the star itself and by the accretion disk.
- 3.
Each volume element dV of the corona is assumed to scatter photons independently from others. The flux scattered by a volume element is proportional only to the incident X-ray flux F = Lx∕4πr2, where r is the distance between the volume element dV and the central X-ray sourcewith luminosity Lx.
In a homogeneous corona, the specific luminosity of single-scattered X-ray radiation from the corona reads:
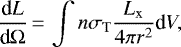 (2)
(2)
where the integral is taken over the volume visible from a given direction, x(γ) is the scattering diagram, γ is the angle between the given direction and the line connecting the volume element d V and X-ray source, σT is the Thomson cross-section, and n is the number density of electrons in the volume element dV.
The integral in Eq. (2) is calculated numerically using the following procedure. The corona is approximated by N fixed randomly distributed points filling the layer with height H above the donor star’s irradiated surface; see Fig. 4. Each point is checked for whether it is blocked from the view of the observer by the donor star or the accretion disk or falls within the disk’s X-ray shadow region. For points which are not blocked and are not inside the shadow, the distance r to the X-ray source is calculated. Then, the integral Eq. (2) can be approximated as:
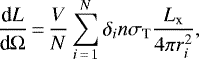 (3)
(3)
where V is the full volume of the corona including the X-ray shadow and blocked regions. The volume V is computed numerically. δi = 0 if point i is blocked from the view of the observer by the star or the accretion disk, or is inside the disk’s X-ray shadow region, and δi = 1 if the point i is not blocked, nor falls inside the shadow region.
4 Orbital X-ray light curve in the low state of Her X-1
As shown inthe previous section, X-ray emission in the low-state of Her X-1 is dominated by the scattered radiation in the hot corona above the illuminated atmosphere of HZ Her. To calculate the orbital X-ray light curve, we use the geometrical model of a binary system with a Roche-lobe-filling star and a tilted, warped accretion disk around the compact star, as implemented in the numerical code developed in Kolesnikov et al. (2020) and supplemented here with a scattering X-ray corona above the illuminated atmosphere of the optical star (see Fig. 3).
A hot halo above the accretion disk itself (the disk corona) also scatters X-rays from the central source (see, e.g., Bochkarev 1989; Bochkarev & Karitskaya 1992). Ginga/LAC observations of Her X-1 during a short-on state suggested the presence of an extended X-ray source (Leahy 2000; Leahy & Chen 2019). Later on, evidence for a hot disk corona in Her X-1 was found from RXTE observations (Leahy 2015). In our modeling, we assume that the hot accretion disk corona constantly adds to the total flux at all orbital phases except for eclipses of the central X-ray source and the accretion disk (0.0–0.13 and 0.87–1.0). To calculate the X-ray light curve at the eclipse phases, one should specify the accretion disk corona structure. This can be quite complicated (see, e.g., the modeling of orbital X-ray light curve with a nonconstant density disk corona in Leahy 2015). In an almost edge-on binary like Her X-1, some orbital modulation from the structured accretion disk corona can be due to eclipses of the corona’s inner parts by the outer boundary of the twisted tilted accretion disk. However, the quality of X-ray data under analysis does not allow us to test such additional effects to scattering on the coronal plasma above the illuminated atmosphere of HZ Her. A continuous set of dedicated observations during the X-ray eclipse is needed to probe the central X-ray source’s hot corona. This is a different problem, and in this paper we exclude the eclipse phases (0.0–0.13 and 0.87–1.0) from our analysis.
The model X-ray light curve of Her X-1 in the low states observed during the first and second eROSITA surveys is presented in Fig. 4 (A and B, respectively). The solid curves indicate the calculated X-ray flux scattered in the hot corona above HZ Her and accretion disk while taking into account shadows from the precessing, tilted, warped accretion disk. On the left panels of the plots, the X-ray brightness of the corona above the illuminated atmosphere of HZ Her (in color) and the disk shadows (in white) are shown for the orbital phase 0.5. The orbital ephemeris of Her X-1 is taken from Staubert et al. (2009). The disk corona’s contribution is presented in Table 2 in units of scattered flux from the donor star’s corona. Dots with vertical bars show the observed eROSITA flux. We assume that the X-ray luminosity of the central source remained constant during both eROSITA observations.
Observations A and B occurred at different phases of the 35-day cycle of Her X-1. The first (A) and second (B) survey observations happened in the low states preceding and following the Short-on. According to the Swift/BAT (Swift Burst Alert Telescope) X-ray data (see Fig. 1), the 35-day phase of the middle of eROSITA observations is Φ ≈ 0.5 during the first survey and Φ ≈ 0.8 during the second survey. The difference is clearly seen in the observed and calculated light curves that are mostly shaped by the form of the precessing disk shadow shielding the corona from the central X-ray source.
Figure 4 suggests that the modulation of the X-ray emission observed during both the first and second observations of Her X-1 can be explained by scattering in the hot corona above the illuminated atmosphere of HZ Her with an account of shadows produced by the precessing, tilted, warped accretion disk around the central neutron star (Kolesnikov et al. 2020).
Model parameters during first and second survey.
5 X-ray absorption and scattering in the cold optically thick donor’s photosphere
Above, we calculate the X-ray light curve from Her X-1 in the low state in the energy range where the scattered radiation from the hot corona above HZ Her dominates. At high photon energies, the X-ray reflection from the cold photosphere of HZ Her should also be taken into account (Basko et al. 1974). Evidence for hard X-ray reflection from HZ Her during the low state of Her X-1 was found from RXTE/PCA observations by Abdallah & Leahy (2015).
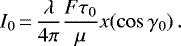
Indeed, as shown in Appendix B, in the hot corona above the optical star, the photon scattering optical depth τs ≲ 0.1, which means that only ≲10% of incident photons can be scattered. The rest of the photons are absorbed and partially reflected by the photosphere of the cold donor. The absorption cross-section in the cold plasma strongly depends on the photon energy, σa ~ E−3. The single scattering albedo is approximately λ ≈ 1∕2 at the energy 6–8 keV. Above ~20 keV, about half of all photons are scattered by the cold plasma and escape from the photosphere (Mescheryakov et al. 2011). The exact intensity I(τ = 0, μ, ϕ) of scattered photons in the cold photosphere is calculated in Appendix B.
As seen from Fig. B.1, at 8 keV, the X-ray reflection from the cold photosphere of HZ Her could add ~ 3% to the total flux. The increase in the spectral residuals at high energies visible in the lower panels of Fig. 2 could be attributed to this reflection.
6 Discussion and conclusion
In this paper, we present the SRG/eROSITA X-ray observations of Her X-1 during two low-states of the 35-day cycle. Observations were performed during the first and second surveys in March and September 2020, and each covered about 1.5 binary orbital periods. Orbital modulation of X-ray flux during the low-states was clearly detected (see Fig. 4).
In both observations, the X-ray spectrum of the source can be fitted by a blackbody and power-law component, with only a minor contribution of proper emission from the hot photoionized plasma (see Fig. 2 and Table 1). The power-law component dominates above ~ 0.7 keV. The observed short-time variability could be due to thermal instability in the photoionized plasma (see, e.g., Mehdipour et al. 2016). Indeed, variable ionized mass outflows from Her X-1 are observed originating from the nonstationary hot corona above the accretion disk and optical star (Kosec et al. 2020).
In the energy range 0.2–8 keV, the orbital modulation from Her X-1 in the low state can be explained (the solid curve in Fig. 4) by a geometrical model of the binary with precessing tilted accretion disk around the central X-ray source (Kolesnikov et al. 2020) supplemented with the X-ray scattering from a hot optically thin corona above the illuminated photosphere of the optical star. At energies close to 8 keV, photons reflection from the cold photosphere of the optical star should be taken into account (see Appendix B). This could explain the excess of high-energy photons visible in the spectral residuals in the lower panel of Fig. 2.
The X-ray orbital modulation was detected at the end of the low state during one binary period preceding the Short-on in RXTE/PCA observations (İnam & Baykal 2005; Abdallah & Leahy 2015). In Abdallah & Leahy (2015), the X-ray spectra are modeled by three components: (1) a power-law component with photon index Γ ≈ 1 reflected from the donor star photosphere and strong absorption NH ≈ 1023−1024 cm−2, (2) an unabsorbed power-law component with the same Γ due to scattering in a hot corona above the accretion disk, and (3) the Fe Kα line. In the model of these latter authors, the orbital modulation is due to variable absorption of the hard reflected component from the cold photosphere, while the scattered component from the disk corona remains constant.
The picture is different in the case of eROSITA observations. The eROSITA 0.3–7 keV spectra (see Table 1 and Fig. 2) are best fitted by one power-law component with Γ ≈ 1 and NH ≈ 1020 cm−2 due to scattering in a hot plasma above the irradiated photosphere of HZ Her, a black-body component with kT ≈ 0.1 keV due to scattering of the emission from the X-ray-irradiated inner disk (McCray et al. 1982), and a minor contribution from photoionized optically thin plasma. There are traces of the Fe K complex. We stress that in our model, we do not need strong absorption of the reflected X-ray emission from HZ Her photosphere by cold material along the line of sight. The spectra obtained during short eROSITA scans with limited count statistics also do not require a partial-covering cold absorber with NH ~ 1022 cm−2 (Leahy & Chen 2019). We suggest that the observed orbital modulation of the X-ray emission in the low state is due to the changing view of the scattering hot plasma above the irradiated photosphere of HZ Her partially shadowed by the tilted, twisted accretion disk.
Our analysis excluded the orbital phases around the X-ray eclipse (0.0–0.13 and 0.87–1.0). However, these phases are very interesting because they can be used to probe the structure of the hot corona above the accretion disk (see the analysis of RXTE/PCA eclipses in Leahy 2015).
We conclude that one of the best-studied X-ray binaries, Her X-1/HZ Her, continues to reveal intriguing physical properties that can help us to understand the complicated structure of accretion flows around magnetized neutron stars. The first eROSITA observations have already significantly contributed to our improved understanding of this problem.
Acknowledgements
The authors thank the anonymous referee for useful notes that helped us improve the presentation of the results. The research is supported by the RFBR grant no. 18-502-12025 and the Interdisciplinary Scientific and Educational School of Moscow University’ Fundamental and Applied Space Research’. PM acknowledges the hospitality of the Max-Planck Institute forAstrophysics, where part of this work was done. This work is based on observations with eROSITA telescope onboard SRG observatory. The SRG observatory was built by Roskosmos in the interests of the Russian Academy of Sciences represented by its Space Research Institute (IKI) in the framework of the Russian Federal Space Program, with the participation of the Deutsches Zentrum für Luft- und Raumfahrt (DLR). The SRG/eROSITA X-ray telescope was built by a consortium of German Institutes led by MPE, and supported by DLR. The SRG spacecraft was designed, built, launched, and is operated by the Lavochkin Association and its subcontractors. The science data are downlinked via the Deep Space Network Antennae in Bear Lakes, Ussurijsk, and Baykonur, funded by Roskosmos. The eROSITA data used in this work were processed using the eSASS software system developed by the German eROSITA Consortium and proprietary data reduction and analysis software developed by the Russian eROSITA Consortium.
Appendix A X-ray scattering in an optically thin corona above the donor star
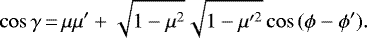
The radiation intensity I(τ, μ, ϕ) in a plane-parallel atmosphere with absorption and scattering obeys the radiative transfer equation, see Fig. A.1:
 (A.1)
(A.1)
where μ = cosθ, τ is the optical depth, dτ = −(κ + σ) dz, κ is the absorption coefficient, and σ is scattering coefficient.
The source function S(τ, μ, ϕ) is defined as follows
 (A.2)
(A.2)
where the integration is taken over all directions, λ = σ∕(κ + σ) is the single-scattering albedo, and x(μ, ϕ, μ′, ϕ′) is the scattering diagram. In the case of random scatterings, the scattering diagram depends only on the angle between the incident and scattering direction, x(cosγ),
 (A.3)
(A.3)
The first part in Eq. (A.2) allows for single-scattering of the incident radiation:
 (A.4)
(A.4)
where integration is taken over all directions, Iinc is the intensity of the direct radiation:
 (A.5)
(A.5)
F is the illumination flux perpendicular to the unit surface area, μ0 = cosθ0, θ0 is the angle between the normal to the surface and incident ray, and δ(...) is the Dirac delta function. By substituting Eq. (A.5) into Eq. (A.4), the integral Eq. (A.4) can be calculated to give:
 (A.6)
(A.6)
where
 (A.7)
(A.7)
With known source function S(τ, μ, ϕ), the intensity of the escaped radiation reads (Sobolev 1975; Nagirner 2001)
 (A.8)
(A.8)
If τ0 ≪ 1, only single scattered photons can be taken into account. Substituting Eq. (A.6) into Eq. (A.8) yields:
 (A.9)
(A.9)
The integral in Eq. (A.9) can be calculated to give:
 (A.10)
After expanding the exponent on the right-hand side of Eq. (A.10) in series, and substituting it to the Eq. (A.9) we obtain
 (A.11)
A useful quantity is the specific luminosity due to scattering:
![Mathematical equation: \begin{equation*} \frac{\textrm{d} L}{\textrm{d} \Omega} \mathrm{\left[\frac{erg}{s\, sr}\right]}\,{=}\,\int I_0 \mu {\textrm{d}}s,\end{equation*}](/articles/aa/full_html/2021/04/aa40145-20/aa40145-20-eq15.png) (A.12)
(A.12)
where the integral is calculated over the visible surface of the star. Usually, this integral is computed numerically.
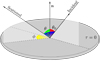 |
Fig. A.1 Scheme of scattering of radiation by the semi-infinite plane-parallel atmosphere. n is the normal vector to the surface, θ0 is the angle between the direction of the incident ray and normal vector n, θ is the angle between scattered ray and normal vector n, ϕ is the azimuth angle of scattered ray, and γ is the angle between the incident ray and scattered ray. |
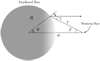 |
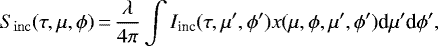
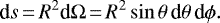
Fig. A.2 Spherical star illuminated by an isotropic point-like X-ray source. R is the radius of the star, a is the distance between star center and X-ray source, and r is the distance between X-ray source and surface of the star. The observer is located to the right-hand side of the figure. |
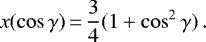
As an example, consider the simple case of a spherical star with radius R illuminated by an isotropic point-like X-ray sourcelocated at the distance a from the star center (see Fig. A.2):
 (A.13)
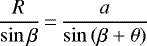
Here the distance r is defined by the cosine theorem:
 (A.14)
The surface element on the star is:
 (A.15)
Then Eq. (A.12) turns into:
![Mathematical equation: \begin{equation*} \frac{\textrm{d} L}{\textrm{d} \Omega} \mathrm{\left[\frac{erg}{s\, sr}\right]}\,{=}\,\frac{L_x}{4 \pi} \frac{R^2}{a^2} \frac{\lambda \tau_0}{2} \int_{0}^{\theta^{*}} x(\cos{\gamma_0}) \frac{\sin{\theta} \textrm{d}\theta}{\frac{5}{4} - \cos{\theta}}.\end{equation*}](/articles/aa/full_html/2021/04/aa40145-20/aa40145-20-eq19.png) (A.16)
(A.16)
For instance, in the case of spherically symmetric source x(cosγ0) = 1, the integral in Eq. (A.16) is simplified:
 (A.17)
For θ* = 30° and R∕a = 1∕2, the integral Eq. (A.17) is = ln3 ≈ 1.0986.
In the case of the Rayleigh scattering
 (A.18)
We can use the sine theorem
 (A.19)
to find the relation between the scattering angle γ and θ,
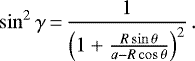 (A.20)
The integralin Eq. (A.16) becomes
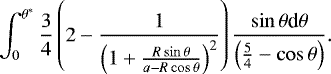 (A.21)
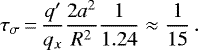
For θ* = 30° and R∕a = 1∕2, the integral Eq. (A.21) is ≈1.24. The difference between A14 and A17 is approximately 20%.
X-ray flux scattered by the corona at the distance d to the system at a given orbital phase is
![Mathematical equation: \begin{equation*} q' \left[\frac{\mathrm{erg}}{\mathrm{s\,cm^2}}\right]\,{=}\,\frac{1}{d^2} \frac{\textrm{d} L}{\textrm{d} \Omega} .\end{equation*}](/articles/aa/full_html/2021/04/aa40145-20/aa40145-20-eq25.png) (A.22)
(A.22)
The observable X-ray flux from the neutron star at the Main-on phases of 35-day cycle is
 (A.23)
Therefore, the fraction of the X-ray flux scattered by the corona is q′ ∕qx = 4π(dL∕dΩ)∕Lx.
The scattered flux q′ is approximately equal to the flux observable by eROSITA in the low state of Her X-1 (the power-law component at ~1 keV). The radiation flux from the central source qx is approximately equal to the flux observable during the Main-on; see, e.g., Oosterbroek et al. (1997); dal Fiume et al. (1998) (the power-law component at ~1 keV). Thus, the fraction of scattered radiation in the hot corona can be estimated from observations to be q′ ∕qx ≈ 0.01–0.02.
Assuming pure scattering (κ = 0, λ = 1, τ0 = τσ) and taking q′∕qx = 0.01, from Eq. (A.16) we find the scattering optical depth:
 (A.24)
Appendix B Scattering and absorption of X-ray photons in a semi-infinite atmosphere
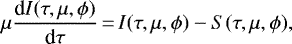
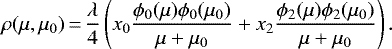
Theory of radiation transfer with electron scattering was developed in the classical works of Ambartsumian (1960), Chandrasekhar (1989) and Sobolev (1985). Zel’dovich & Shakura (1969), Shakura (1972) and Shakura & Sunyaev (1973) studied the effect of electron scattering on the spectrum emitted by an isothermal semi-infinite atmosphere. Such a spectrum is referred to as the “modified blackbody” (see, e.g., Shapiro & Teukolsky 1983, Rybicki & Lightman 1986, Frank et al. 2002 and Kato et al. 2008). The integral radiation flux from photospheres with electron scattering was calculated by Syunyaev & Shakura (1974). Following the classical papers, the solution of the radiation transfer equation Eq. (A.1) with the source function Eq. (A.2) reads:
 (B.1)
(B.1)
where ρ(μ, μ0) is the atmosphere brightness coefficient:
 (B.2)
(B.2)
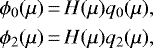
Following Busbridge (1960) ϕi(μ) is defined as:
 (B.3)
(B.3)
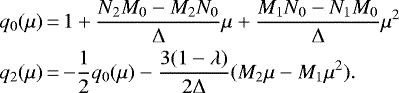
where q0(μ) and q2(μ) are the following polynomials (Sobolev 1968):
 (B.4)
(B.4)
Here M0, M1, M2, N0, N1, Δ coefficients are defined as:
![Mathematical equation: \begin{multline*} M_0\,{=}\,{-}\frac{\lambda}{2} (1-\lambda) \int_0^1 H(\mu) \left[ 3 \frac{x_2}{2} P_2(\mu) \right] \mu {\textrm{d}}\mu,\\ M_1\,{=}\,1{-}\frac{\lambda}{2} \int_0^1 H(\mu) \left[1 - \frac{x_2}{2} P_2(\mu) \right] \textrm{d}\mu,\\ M_2\,{=}\,{-}\frac{\lambda}{2} \int_0^1 H(\mu) \left[1 - \frac{x_2}{2} P_2(\mu) \right] \mu {\textrm{d}}\mu,\\ N_0\,{=}\,{-}\frac{\lambda}{4} x_2 3(1-\lambda) \int_0^1 H(\mu) P_2(\mu) \textrm{d}\mu,\\ N_1\,{=}\,\frac{\lambda}{4} x_2 3(1-\lambda) \int_0^1 H(\mu) P_2(\mu) \mu {\textrm{d}}\mu,\\ N_2\,{=}\,1{-}\frac{\lambda}{2} \int_0^1 H(\mu) \left[1 - \frac{x_2}{2} P_2(\mu) \right] \textrm{d}\mu,\\ \Delta\,{=}\,M_1 N_2 - M_2 N_1,\\ \end{multline*}](/articles/aa/full_html/2021/04/aa40145-20/aa40145-20-eq32.png) (B.5)
(B.5)
where P2(μ) is the 2d-order Legendre polynomial. For the Rayleigh scattering diagram Eq. (A.18), N2 = M1.
The function H(μ) is defined as(Chandrasekhar 1950):
 (B.6)
(B.6)
where ψ(μ) is the characteristic function:
![Mathematical equation: \begin{equation*}\psi(\mu)\,{=}\,\frac{\lambda}{2} \left[ 1 + \frac{x_2}{2}(3(1-\lambda)\mu^2 - 1)P_2(\mu) \right] \,. \end{equation*}](/articles/aa/full_html/2021/04/aa40145-20/aa40145-20-eq34.png) (B.7)
(B.7)
Here x2 = 0 for isotropic scattering, x2 = 1∕2 for the Rayleigh scattering (Sobolev 1968). The characteristic function Eq. (B.7) satisfies the condition:
 (B.8)
(B.8)
X-ray flux scattered by the photosphere at the distance d to the system at a given orbital phase is
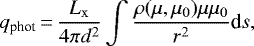 (B.9)
(B.9)
where the integral is taken over the visible part of the irradiated surface of the donor star.
 |
Fig. B.1 Ratio of the continuum X-ray fluxes at low state to Main-on state as a function of photon energy. A fluorescent iron line is not included. The dashed and solid lines show the calculated fraction of scattered X-ray radiation from the photosphere qphot ∕qx without and with taking into account the shadow from the disk, respectively. The gray area shows the observable (q′ + qphot)∕qx fraction withan addition of X-rays scattered in the corona (~0.01–0.02). |
In Fig. B.1, we plot the scattered flux ratio qphot∕qx from the cold photosphere of HZ Her as a function of the photon energy (the dashed and solid curves for calculation without and with taking into account the disk shadow, respectively). Besides, the gray strip shows the total ratio of scattered flux from the hot corona q′ and the reflected flux from the cold photosphere qphot to the flux from the central X-ray source qx. The low and upper contributions from the scattering corona 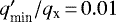 and
and  are used (see Appendix A).
We note that the theory described above was applied for the first time by Mescheryakov et al. (2011) to calculate the vertical structure of accretion disks.
References
- Abdallah, M. H., & Leahy, D. A. 2015, MNRAS, 453, 4222 [Google Scholar]
- Ambartsumian, V. A. 1960, Proceedings (in Russian), ed. V. V. Sobolev (Armenia: Armenian Academy of Sciences) [Google Scholar]
- Arnaud, K. A. 1996, ASP Conf. Ser., 101, 17 [Google Scholar]
- Bahcall, J. N., & Bahcall, N. A. 1972, ApJ, 178, L1 [Google Scholar]
- Basko, M. M., & Sunyaev, R. A. 1973, Ap&SS, 23, 117 [Google Scholar]
- Basko, M. M., Sunyaev, R. A., & Titarchuk, L. G. 1974, A&A, 31, 249 [NASA ADS] [Google Scholar]
- Bochkarev, N. G., 1989, Sov. Astron., 33, 638 [Google Scholar]
- Bochkarev, N. G. & Karitskaya, E. A. 1992, in Evolutionary Processes in Interacting Binary Stars, eds. Y. Kondo, R. Sistero, & R. S. Polidan (Berlin: Springer), 151, 449 [Google Scholar]
- Boynton, P. E. 1978, in Physics and Astrophysics of Neutron Stars and Black Holes, ed. R. Giacconi, & R. Ruffini (Amsterdam: North Holland Publishing), 111 [Google Scholar]
- Boynton, P. E., Canterna, R., Crosa, L., Deeter, J., & Gerend, D. 1973, ApJ, 186, 617 [Google Scholar]
- Brumback, M. C., Hickox, R. C., Fürst, F. S., et al. 2021, ApJ, 909, 186 [Google Scholar]
- Busbridge, I. W. 1960, The Mathematics of Radiative Transfer (Cambridge: Cambridge University Press) [Google Scholar]
- Cash, W. 1979, ApJ, 228, 939 [NASA ADS] [CrossRef] [Google Scholar]
- Chandrasekhar, S. 1950, Radiative Transfer (Oxford: Clarendon Press) [Google Scholar]
- Chandrasekhar, S. 1989, Selected Papers (Chicago: The University of Chicago Press) [Google Scholar]
- Cherepashchuk, A. M., Efremov, Y. N., Kurochkin, N. E., Shakura, N. I., & Sunyaev, R. A. 1972, Information Bulletin on Variable Stars (Hungary: Hungarian Academy of Sciences), 720 [Google Scholar]
- Cooke, B. A., & Page, C. G. 1975, Nature, 256, 712 [Google Scholar]
- Crampton, D. 1974, ApJ, 187, 345 [Google Scholar]
- dal Fiume, D., Orlandini, M., Cusumano, G., et al. 1998, A&A, 329, L41 [Google Scholar]
- Fabian, A. C., Pringle, J. E., & Rees, M. J. 1973, Nature, 244, 212 [Google Scholar]
- Frank, J., King, A., & Raine, D. J. 2002, Accretion Power in Astrophysics, 3rd edn (Cambridge: Cambridge University Press) [Google Scholar]
- Giacconi, R., Gursky, H., Kellogg, E., et al. 1973, ApJ, 184, 227 [Google Scholar]
- Grevesse, N., Noels, A., & Sauval, A. J. 1996, ASP Conf. Ser., 99, 117 [Google Scholar]
- HI4PI Collaboration (Ben Bekhti, N., et al.) 2016, A&A, 594, A116 [NASA ADS] [CrossRef] [EDP Sciences] [Google Scholar]
- İnam, S. C., & Baykal, A. 2005, MNRAS, 361, 1393 [NASA ADS] [CrossRef] [Google Scholar]
- Ji, L., Schulz, N., Nowak, M., Marshall, H. L., & Kallman, T. 2009, ApJ, 700, 977 [Google Scholar]
- Jimenez-Garate, M. A., Raymond, J. C., Liedahl, D. A., & Hailey, C. J. 2005, ApJ, 625, 931 [Google Scholar]
- Jones, C., & Forman, W. 1976, ApJ, 209, L131 [Google Scholar]
- Kallman, T., & Bautista, M. 2001, ApJS, 133, 221 [NASA ADS] [CrossRef] [Google Scholar]
- Kato, S., Fukue, J., & Mineshige, S. 2008, Black-Hole Accretion Disks: Towards a New Paradigm (Japan: Kyoto University Press) [Google Scholar]
- Klochkov, D., Staubert, R., Postnov, K., et al. 2008, A&A, 482, 907 [NASA ADS] [CrossRef] [EDP Sciences] [Google Scholar]
- Kolesnikov, D. A., Shakura, N. I., Postnov, K. A., et al. 2020, MNRAS, 499, 1747 [Google Scholar]
- Kosec, P., Fabian, A. C., Pinto, C., et al. 2020, MNRAS, 491, 3730 [NASA ADS] [Google Scholar]
- Krimm, H. A., Holland, S. T., Corbet, R. H. D., et al. 2013, ApJS, 209, 14 [NASA ADS] [CrossRef] [Google Scholar]
- Krolik, J. H., McKee, C. F., & Tarter, C. B. 1981, ApJ, 249, 422 [Google Scholar]
- Kuster, M., Wilms, J., Staubert, R., et al. 2005, A&A, 443, 753 [NASA ADS] [CrossRef] [EDP Sciences] [Google Scholar]
- Leahy, D. A. 1995, ApJ, 450, 339 [Google Scholar]
- Leahy, D. A. 1997, MNRAS, 287, 622 [Google Scholar]
- Leahy, D. A. 2000, MNRAS, 315, 735 [Google Scholar]
- Leahy, D. A. 2001, ApJ, 547, 449 [Google Scholar]
- Leahy, D. A. 2002, MNRAS, 334, 847 [Google Scholar]
- Leahy, D. A. 2003, MNRAS, 342, 446 [Google Scholar]
- Leahy, D. A. 2015, ApJ, 800, 32 [Google Scholar]
- Leahy, D. A., & Abdallah, M. H. 2014, ApJ, 793, 79 [Google Scholar]
- Leahy, D. A., & Chen, Y. 2019, ApJ, 871, 152 [Google Scholar]
- Leahy, D. A., & Dupuis, J. 2010, ApJ, 715, 897 [Google Scholar]
- Leahy, D. A., & Igna, C. 2011, ApJ, 736, 74 [Google Scholar]
- Leahy, D. A., & Marshall, H. 1999, ApJ, 521, 328 [Google Scholar]
- Leahy, D., & Wang, Y. 2020, ApJ, 902, 146 [Google Scholar]
- Leahy, D. A., & Yoshida, A. 1995, MNRAS, 276, 607 [Google Scholar]
- Leahy, D. A., Yoshida, A., & Matsuoka, M. 1994, ApJ, 434, 341 [Google Scholar]
- Lyutyi, V. M., Syunyaev, R. A., & Cherepashchuk, A. M. 1973, Sov. Astron., 17, 1 [Google Scholar]
- Mavromatakis, F. 1993, A&A, 273, 147 [NASA ADS] [Google Scholar]
- McCray, R. A., Shull, J. M., Boynton, P. E., et al. 1982, ApJ, 262, 301 [Google Scholar]
- Mehdipour, M., Kaastra, J. S., & Kallman, T. 2016, A&A, 596, A65 [NASA ADS] [CrossRef] [EDP Sciences] [Google Scholar]
- Mescheryakov, A. V., Shakura, N. I., & Suleimanov, V. F. 2011, Astron. Lett., 37, 311 [Google Scholar]
- Nagirner, D. I. 2001, Lectures on the Theory of Radiative Transfer (Russia: Saint Petersburg University) [Google Scholar]
- Oosterbroek, T., Parmar, A. N., Martin, D. D. E., & Lammers, U. 1997, A&A, 327, 215 [NASA ADS] [Google Scholar]
- Oosterbroek, T., Parmar, A. N., Orlandini, M., et al. 2001, A&A, 375, 922 [NASA ADS] [CrossRef] [EDP Sciences] [Google Scholar]
- Parmar, A. N., Pietsch, W., McKechnie, S., et al. 1985, Nature, 313, 119 [Google Scholar]
- Predehl, P., Andritschke, R., Arefiev, V., et al. 2021, A&A, 647, A1 (eROSITA SI) [EDP Sciences] [Google Scholar]
- Ramsay, G., Zane, S., Jimenez-Garate, M. A., den Herder, J.-W., & Hailey, C. J. 2002, MNRAS, 337, 1185 [Google Scholar]
- Reynolds, A. P., Quaintrell, H., Still, M. D., et al. 1997, MNRAS, 288, 43 [Google Scholar]
- Rybicki, G. B., & Lightman, A. P. 1986, Radiative Processes in Astrophysics (Hoboken: Wiley) [Google Scholar]
- Schreier, E., Giacconi, R., Gursky, H., et al. 1972, IAU Circ., 2412, 1 [Google Scholar]
- Scott, D. M., & Leahy, D. A. 1999, ApJ, 510, 974 [Google Scholar]
- Shakura, N. I. 1972, Sov. Astron., 16, 532 [Google Scholar]
- Shakura, N. I., & Sunyaev, R. A. 1973, A&A, 500, 33 [NASA ADS] [Google Scholar]
- Shakura, N. I., Ketsaris, N. A., Prokhorov, M. E., & Postnov, K. A. 1998, MNRAS, 300, 992 [Google Scholar]
- Shapiro, S. L., & Teukolsky, S. A. 1983, Black Holes, White Dwarfs, and Neutron Stars : the Physics of Compact Objects (Hoboken: Wiley) [Google Scholar]
- Sheffer, E. K., Kopaeva, I. F., Averintsev, M. B., et al. 1992, Sov. Astron., 36, 41 [NASA ADS] [Google Scholar]
- Sobolev, V. V. 1968, Sov. Astron., 12, 420 [Google Scholar]
- Sobolev, V. V. 1975, Light Scattering in Planetary Atmospheres (Oxford and New York: Pergamon Press) [Google Scholar]
- Sobolev, V. V. 1985, Course for Theoretical Astrophysics (Moscow: Nauka) [Google Scholar]
- Staubert, R., Klochkov, D., & Wilms, J. 2009, A&A, 500, 883 [NASA ADS] [CrossRef] [EDP Sciences] [Google Scholar]
- Staubert, R., Klochkov, D., Vybornov, V., Wilms, J., & Harrison, F. A. 2016, A&A, 590, A91 [Google Scholar]
- Staubert, R., Klochkov, D., Fürst, F., et al. 2017, A&A, 606, L13 [NASA ADS] [CrossRef] [EDP Sciences] [Google Scholar]
- Staubert, R., Ducci, L., Ji, L., et al. 2020, A&A, 642, A196 [Google Scholar]
- Syunyaev, R. A., & Shakura, N. I. 1974, Sov. Astron., 18, 60 [Google Scholar]
- Tananbaum, H., Gursky, H., Kellogg, E. M., et al. 1972, ApJ, 174, L143 [Google Scholar]
- Truemper, J., Pietsch, W., Reppin, C., et al. 1978, ApJ, 219, L105 [Google Scholar]
- Wilms, J., Allen, A., & McCray, R. 2000, ApJ, 542, 914 [Google Scholar]
- Zel’dovich, Y. B., & Shakura, N. I. 1969, Soviet Ast., 13, 175 [Google Scholar]
All Tables
Best-fit parameters obtained from fitting to the survey-averaged energy spectrum of Her X-1 from the first and the second SRG all-sky surveys.
All Figures
|
Fig. 1 Swift/BAT X-ray flux of Her X-1 as a function of time (Krimm et al. 2013). Vertical lines indicate the SRG/eROSITA observations of Her X-1. |
| In the text | |
|
Fig. 2 eROSITA spectra of Her X-1 obtained during the first and the second sky surveys (left and right panels, respectively). The solid black line shows the best-fit model (see Table 1), and the green dashed line shows the contribution from the proper emission of hot photoionized plasma (not detected in the first survey). Thin red and blue lines show the blackbody and power-law components, respectively. The bottom panels show the ratio of the data to the folded model. The visible excess in the residuals at higher energies is due to the Fe K complex and possible reflection from the cold photosphere of the optical star, which are unaccounted for in the spectral modeling (see Sect. 5). |
| In the text | |
|
Fig. 3 Schematic geometrical model of Her X-1/HZ Her used to calculate the X-ray orbital light curve. The model includes the Roche-lobe filling star (to the left), a hot corona above its X-ray-illuminated part (in orange), the accretion disk around the neutron star (to the right), and a hot halo above the accretion disk (disk corona, in yellow). Also shown is the accretion disk shadow on the illuminated part of HZ Her. |
| In the text | |
|
Fig. 4 X-ray flux of the power-law component in the energy range 0.2 – 8 keV from Her X-1 as a function of time during the first (A)and second (B) survey. The solid line is the theoretical flux calculated as described in Sect. 4. Figures inside plots show the brightness of scattered X-rays in the corona at the orbital phase 0.5. The white region is the X-ray shadow. The solid vertical lines indicate the orbital phase zero. The dotted vertical lines a, b, and c before and after the orbital phase zero indicate different accretion disk ingress and egress moments. Here, c–a and a–c intervals before and after phase zero, respectively, indicate the orbital phases where the donor star partially covers the accretion disk. Line b indicates expected moments of ingress and egress of the X-ray source. The a–a interval covers the total eclipse of the disk by the donor star. |
| In the text | |
|
Fig. A.1 Scheme of scattering of radiation by the semi-infinite plane-parallel atmosphere. n is the normal vector to the surface, θ0 is the angle between the direction of the incident ray and normal vector n, θ is the angle between scattered ray and normal vector n, ϕ is the azimuth angle of scattered ray, and γ is the angle between the incident ray and scattered ray. |
| In the text | |
|
Fig. A.2 Spherical star illuminated by an isotropic point-like X-ray source. R is the radius of the star, a is the distance between star center and X-ray source, and r is the distance between X-ray source and surface of the star. The observer is located to the right-hand side of the figure. |
| In the text | |
|
Fig. B.1 Ratio of the continuum X-ray fluxes at low state to Main-on state as a function of photon energy. A fluorescent iron line is not included. The dashed and solid lines show the calculated fraction of scattered X-ray radiation from the photosphere qphot ∕qx without and with taking into account the shadow from the disk, respectively. The gray area shows the observable (q′ + qphot)∕qx fraction withan addition of X-rays scattered in the corona (~0.01–0.02). |
| In the text | |
Current usage metrics show cumulative count of Article Views (full-text article views including HTML views, PDF and ePub downloads, according to the available data) and Abstracts Views on Vision4Press platform.
Data correspond to usage on the plateform after 2015. The current usage metrics is available 48-96 hours after online publication and is updated daily on week days.
Initial download of the metrics may take a while.