Fig. B.1
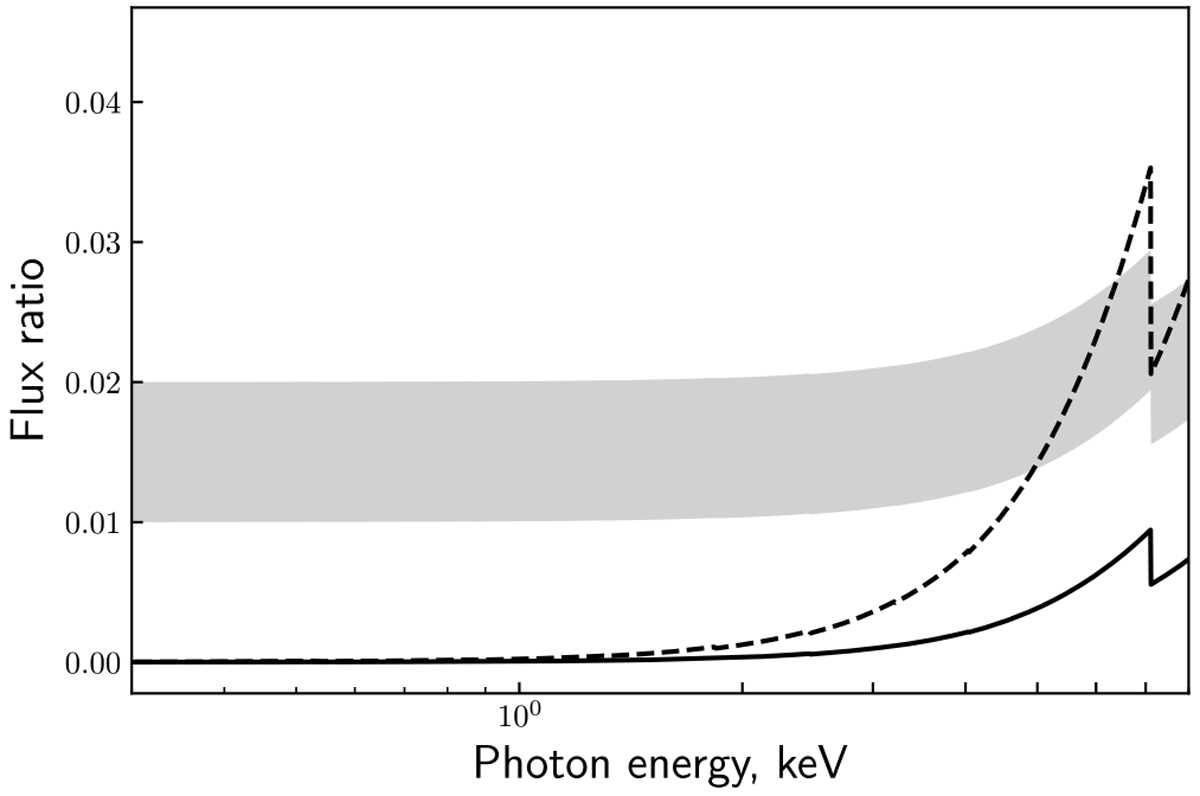
Ratio of the continuum X-ray fluxes at low state to Main-on state as a function of photon energy. A fluorescent iron line is not included. The dashed and solid lines show the calculated fraction of scattered X-ray radiation from the photosphere qphot ∕qx without and with taking into account the shadow from the disk, respectively. The gray area shows the observable (q′ + qphot)∕qx fraction withan addition of X-rays scattered in the corona (~0.01–0.02).
Current usage metrics show cumulative count of Article Views (full-text article views including HTML views, PDF and ePub downloads, according to the available data) and Abstracts Views on Vision4Press platform.
Data correspond to usage on the plateform after 2015. The current usage metrics is available 48-96 hours after online publication and is updated daily on week days.
Initial download of the metrics may take a while.