| Issue |
A&A
Volume 698, June 2025
|
|
|---|---|---|
| Article Number | A166 | |
| Number of page(s) | 9 | |
| Section | Astrophysical processes | |
| DOI | https://doi.org/10.1051/0004-6361/202555103 | |
| Published online | 11 June 2025 | |
Traces of wobbling accretion disk in X-ray pulsar Her X-1 from observations of the ART-XC telescope of the SRG observatory
1
Moscow State University, Sternberg Astronomical Institute, 119234 Moscow, Russia
2
Space Research Institute of the Russian Academy of Sciences, 117997 Moscow, Russia
⋆ Corresponding author: This email address is being protected from spambots. You need JavaScript enabled to view it.
Received:
10
April
2025
Accepted:
9
May
2025
Abstract
Long uninterrupted observations of the X-ray binary system Her X-1 were performed with the Mikhail Pavlinsky ART-XC telescope of the Spectrum-Röntgen-Gamma (SRG) X-ray Observatory in the 4–25 keV energy range with total exposure of about two days around the main turn-on of the X-ray source. We present the results of the timing and spectral analysis of these observations. The opening of the X-ray source is determined to occur at the orbital phase ϕb ≈ 0.25. The analysis of the X-ray light curve reveals the first direct observational evidence of the nutation of a tilted precessing accretion disk with a period of ≃0.87 days. The appearance of X-ray pulsations near the orbital phase ϕb ≃ 0.77 prior to the main turn-on at the maximum of the nutation variability has also been detected. During the X-ray eclipse, a non-zero X-ray flux is measured, which is presumably associated with the scattering of X-ray emission in a hot corona around the optical star illuminated by the X-rays from the central neutron star. An increase in the X-ray flux after the main turn-on can be described by the passage of radiation from the central source through a scattering corona above the precessing accretion disk.
Key words: binaries: eclipsing / X-rays: individuals: Her X-1
© The Authors 2025
 Open Access article, published by EDP Sciences, under the terms of the Creative Commons Attribution License (https://creativecommons.org/licenses/by/4.0), which permits unrestricted use, distribution, and reproduction in any medium, provided the original work is properly cited.
This article is published in open access under the Subscribe to Open model. This email address is being protected from spambots. You need JavaScript enabled to view it. to support open access publication.
1. Introduction
Her X-1/HZ Her is an eclipsing close X-ray binary system harboring a neutron star with a mass of ≈1.5 M⊙ and the optical star HZ Her with a mass of ≈2 M⊙. The HZ Her was known as a variable star with an unusually large optical variability. After the discovery of the X-ray pulsar Her X-1 and its optical identification with HZ Her, it became clear that it is part of a binary system consisting of a normal star and a neutron star (Tananbaum et al. 1972; Giacconi et al. 1973). The large optical variability of HZ Her is a consequence of the heating of the normal star by the X-ray radiation of the neutron star (the reflection effect; Cherepashchuk et al. 1972; Gerend & Boynton 1976; Shakura et al. 2021).
The X-ray flux from Her X-1 demonstrates several characteristic periodicities: X-ray pulsations with the neutron star’s spin period of Px ≈ 1.24 s; variability with the binary orbital motion with a period of Pb ≈ 1.7 days; and superorbital variability with a period of Pprec ≈ 35 days. The 35-day period is caused by the precession of an accretion disk around the neutron star in the retrograde direction to the orbital motion. Because of the large orbital inclination of the binary system i ≈ 90 deg (Crampton & Hutchings 1974), the central X-ray source is periodically eclipsed both by the optical star and the inclined accretion disk. The precession period consists of two X-ray bright states: a bright main-on state (lasting about seven orbits) followed by a low state with almost zero X-ray flux (lasting about four orbits), and a shorter secondary short-on state with lower X-ray flux than in the main-on state (lasting about five orbits) followed by the second low state (about four orbits). A detailed description of the phenomenology of the 35-day X-ray variability can be found in Shakura et al. (1998), Leahy & Wang (2020), Shakura et al. (2021). The X-ray luminosity of the source in the main-on state reaches Lx ≈ 1037 erg/s.
The accretion disk is the key element of the Her X-1 binary system that modulates the observed X-ray radiation. The shape and dynamics of the disk can be caused by the reaction of the asymmetrical coronal disk wind (Schandl & Meyer 1994), the radiation reaction from the central luminous X-ray source (Wijers & Pringle 1999), or, alternatively, by a combination of tidal effects in the binary system and dynamical effects of accreting gas stream leading to the precession of the disk with a period of 35 days (Shakura et al. 1998).
As shown in Scott et al. (2000), phenomenologically, precession of a twisted tilted accretion disk around a non-precessing neutron star is capable of explaining X-ray pulse profile changes in Her X-1. Alternatively, X-ray pulse profile changes can be explained by a model of a freely precessing neutron star (Postnov et al. 2013). Recently, evidence for triaxial neutron star precession was found in Fermi/GBM measurements of pulse period (Kolesnikov et al. 2022). Based on the RXTE observations, a model of a wobbling (nutating) accretion disk was proposed by Klochkov et al. (2006) to explain an anomalous appearance of the X-ray source during its low states, when the neutron star becomes visible for a short time to the observer.
Her X-1 has been observed many times by different X-ray observatories in various states (see, e.g., Tananbaum et al. 1972; Lutovinov et al. 2000; Klochkov et al. 2008; Leahy & Wang 2020; Caiazzo et al. 2022; Leahy & Sharma 2024, and references therein). An extended hot corona above the accretion disk was detected during X-ray eclipses of Her X-1 in RXTE observations (Leahy 2015). In the first two all-sky surveys by the eROSITA telescope (0.4–10 keV; Predehl et al. 2021) installed aboard the Spectrum-Röntgen-Gamma (SRG) observatory, the binary system was observed about once every four hours for ∼40 s during the low states, where the neutron star is screened from the observer by the accretion disk, with a full exposure of 570 and 588 s accumulated over several days (Shakura et al. 2021). The SRG/eROSITA observations revealed an orbital modulation of the soft X-ray flux caused by scattering on a hot corona above the disk and on a hot optically thin corona above the X-ray-heated atmosphere of HZ Her.
This paper presents the results of dedicated continuous observations of the X-ray source Her X-1 by the Mikhail Pavlinsky ART-XC telescope of the SRG observatory in the 4–25 keV energy range over ≈1.94 days near the main X-ray source turn-on. The observations captured the end of the second low state, the X-ray eclipse, the main turn-on, and the X-ray flux increase in the main-on state beginning. These phases of the 35-day period are used to search for the expected modulation of the X-ray flux during nutation oscillations of the disk in the low state and for studying features of the flux increase after the source’s turn-on.
2. ART-XC Telescope
The Mikhail Pavlinsky ART-XC telescope is one of two telescopes installed aboard the SRG X-ray observatory. The SRG observatory was launched in 2019 from the Baikonur cosmodrome to the L2 libration point of the Sun-Earth system (Sunyaev et al. 2021).
The ART-XC telescope consists of seven co-directional identical X-ray modules. The mirror system provides a field of view of ∼0.3 square degrees. The operating energy range of the ART-XC telescope is 4–30 keV, but the detectors can operate up to ∼120 keV, and the highest sensitivity is achieved at 4–12 keV. The time resolution of the telescope is ∼23 μs, and the angular resolution is ∼53″. Such parameters of the telescope make it possible not only to survey large areas of the sky, but also to carry out a detailed spectral and temporal analysis of the radiation from individual objects (see Pavlinsky et al. 2021, for a more detailed description of the instrument).
3. Observations and data analysis
Dedicated observations of Her X-1 were carried out by the SRG/ART-XC telescope August 25–26, 2023, near the moment of the main turn-on during the 541st precession cycle according to the ephemeris (Postnov et al. 2013),
 (1)
(1)
where N35 is the precession cycle number and Porb is the orbital period.
The ART-XC telescope data were processed using standard software ARTPRODUCTS V0.9 with the calibration data version CALDB 20230228. The photon registration times were adjusted to the solar system barycenter.
Figure 1 shows an image of the sky region around Her X-1 obtained with the ART-XC telescope over the entire observational period. For further analysis, only photons that fell inside a circle with a radius of 1 8 around the source were used. The background was estimated by collecting photons from a circular region with a radius of 3
 6 on the detectors that did not overlap with the region in which the source photons were extracted.
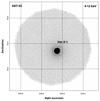 |
Fig. 1. ART-XC 4–12 keV image of the sky region around Her X-1. |
Figure 2 shows the light curves of Her X-1 in two energy bands (4–12 keV, 12–25 keV) with a time resolution of 500 s. The figure shows that the entire X-ray light curve can be roughly divided into three main parts: (A) the pre-eclipse part, when the system is in the off (low) state and the neutron star is screened from the observer by the accretion disk; (B) the eclipse of the X-ray source by the optical star, where the observed X-ray flux reaches its minimum; and (C) the post-eclipse part, when the source is opened to the observer. These stages will be discussed in more detail below.
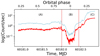 |
Fig. 2. ART-XC X-ray light curves of Her X-1 in two energy bands with a time resolution of 500 s (4–12 keV in blue and 12–25 keV in red). Zero orbital phase corresponds to the neutron star eclipse by the optical component. |
As seen from Fig. 2, the light curves are similar in the two energy ranges, and therefore they can be represented by the 4–12 keV light curve (where ART-XC has a larger effective area than in the 12–25 keV range). The features on the 12–25 keV light curve generally coincide with those in the 4–12 keV range, except for cases that will be considered separately. The orbital phases on the top of Fig. 2 are calculated using ephemerides from (Staubert et al. 2009).
Consider a geometrical model where the accretion disk centered on the neutron star is a circle with a radius of Rd ≈ 0.7rL1 (Paczynski 1977). Here rL1 ≈ a(0.5 + 0.227log10q) is the distance between the compact star and the inner Lagrangian point L1 (Frank et al. 2002), q = Mx/Mo ≈ 0.7 is the binary mass ratio in Her X-1 (Abubekerov et al. 2008; Leahy & Abdallah 2014), a is the binary orbital separation, and the optical star is filling its Roche lobe  , where
  (Eggleton 1983). Her X-1/HZ Her is an almost edge-on binary system, so in this geometrical model we can estimate specific orbital phases of the beginning and end of the eclipse of the accretion disk, α, and the neutron star, γ, by the optical star:
 (2)
(2)
(Note that these phases are almost insensitive to the assumed binary mass ratio, 0.5 < q < 1.) In this model, the beginning and end of the eclipse of the accretion disk and the neutron star are symmetric with respect to the zero orbital phase (full eclipse of the neutron star). Thus, the orbital phases α and γ are 0.87 and 0.93, respectively, and γ and α are 0.07 and 0.13, respectively (see Fig. 3, top panels).
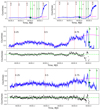 |
Fig. 3. ART-XC 4–12 keV (top left) and 12–25 keV (top right) light curves; enlarged pre-eclipse part of the 4–12 keV light curve (center) and enlarged pre-eclipse part of the 12–25 keV light curve (bottom). Blue error bars correspond to 300 s data binning, pink lines correspond to the best fit of the model parameters (3), and green solid circles correspond to the orbital phase up to which the model describes the observed light curve (the beginning of X-ray eclipse ingress). Light green vertical lines mark specific eclipse phases: α indicates the beginning of the accretion disk eclipse, and γ indicates the neutron star eclipse. Dark green vertical lines mark the end of the corresponding eclipse phases. Red dashed vertical lines show specific orbital phases. Black error bars show the model residuals. |
4. Results
4.1. Spectral analysis
Her X-1 spectra were constructed from ART-XC data using the XSPEC model HIGHECUT(POWERLAW)+GAUSSIAN (Staubert et al. 2020; Fuerst et al. 2013). Along the light curve, the spectral parameters remain approximately constant: Ecut ∼ 18 keV, Efold ∼ 8 keV, and photon index Γ ∼ 0.6. Almost constant spectral parameters in the range of 0.5-7 keV across the 35-day cycle were also reported from the recent analysis of Her X-1 observations by the AstroSat Soft X-ray Telescope (Leahy & Sharma 2024). However, a simple power-law model is sufficient to describe the spectrum in the X-ray eclipse. Moreover, immediately after the eclipse up to the main turn-on of the source, the spectrum becomes harder and an additional soft component appears (see below).
Figure 4 shows X-ray spectra in the X-ray eclipse (MJD 60182.15 – 60182.3, in green), in the pre-eclipse phase (MJD 60180.9 – 60181.5, in red), and in the main-on high state (MJD 60182.7 – 60182.9, in blue). In the post-eclipse phase before the main turn-on, the spectrum of a short hard peak (MJD 60182.5 – 60182.6) requires an additional soft component (in purple).
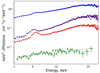 |
Fig. 4. ART-XC Her X-1 spectrum approximated by the HIGHECUT(POWERLAW)+GAUSSIAN model. From top to bottom: Main-on high state (MJD 60182.7 – 60182.9, in blue); low state before the main turn-on after the X-ray eclipse when the neutron star is screened by the accretion disk (MJD 60182.5 – 60182.6, in purple); low state before the X-ray eclipse (MJD 60180.9 – 60181.5, in red); and X-ray eclipse (MJD 60182.15 – 60182.3, in green). |
4.2. Analysis of the post-eclipse X-ray spectrum
As mentioned above, for a short time (MJD 60182.5 – 60182.6) after the X-ray eclipse before the main turn-on, an additional soft component not described by the HIGHECUT(POWERLAW)+GAUSSIAN model appears in the spectrum. This soft component can be described by the model of a black body with a temperature of kT ∼ 0.8 keV (see Fig. 5). At a source distance of ∼6.6 − 6.1 kpc (Reynolds et al. 1997; Leahy & Abdallah 2014), the observed soft excess corresponds to radiation from a spot with a size of ∼1 km.
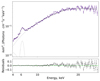 |
Fig. 5. Top: ART-XC Her X-1 a hard spectrum in the low state (see also Fig. 4). Dashed gray lines indicate models HIGHECUT(POWERLAW), GAUSSIAN, AND BLACKBODY. Dashed black line is the total model. Bottom: difference between the observation points and the total model. |
The emergence of this soft component for a short time before the main turn-on of Her X-1 can be related to the contribution of the hot spot from the interaction region between the gas stream from the inner Lagrangian point and the outer parts of the disk. The interaction of the infalling matter with the outer disk at Rout ∼ 1.6 × 1011cm produces shock with a temperature behind the front  (mp is the mass of a proton). At characteristic ballistic velocities of the stream
  , this temperature is close to that obtained from the spectral data.
4.3. Analysis of the pre-eclipse light curve
In this section, we consider the pre-eclipse part of the light curve in the low state, when the emission from the central source is screened by the accretion disk. The residual X-ray flux during the eclipse can be due to scattering of the X-ray emission from the neutron star on the corona above the X-ray illuminated atmosphere of the optical star and on the disk corona as suggested by the analysis of the SRG/eROSITA observations of Her X-1 (Shakura et al. 2021). As seen in Fig. 2, there is a marked increase in the flux near the orbital phase of 0.7 before the eclipse, followed by the eclipse ingress.
The observed smooth variability of the X-ray flux in the off-state before the main-on seen in Fig. 3 may be tentatively related to the change in the disk tilt (wobbling) due to tidal precession (Klochkov et al. 2006). While seen only once, the characteristic time and phase of the observed variability are very close to the expected values for the disk wobbling model. The nutation period of the disk is  . For Her X-1, Pnut = 0.87 days, or in units of cyclic frequency, ωnut ≈ 7.2 rad/d.
In the wobbling disk model, the pre-eclipse part of the light curve should be modulated with the nutation period, with an additional term responsible for a much longer disk precession, which can be considered linear over a timescale of several days:
 (3)
(3)
Here t is the time at a given moment, T0 is the time of the beginning of observations (fixed parameter), ωnut is the nutation frequency, ϕ is the phase of nutation oscillations, b is the parameter specifying the flux in the zero phase of the modulation, k is the linear slope coefficient of the precession component, and a0 is the amplitude of the nutation modulation.
In the middle panels of Fig. 3, we show the best approximation of the pre-eclipse part of the Her X-1 X-ray light curve with parameters given in Table 1. As can be seen in the bottom panels, there is a significant decrease in the registered emission before the eclipse, starting at about orbital phase 0.75, compared to the theoretical sine-like curve (purple line). Such a decrease in the flux before the eclipse ingress can be explained by the gas stream crossing the line of sight (the so-called pre-eclipse dip). As shown in Shakura et al. (1999), the pre-eclipse dip begins around orbital phase 0.8 in the precession phase before the main turn-on and smoothly transits into the X-ray eclipse ingress (see also Leahy & Igna 2011 for an analysis of dips from the entire RXTE/PCA observations).
Best-fit parameter of the nutation model (3).
We also note that starting at about orbital phase 0.65, the 4–12 keV flux behaves less smoothly than the 12–25 keV flux. Near orbital phase 0.75, small quasi-periodic fluctuations of the 4–12 keV flux are observed with the characteristic time of ≈2000 − 3000 s, which roughly corresponds to the Keplerian time of the orbit with a radius of 1010 cm around the neutron star. Since such pronounced peaks are not observed in the hard band, we can assume that such fluctuations of the X-ray emission are associated with the emission of a bright spot in the region of the accretion stream collision with the inner regions of a tilted disk (Shakura et al. 1999).
Our analysis suggests that the sine-like modulation observed by ART-XC in the pre-eclipse part of the Her X-1 X-ray light curve in the low state may be well explained by the wobbling disk model. Should this modulation be found persistent from longer observations (for example, phase-connected in both off-states), it would provide a direct observational manifestation of the nutation of the precessing accretion disk in the Her X-1/HZ Her system.
4.4. Analysis of the X-ray eclipse
An analysis of RXTE X-ray eclipses in Her X-1 was previously done by (Leahy 2015). In this section, we consider the eclipsing part of the ART-XC light curve. Figure 2 shows that the X-ray emission at the zero orbital phase does not disappear completely. In the analysis by (Leahy 2015), the residual emission in the X-ray eclipse was explained by scattering on a corona above the accretion disk. Here, we consider an alternative explanation that this residual emission may be caused by the presence of an X-ray halo around the observer-facing part of the optical star eclipsing the X-ray source. Note that the light curve in the eclipse is asymmetric with respect to the zero orbital phase, suggesting a complex shape of the tilted accretion disk producing asymmetric X-ray illumination of the optical star. As a result of the nonuniform heating of the optical star atmosphere by the central X-ray source, the parts of the optically thin scattering corona above the heated atmosphere of the star, visible during the X-ray eclipse ingress and egress, differ from each other.
To estimate the flux scattered by the optical star corona, we assumed a ring-like X-ray halo around the optical star. Then we estimated the ratio of the area of the ring-like halo visible at orbital phase 0 to that of the hot corona above the atmosphere of the optical star visible at orbital phase 0.5, which was found in (Shakura et al. 2021). Considering the ratio of the corona thickness to the optical star radius  , the ratio of the radiation scattered by the corona to the total emission from an X-ray source in the energy range up to 8 keV near orbital phase 0.5 can be estimated as
  (Shakura et al. 2021). The flux from the hot corona above the optical star at different orbital phases depends on its apparent area, from which we obtained an estimate for the expected flux ratio near orbital phase zero:
  . From the ART-XC data, the observed ratio of the 4–12 keV flux during the X-ray eclipse near the zero orbital phase to the high-state flux is approximately
  , which is in good agreement with the above model estimates.
4.5. The main turn-on time of the source
Figure 6 shows that the main source turn-on – a sharp increase in the flux from Her X-1 – occurs much later than the neutron star’s exit from the eclipse by the optical star (phase α = 0.13), which is expected in the geometrical model used. This means that the neutron star remains screened from the observer by the tilted accretion disk after the eclipse, and the turn-on occurs near the orbital phase at ∼0.2.
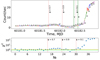 |
Fig. 6. Top: ART-XC 4–12 keV light curve of Her X-1 divided into 40 equal time intervals. Green lines mark the specific eclipse phases: γ = 0.07 is the opening of the neutron star by the optical star, and α = 0.13 is the opening of the entire accretion disk by the optical star (see text). Bottom: Dependence of the χ2 value of the deviations of the count rate in the X-ray pulse from the constant in each time interval. The green line corresponds to χ2 = 1, and the orange line to the 2σ deviation of the pulsed flux from the constant. |
The moment of the pulsations’ appearance when the source is opened by the precessing disk is determined by the presence of a significant deviation of the pulse profile from constant. To determine the moment of the turn-on, the 4–12 keV light curve was divided into short equal-time intervals (≈4300 c), and in each time interval the count rates were convolved with the pulsation period of the neutron star (Fig. 6). The pulsation period was determined from the last time interval (number 39 in Fig. 6), when the neutron star is fully opened to the observer and the pulsating fraction of the emission is maximal, corrected for orbital motion: Pspin = 1.2376986(1) s.
In the bottom panel of Fig. 6, there are points exceeding a 2σ deviation from constant pulse profile inside the interval (orange line). To test the significance of these outliers, a similar plot was constructed using the moving average method (Fig. 7).
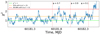 |
Fig. 7. χ2 of the 4–12 keV pulse profile count rate deviations from constant constructed by the moving average method for time intervals of 4300 s with a 100 s shift. The green line corresponds to χ2 = 1; the orange and red lines correspond to 2σ and 4σ flux deviations from constant, respectively. |
Figure 7 clearly shows that significant pulsations beyond the 4σ (red line) boundary were observed near orbital phase ≈0.77 before the eclipse by the optical star. The observed 4–12 and 12–25 keV pulse profiles in the time interval MJD = 60181.848 – 60181.898 are shown in Fig. 8 (black dots).
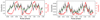 |
Fig. 8. Pulse profiles (4–12 keV on the left, 12–25 keV on the right) near the orbital phase 0.77 (MJD = 60181.848 – 60181.898; black color, scale on the left). Modeling of the pulse profile near orbital phase 0.77 by sinusoidal curves (green color). For comparison, the pulse profiles after the main turn-on in time interval #39 in Fig. 6 are shown (red color, scale on the right). |
These profiles can be approximated by a characteristic sinusoidal trend (green curves in Fig. 8). The profiles themselves seem to have a small shift relative to the red pulse profiles obtained in the high state (interval #39). This may be caused by the fact that, before the eclipse, the observed pulse profile was not seen directly from the neutron star, but, for example, represented reflected radiation on the tilted twisted accretion disk, which leads to a quasi-sinusoidal shape of the profile with an additional phase shift. However, we cannot numerically estimate this phase shift or the distance to the reflecting region of the twisted disk with sufficient reliability because of the very different shape of the pulse profiles.
Thus, we can conclude that the appearance of X-ray pulsations near orbital phase 0.77 is not the direct emission of the source, since the pulse profile is strongly blurred and strongly affected by scattering on the corona of the accretion disk. Nevertheless, the fact that the pulse signal was detected before the main turn-on is remarkable because it falls at the maximum of the sinusoidal flux fluctuation due to the disk nutation, which is geometrically favorable for seeing the scattered emission from a neutron star still covered by the disk at this precessional phase.
Figure 9 shows the pulse profiles near the main turn-on in the post-eclipse part. This figure clearly shows how the profiles change as the X-ray components are opened by the optical star: in the interval #30, where the neutron star is already open and the accretion disk is partially open, no pulsations are seen; in intervals #31–33, where the accretion disk emerges from the eclipse, smoothed profiles similar to those observed before the eclipse gradually appear; and by intervals #34–35, characteristic Her X-1 profiles appear. This interval includes the moment of orbital phase 0.2, which we will consider to be the phase of the main X-ray source turn-on.
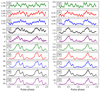 |
Fig. 9. Pulse profiles in the post-eclipse 4–12 keV (left) and 12–25 keV (right) light curves. Time intervals are numbered as in Fig. 6. |
4.6. Modeling of the exponential rise
In this section, we discuss in more detail the time evolution of the X-ray flux in the post-eclipse light curve. Following (Kuster et al. 2005), we consider that the X-ray radiation from the neutron star reaches the observer, partially or completely absorbed and scattered in the disk corona, differently depending on the energy range.
The exponential flux increase after the turn-on can be modeled assuming that the influence of absorption is negligible, and the main role in the observed flux change is played by scattering in the disk corona associated with the change in the number of particles along the line of sight during the precessional motion of the disk:  . To approximate the X-ray light curve after the main turn-on, and taking into account the observed very sharp dependence of the logarithm of the flux on time, we approximated the effective optical thickness using a function that exponentially depends on time
  . Subsequently, the flux rising is described as
![Mathematical equation: $$ \begin{aligned} { F(t) = (F_0-F_{\rm disk}) \exp \left[-{A} {\exp \left(-\frac{t-T_0}{b}\right)}\right]+F_{\rm disk}}, \end{aligned} $$](/articles/aa/full_html/2025/06/aa55103-25/aa55103-25-eq17.gif) (4)
(4)
where T0 is the initial time at which the flux growth starts, A is a dimensionless constant, b is a constant coefficient corresponding to the characteristic time of the flux change, and F0, Fdisk are constant fluxes corresponding to contributions from the neutron star and the disk. The choice of such a function instead of, for instance, a polynomial approximation is also convenient because it provides the desirable asymptotics F(t ≪ T0)→Fdisk, F(t ≫ T0)→F0.
The plots for the best-fit exponential flux growth in the 4–12 and 12–25 keV ranges after the main Her X-1 turn-on are shown in Fig. 10, respectively (see parameters in Table 3). As seen, the model curve in general well describes the observed sharp increase in the flux during the opening of the neutron star by the precessing disk.
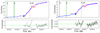 |
Fig. 10. Modeling of the 4–12 keV (left) and 12–25 keV (right) flux on the exponential rise after the main Her X-1 turn-on, error bars correspond to 500 s data binning. Green filled circles mark the initial rise time of the X-ray flux T0 (falls inside interval #34 in Fig. 6). Red dots are ignored as they correspond to the X-ray flux dip caused by the expected inhomogeneous gas stream from the Lagrangian point L1. In the bottom panel, black dots with error bars show the difference between the observed and model count rate. |
The obtained parameters of the phenomenological model (4) are insufficient for unambiguous conclusions about the detailed physical structure of the scattering corona of the disk. However, the model allows us to trace the general behavior of the light curve in both energy ranges, which is well described by scattering of radiation in the inhomogeneous corona of the accretion disk. The parameter b, responsible for the flux increase rate, has close values in both energy ranges, while the entire difference in the flux growth is encoded in the time-independent parameter A (see Fig. 11).
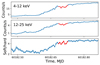 |
Fig. 11. Top: 4–12 keV light curve of the exponential flux growth. Middle panel: Corresponding 12–25 keV light curve. Bottom panel: softness of the X-ray light curve during the emission growth after the main turn-on. Red dots mark the X-ray dip as in Figs. 9–10. |
The X-ray hardness plot in the bottom panel of Fig. 11 shows that, during the phase of exponential flux growth, the light curve varies across different energy ranges, but the saturation of the flux increase occurs simultaneously in both ranges. This can also be seen in Table 2, where the value of parameter b is similar in different energy ranges, while the parameter A is very different. The harder emission up to the main turn-on is due to the preferential scattering of hard photons in a hot corona above the X-ray-heated atmosphere of the optical star, as expected in the model of Her X-1 (Shakura et al. 2021).
Parameter values of the exponential growth model (4).
In Figs. 3 and 10 in the post-eclipse light curve, a short peak before the onset of quasi-exponential growth near orbital phase 0.18 (interval #33 in Fig. 6) attracts attention. The peak is more pronounced in the hard range, which can also be seen in the spectrum. Figure 9 shows that, in the 12–25 keV energy range, the pulsations from the neutron star only appear slightly earlier than in the 4–12 keV range, in interval #33. Such a flux behavior can be explained by the fact that the registered radiation at this orbital phase may arrive scattered or re-reflected not only on the accretion disk but also on the hot corona above the heated atmosphere of the optical star. It is known that the X-ray reflection albedo increases with the photon energy (Mescheryakov et al. 2011), which leads to a more pronounced reflected 12–25 keV pulse emission in interval #33 in Fig. 6. However, we do not consider this moment to be the onset of the main turn-on, since the neutron star must still be obscured by the tilted precessing accretion disk. Of course, to confirm that the appearance of this hard peak is spurious, new observations of Her X-1 at this phase are needed.
5. Conclusion
We present results of the Mikhail Pavlinsky ART-XC telescope observations of the eclipsing Her X-1/HZ Her X-ray binary system at the end of the second low state near the moment of the main source turn-on in the interval MJD = 60180.89 – 60182.87. A sine-like modulation of non-pulsating X-ray emission in the off state with a characteristic time of 0.87 days may be explained by tidal wobbling of the precessing accretion disk around the neutron star suggested by (Klochkov et al. 2006).
The 4–12 keV light curve shows a brief appearance of X-ray pulsations in the off state near orbital phase 0.8 at the maximum of the proposed nutation variability, which may temporarily open the central source before the main-on (see Fig. 6 in Klochkov et al. 2006). In our observations, the Her X-1 main-on is found to occur near orbital phase 0.2, which is close to phases 0.25 and 0.75 where the tidal nutation of the precessing accretion disk is mostly pronounced (Levine & Jernigan 1982; Katz et al. 1982). However, main turn-on times in Her X-1 have not always been found near these phases (Leahy & Dupuis 2010; Leahy & Wang 2020), and the model of tidal wobbling of the accretion disk should be further checked through future observations.
A residual X-ray emission during the X-ray eclipse has been measured. The observed flux is consistent with a model of scattered radiation in an optically thin hot corona above the X-ray-illuminated photosphere of the optical star that was detected in Her X-1 observations with the SRG/eROSITA telescope (Shakura et al. 2021).
We analyzed the X-ray light curve following the main turn-on of Her X-1 and show that the flux growth can be approximated by taking into account only scattering and the time evolution of the column density associated with changes in the number of particles along the line of sight as the source is being opened by the outer edge of the precessing accretion disk.
Acknowledgments
This work is based on observations with the Mikhail Pavlinsky ART-XC telescope, hard X-ray instrument on board the SRG observatory. The SRG observatory was created by Roskosmos in the interests of the Russian Academy of Sciences represented by its Space Research Institute (IKI) in the framework of the Russian Federal Space Program, with the participation of Germany. The ART-XC team thanks the Roscosmos State Corporation, the Russian Academy of Sciences, and Rosatom State Corporation for supporting the ART-XC telescope, as well as the JSC Lavochkin Association and partners for manufacturing and running the Navigator spacecraft and platform. The work was supported by the Minobrnauki RF grant 075-15-2024-647.
References
- Abubekerov, M. K., Antokhina, E. A., Cherepashchuk, A. M., & Shimanskii, V. V. 2008, Astron. Rep., 52, 379 [Google Scholar]
- Caiazzo, I., Doroshenko, V., Tsygankov, S., et al. 2022, American Astronomical Society Meeting Abstracts, 240, 246.03 [Google Scholar]
- Cherepashchuk, A. M., Efremov, Y. N., Kurochkin, N. E., Shakura, N. I., & Sunyaev, R. A. 1972, Information Bulletin on Variable Stars, 720 [Google Scholar]
- Crampton, D., & Hutchings, J. B. 1974, ApJ, 191, 483 [Google Scholar]
- Eggleton, P. P. 1983, ApJ, 268, 368 [Google Scholar]
- Frank, J., King, A., & Raine, D. J. 2002, Accretion Power in Astrophysics, 3rd edn. (Cambridge: Cambridge University Press) [Google Scholar]
- Fuerst, F., Grefenstette, B. W., Staubert, R., et al. 2013, ArXiv e-prints [arXiv:1309.5361] [Google Scholar]
- Gerend, D., & Boynton, P. E. 1976, ApJ, 209, 562 [NASA ADS] [CrossRef] [Google Scholar]
- Giacconi, R., Gursky, H., Kellogg, E., et al. 1973, ApJ, 184, 227 [Google Scholar]
- Katz, J. I., Anderson, S. F., Margon, B., & Grandi, S. A. 1982, ApJ, 260, 780 [NASA ADS] [CrossRef] [Google Scholar]
- Klochkov, D., Staubert, R., Postnov, K., et al. 2008, A&A, 482, 907 [NASA ADS] [CrossRef] [EDP Sciences] [Google Scholar]
- Klochkov, D. K., Shakura, N. I., Postnov, K. A., et al. 2006, Astron. Lett., 32, 804 [Google Scholar]
- Kolesnikov, D., Shakura, N., & Postnov, K. 2022, MNRAS, 513, 3359 [Google Scholar]
- Kuster, M., Wilms, J., Staubert, R., et al. 2005, A&A, 443, 753 [NASA ADS] [CrossRef] [EDP Sciences] [Google Scholar]
- Leahy, D., & Sharma, R. 2024, Universe, 10, 298 [Google Scholar]
- Leahy, D., & Wang, Y. 2020, ApJ, 902, 146 [Google Scholar]
- Leahy, D. A. 2015, ApJ, 800, 32 [Google Scholar]
- Leahy, D. A., & Abdallah, M. H. 2014, ApJ, 793, 79 [Google Scholar]
- Leahy, D. A., & Dupuis, J. 2010, ApJ, 715, 897 [Google Scholar]
- Leahy, D. A., & Igna, C. 2011, ApJ, 736, 74 [Google Scholar]
- Levine, A. M., & Jernigan, J. G. 1982, ApJ, 262, 294 [Google Scholar]
- Lutovinov, A. A., Grebenev, S. A., Pavlinsky, M. N., & Sunyaev, R. A. 2000, Astron. Lett., 26, 691 [Google Scholar]
- Mescheryakov, A. V., Shakura, N. I., & Suleimanov, V. F. 2011, Astron. Lett., 37, 311 [Google Scholar]
- Paczynski, B. 1977, ApJ, 216, 822 [CrossRef] [Google Scholar]
- Pavlinsky, M., Tkachenko, A., Levin, V., et al. 2021, A&A, 650, A42 [EDP Sciences] [Google Scholar]
- Postnov, K., Shakura, N., Staubert, R., et al. 2013, MNRAS, 435, 1147 [CrossRef] [Google Scholar]
- Predehl, P., Andritschke, R., Arefiev, V., et al. 2021, A&A, 647, A1 [EDP Sciences] [Google Scholar]
- Reynolds, A. P., Quaintrell, H., Still, M. D., et al. 1997, MNRAS, 288, 43 [Google Scholar]
- Schandl, S., & Meyer, F. 1994, A&A, 289, 149 [NASA ADS] [Google Scholar]
- Scott, D. M., Leahy, D. A., & Wilson, R. B. 2000, ApJ, 539, 392 [NASA ADS] [CrossRef] [Google Scholar]
- Shakura, N. I., Ketsaris, N. A., Prokhorov, M. E., & Postnov, K. A. 1998, MNRAS, 300, 992 [Google Scholar]
- Shakura, N. I., Prokhorov, M. E., Postnov, K. A., & Ketsaris, N. A. 1999, A&A, 348, 917 [NASA ADS] [Google Scholar]
- Shakura, N. I., Kolesnikov, D. A., Medvedev, P. S., et al. 2021, A&A, 648, A39 [NASA ADS] [CrossRef] [EDP Sciences] [Google Scholar]
- Staubert, R., Ducci, L., Ji, L., et al. 2020, A&A, 642, A196 [NASA ADS] [CrossRef] [EDP Sciences] [Google Scholar]
- Staubert, R., Klochkov, D., & Wilms, J. 2009, A&A, 500, 883 [NASA ADS] [CrossRef] [EDP Sciences] [Google Scholar]
- Sunyaev, R., Arefiev, V., Babyshkin, V., et al. 2021, A&A, 656, A132 [NASA ADS] [CrossRef] [EDP Sciences] [Google Scholar]
- Tananbaum, H., Gursky, H., Kellogg, E. M., et al. 1972, ApJ, 174, L143 [NASA ADS] [CrossRef] [Google Scholar]
- Wijers, R. A. M. J., & Pringle, J. E. 1999, MNRAS, 308, 207 [NASA ADS] [CrossRef] [Google Scholar]
All Tables
All Figures
|
Fig. 1. ART-XC 4–12 keV image of the sky region around Her X-1. |
| In the text | |
|
Fig. 2. ART-XC X-ray light curves of Her X-1 in two energy bands with a time resolution of 500 s (4–12 keV in blue and 12–25 keV in red). Zero orbital phase corresponds to the neutron star eclipse by the optical component. |
| In the text | |
|
Fig. 3. ART-XC 4–12 keV (top left) and 12–25 keV (top right) light curves; enlarged pre-eclipse part of the 4–12 keV light curve (center) and enlarged pre-eclipse part of the 12–25 keV light curve (bottom). Blue error bars correspond to 300 s data binning, pink lines correspond to the best fit of the model parameters (3), and green solid circles correspond to the orbital phase up to which the model describes the observed light curve (the beginning of X-ray eclipse ingress). Light green vertical lines mark specific eclipse phases: α indicates the beginning of the accretion disk eclipse, and γ indicates the neutron star eclipse. Dark green vertical lines mark the end of the corresponding eclipse phases. Red dashed vertical lines show specific orbital phases. Black error bars show the model residuals. |
| In the text | |
|
Fig. 4. ART-XC Her X-1 spectrum approximated by the HIGHECUT(POWERLAW)+GAUSSIAN model. From top to bottom: Main-on high state (MJD 60182.7 – 60182.9, in blue); low state before the main turn-on after the X-ray eclipse when the neutron star is screened by the accretion disk (MJD 60182.5 – 60182.6, in purple); low state before the X-ray eclipse (MJD 60180.9 – 60181.5, in red); and X-ray eclipse (MJD 60182.15 – 60182.3, in green). |
| In the text | |
|
Fig. 5. Top: ART-XC Her X-1 a hard spectrum in the low state (see also Fig. 4). Dashed gray lines indicate models HIGHECUT(POWERLAW), GAUSSIAN, AND BLACKBODY. Dashed black line is the total model. Bottom: difference between the observation points and the total model. |
| In the text | |
|
Fig. 6. Top: ART-XC 4–12 keV light curve of Her X-1 divided into 40 equal time intervals. Green lines mark the specific eclipse phases: γ = 0.07 is the opening of the neutron star by the optical star, and α = 0.13 is the opening of the entire accretion disk by the optical star (see text). Bottom: Dependence of the χ2 value of the deviations of the count rate in the X-ray pulse from the constant in each time interval. The green line corresponds to χ2 = 1, and the orange line to the 2σ deviation of the pulsed flux from the constant. |
| In the text | |
|
Fig. 7. χ2 of the 4–12 keV pulse profile count rate deviations from constant constructed by the moving average method for time intervals of 4300 s with a 100 s shift. The green line corresponds to χ2 = 1; the orange and red lines correspond to 2σ and 4σ flux deviations from constant, respectively. |
| In the text | |
|
Fig. 8. Pulse profiles (4–12 keV on the left, 12–25 keV on the right) near the orbital phase 0.77 (MJD = 60181.848 – 60181.898; black color, scale on the left). Modeling of the pulse profile near orbital phase 0.77 by sinusoidal curves (green color). For comparison, the pulse profiles after the main turn-on in time interval #39 in Fig. 6 are shown (red color, scale on the right). |
| In the text | |
|
Fig. 9. Pulse profiles in the post-eclipse 4–12 keV (left) and 12–25 keV (right) light curves. Time intervals are numbered as in Fig. 6. |
| In the text | |
|
Fig. 10. Modeling of the 4–12 keV (left) and 12–25 keV (right) flux on the exponential rise after the main Her X-1 turn-on, error bars correspond to 500 s data binning. Green filled circles mark the initial rise time of the X-ray flux T0 (falls inside interval #34 in Fig. 6). Red dots are ignored as they correspond to the X-ray flux dip caused by the expected inhomogeneous gas stream from the Lagrangian point L1. In the bottom panel, black dots with error bars show the difference between the observed and model count rate. |
| In the text | |
|
Fig. 11. Top: 4–12 keV light curve of the exponential flux growth. Middle panel: Corresponding 12–25 keV light curve. Bottom panel: softness of the X-ray light curve during the emission growth after the main turn-on. Red dots mark the X-ray dip as in Figs. 9–10. |
| In the text | |
Current usage metrics show cumulative count of Article Views (full-text article views including HTML views, PDF and ePub downloads, according to the available data) and Abstracts Views on Vision4Press platform.
Data correspond to usage on the plateform after 2015. The current usage metrics is available 48-96 hours after online publication and is updated daily on week days.
Initial download of the metrics may take a while.