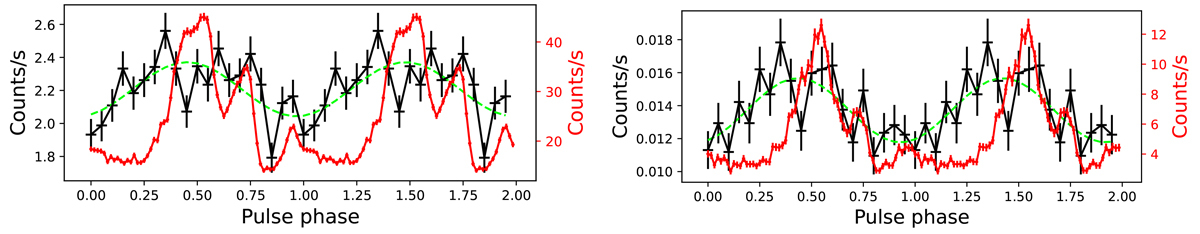
Fig. 8.
Download original image
Pulse profiles (4–12 keV on the left, 12–25 keV on the right) near the orbital phase 0.77 (MJD = 60181.848 – 60181.898; black color, scale on the left). Modeling of the pulse profile near orbital phase 0.77 by sinusoidal curves (green color). For comparison, the pulse profiles after the main turn-on in time interval #39 in Fig. 6 are shown (red color, scale on the right).
Current usage metrics show cumulative count of Article Views (full-text article views including HTML views, PDF and ePub downloads, according to the available data) and Abstracts Views on Vision4Press platform.
Data correspond to usage on the plateform after 2015. The current usage metrics is available 48-96 hours after online publication and is updated daily on week days.
Initial download of the metrics may take a while.