Fig. 10.
Download original image
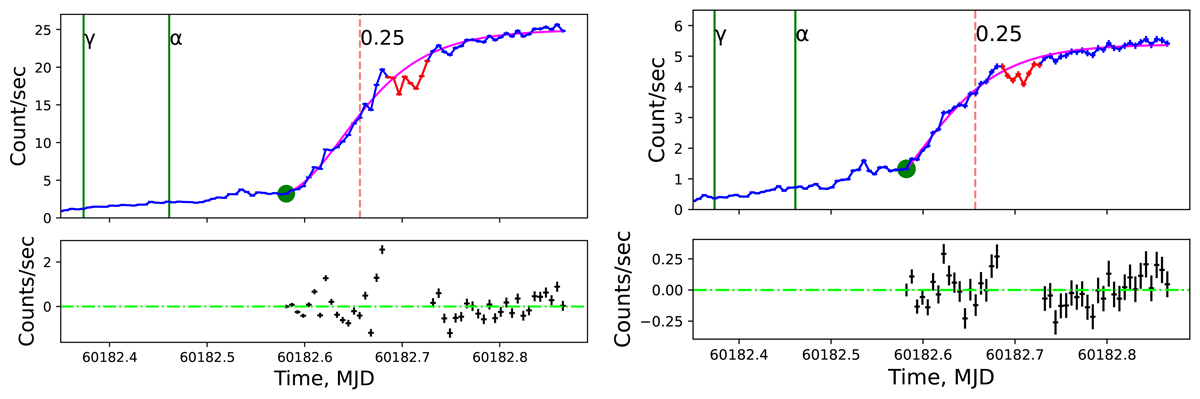
Modeling of the 4–12 keV (left) and 12–25 keV (right) flux on the exponential rise after the main Her X-1 turn-on, error bars correspond to 500 s data binning. Green filled circles mark the initial rise time of the X-ray flux T0 (falls inside interval #34 in Fig. 6). Red dots are ignored as they correspond to the X-ray flux dip caused by the expected inhomogeneous gas stream from the Lagrangian point L1. In the bottom panel, black dots with error bars show the difference between the observed and model count rate.
Current usage metrics show cumulative count of Article Views (full-text article views including HTML views, PDF and ePub downloads, according to the available data) and Abstracts Views on Vision4Press platform.
Data correspond to usage on the plateform after 2015. The current usage metrics is available 48-96 hours after online publication and is updated daily on week days.
Initial download of the metrics may take a while.