Open Access
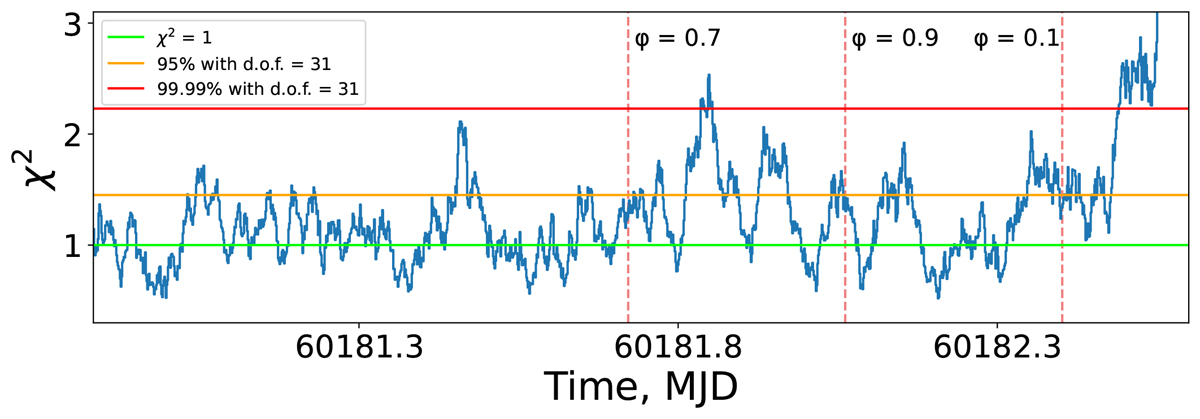
Fig. 7.
Download original image
χ2 of the 4–12 keV pulse profile count rate deviations from constant constructed by the moving average method for time intervals of 4300 s with a 100 s shift. The green line corresponds to χ2 = 1; the orange and red lines correspond to 2σ and 4σ flux deviations from constant, respectively.
Current usage metrics show cumulative count of Article Views (full-text article views including HTML views, PDF and ePub downloads, according to the available data) and Abstracts Views on Vision4Press platform.
Data correspond to usage on the plateform after 2015. The current usage metrics is available 48-96 hours after online publication and is updated daily on week days.
Initial download of the metrics may take a while.