Fig. 3.
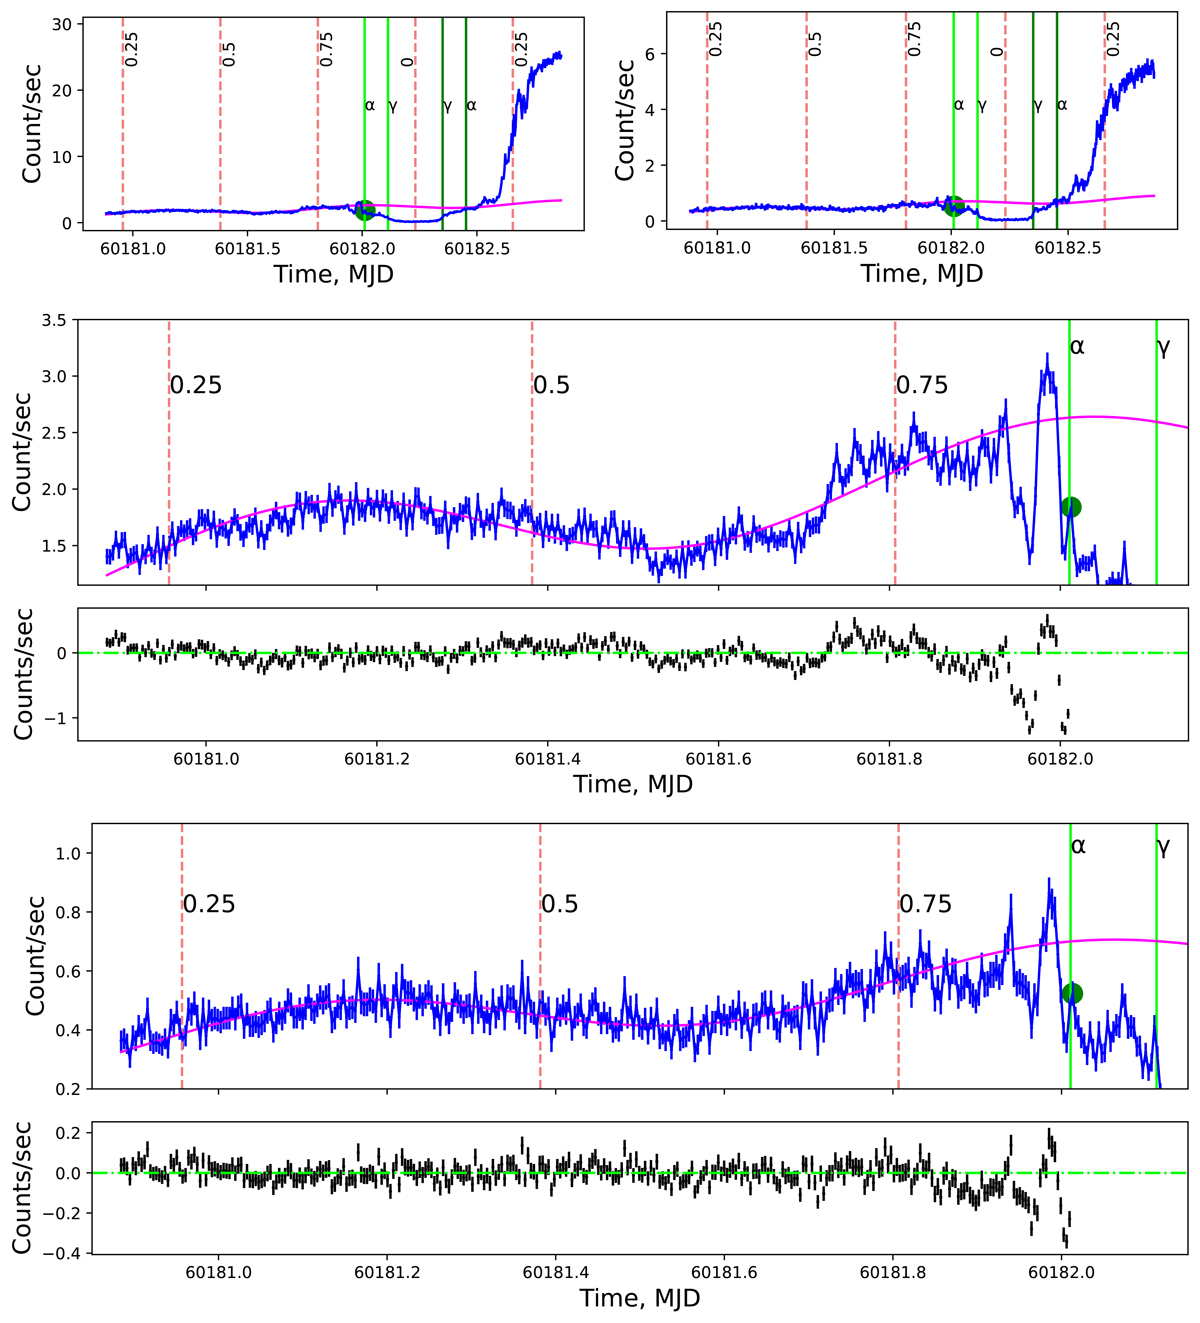
Download original image
ART-XC 4–12 keV (top left) and 12–25 keV (top right) light curves; enlarged pre-eclipse part of the 4–12 keV light curve (center) and enlarged pre-eclipse part of the 12–25 keV light curve (bottom). Blue error bars correspond to 300 s data binning, pink lines correspond to the best fit of the model parameters (3), and green solid circles correspond to the orbital phase up to which the model describes the observed light curve (the beginning of X-ray eclipse ingress). Light green vertical lines mark specific eclipse phases: α indicates the beginning of the accretion disk eclipse, and γ indicates the neutron star eclipse. Dark green vertical lines mark the end of the corresponding eclipse phases. Red dashed vertical lines show specific orbital phases. Black error bars show the model residuals.
Current usage metrics show cumulative count of Article Views (full-text article views including HTML views, PDF and ePub downloads, according to the available data) and Abstracts Views on Vision4Press platform.
Data correspond to usage on the plateform after 2015. The current usage metrics is available 48-96 hours after online publication and is updated daily on week days.
Initial download of the metrics may take a while.