Open Access
Fig. 5.
Download original image
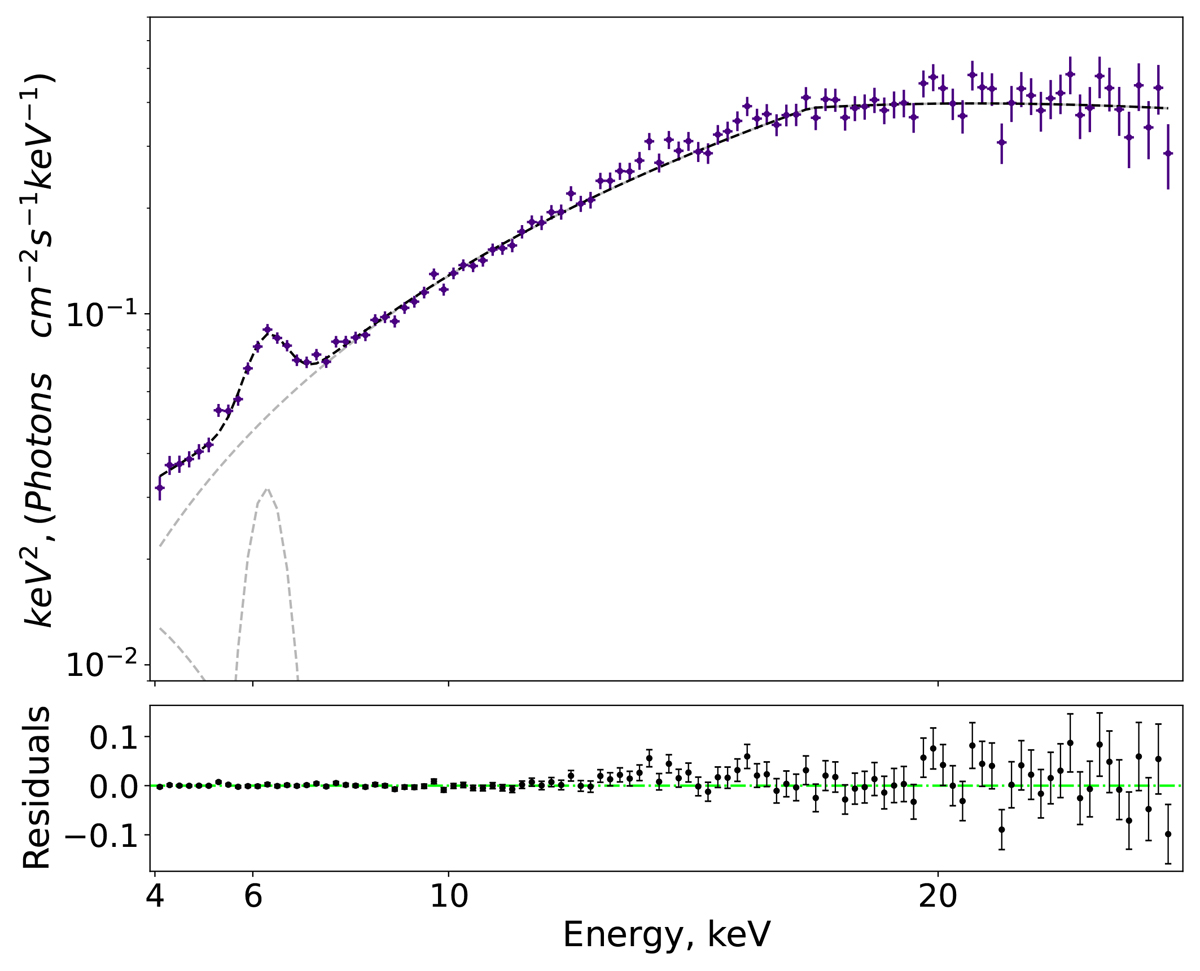
Top: ART-XC Her X-1 a hard spectrum in the low state (see also Fig. 4). Dashed gray lines indicate models HIGHECUT(POWERLAW), GAUSSIAN, AND BLACKBODY. Dashed black line is the total model. Bottom: difference between the observation points and the total model.
Current usage metrics show cumulative count of Article Views (full-text article views including HTML views, PDF and ePub downloads, according to the available data) and Abstracts Views on Vision4Press platform.
Data correspond to usage on the plateform after 2015. The current usage metrics is available 48-96 hours after online publication and is updated daily on week days.
Initial download of the metrics may take a while.