Fig. 2
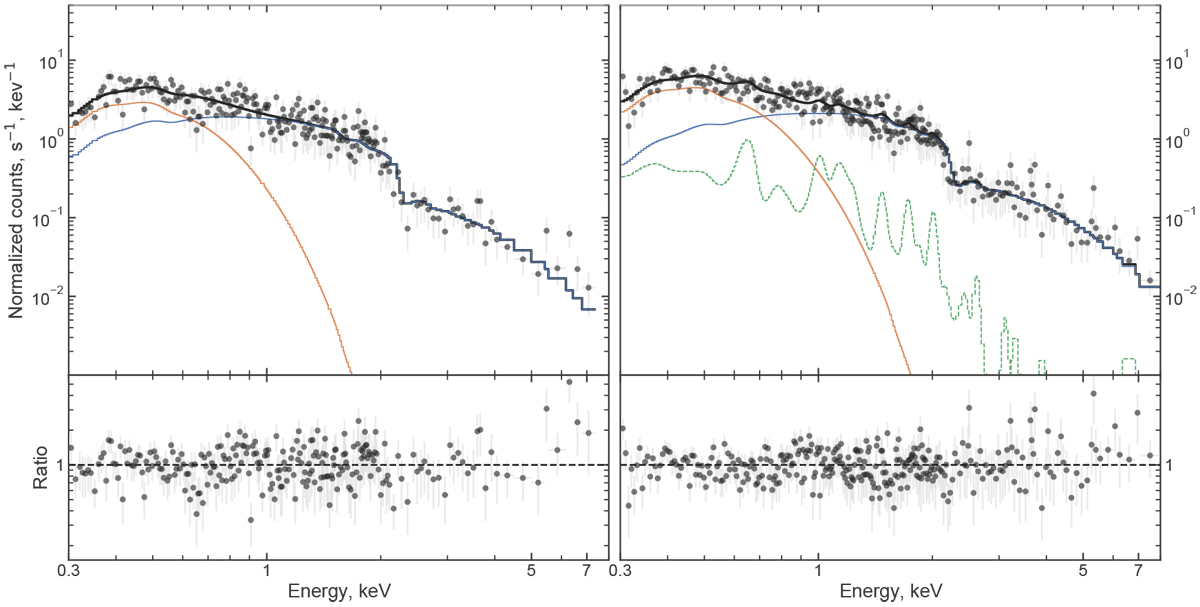
eROSITA spectra of Her X-1 obtained during the first and the second sky surveys (left and right panels, respectively). The solid black line shows the best-fit model (see Table 1), and the green dashed line shows the contribution from the proper emission of hot photoionized plasma (not detected in the first survey). Thin red and blue lines show the blackbody and power-law components, respectively. The bottom panels show the ratio of the data to the folded model. The visible excess in the residuals at higher energies is due to the Fe K complex and possible reflection from the cold photosphere of the optical star, which are unaccounted for in the spectral modeling (see Sect. 5).
Current usage metrics show cumulative count of Article Views (full-text article views including HTML views, PDF and ePub downloads, according to the available data) and Abstracts Views on Vision4Press platform.
Data correspond to usage on the plateform after 2015. The current usage metrics is available 48-96 hours after online publication and is updated daily on week days.
Initial download of the metrics may take a while.