Fig. 4
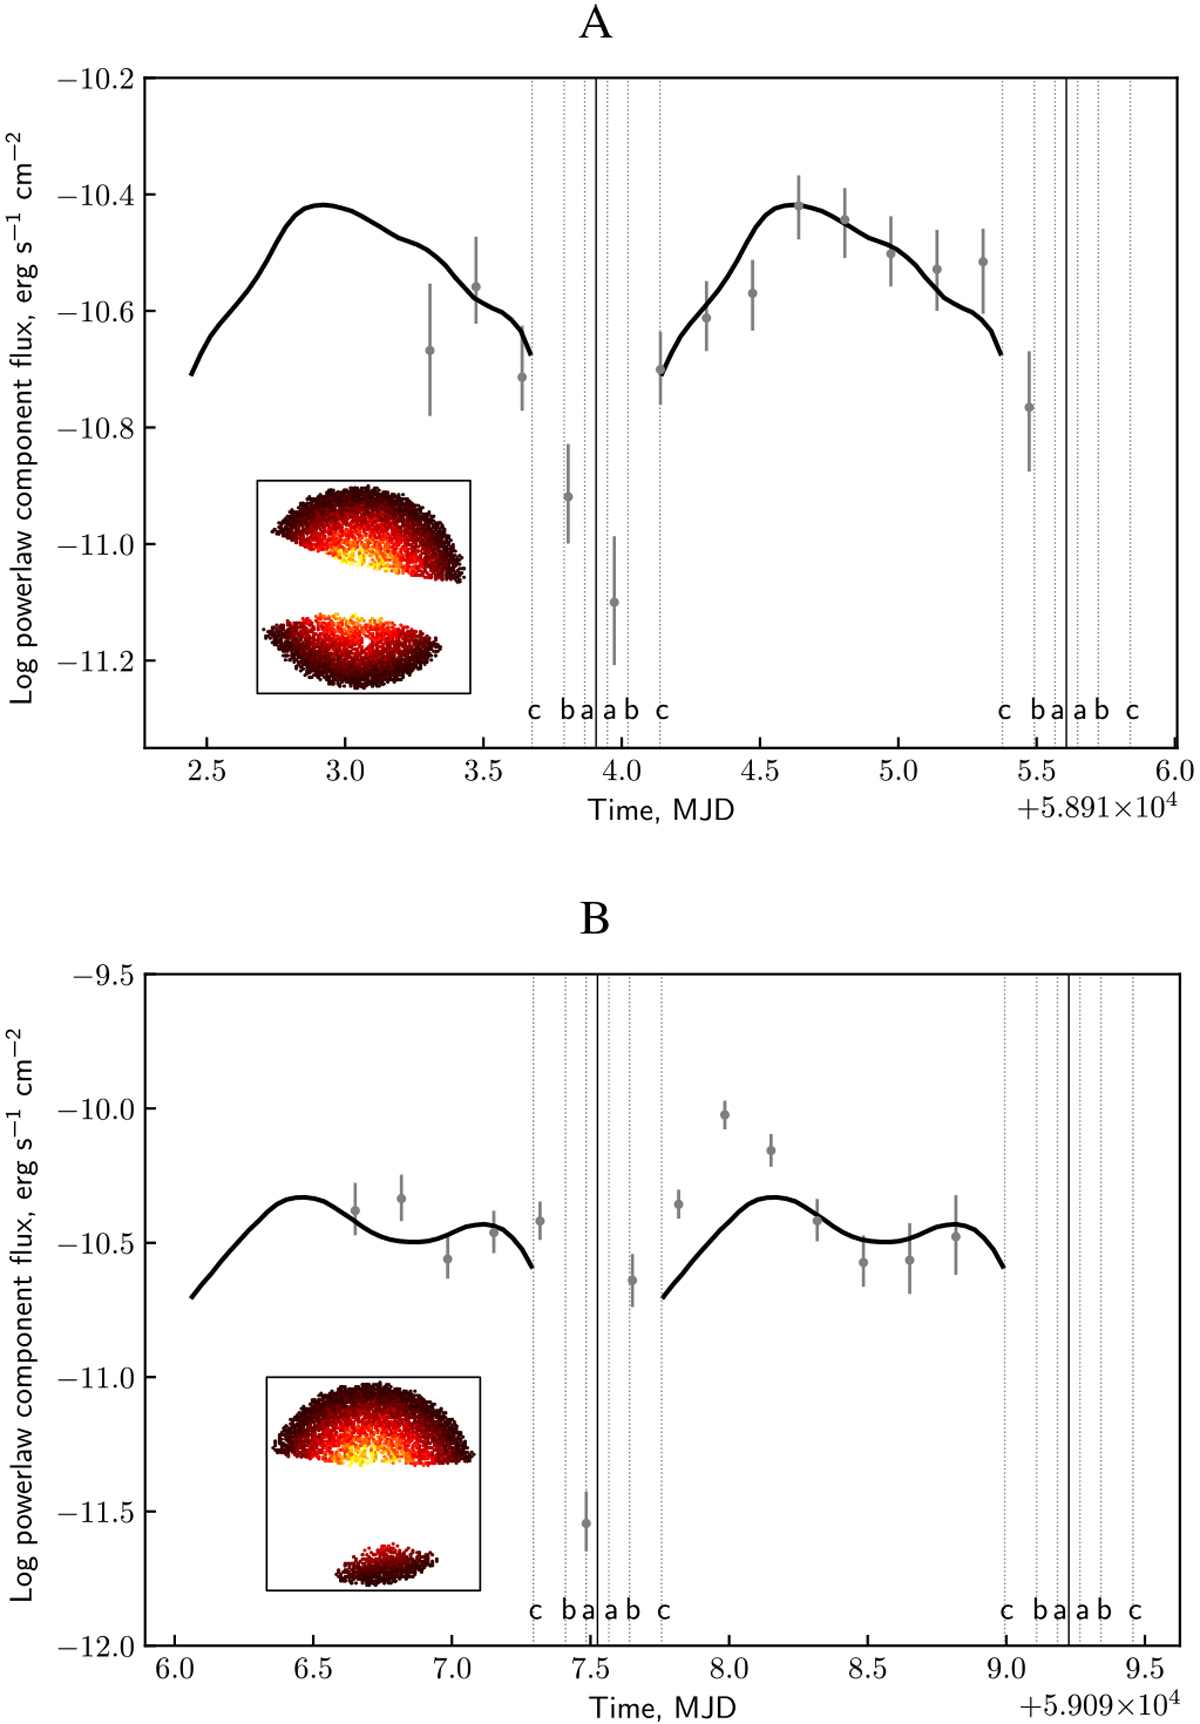
X-ray flux of the power-law component in the energy range 0.2 – 8 keV from Her X-1 as a function of time during the first (A)and second (B) survey. The solid line is the theoretical flux calculated as described in Sect. 4. Figures inside plots show the brightness of scattered X-rays in the corona at the orbital phase 0.5. The white region is the X-ray shadow. The solid vertical lines indicate the orbital phase zero. The dotted vertical lines a, b, and c before and after the orbital phase zero indicate different accretion disk ingress and egress moments. Here, c–a and a–c intervals before and after phase zero, respectively, indicate the orbital phases where the donor star partially covers the accretion disk. Line b indicates expected moments of ingress and egress of the X-ray source. The a–a interval covers the total eclipse of the disk by the donor star.
Current usage metrics show cumulative count of Article Views (full-text article views including HTML views, PDF and ePub downloads, according to the available data) and Abstracts Views on Vision4Press platform.
Data correspond to usage on the plateform after 2015. The current usage metrics is available 48-96 hours after online publication and is updated daily on week days.
Initial download of the metrics may take a while.