| Issue |
A&A
Volume 646, February 2021
|
|
|---|---|---|
| Article Number | A1 | |
| Number of page(s) | 11 | |
| Section | Interstellar and circumstellar matter | |
| DOI | https://doi.org/10.1051/0004-6361/202039634 | |
| Published online | 01 February 2021 | |
Molecular remnant of Nova 1670 (CK Vulpeculae)
II. A three-dimensional view of the gas distribution and velocity field★
1
Nicolaus Copernicus Astronomical Center, Polish Academy of Sciences,
ul. Rabiańska 8,
87-100 Toruń, Poland
e-mail: This email address is being protected from spambots. You need JavaScript enabled to view it.
2
Center for Astrophysics | Harvard & Smithsonian,
60 Garden Street,
Cambridge,
MA 02138,
USA
3
Instituto de Astronomía, OAN, UNAM, Ensenada,
Mexico
4
Observatorio Astronomico Nacional (OAN, IGN), Campus Universitario,
Ctra. NII km 33,600, Apartado 112,
28803 Alcala de Henares,
Spain
5
Max Planck Institut für Radioastronomie,
Auf dem Hügel 69,
53121 Bonn,
Germany
6
Space Radio-Diagnostics Research Centre, University of Warmia and Mazury,
ul. Oczapowskiego 2,
10-719 Olsztyn,
Poland
Received:
9
October
2020
Accepted:
19
December
2020
Abstract
CK Vul is the remnant of an energetic eruption known as Nova 1670 that is thought to be caused by a stellar merger. The remnant is composed of (1) a large hourglass nebula of recombining gas (of 71′′ in size), very similar to some classical planetary and pre-planetary nebulae (PPNe), and (2) a much smaller and cooler inner remnant that is prominent in millimeter-wave emission from molecules. We investigate the three-dimensional spatio-kinematic structure of both components. Our analysis of the hourglass structure yields a revised distance to the object of >2.6 kpc, at least 3.7 times greater than previously assumed. At this distance, the stellar remnant has a bolometric luminosity >12 L⊙ and is surrounded by molecular material with a total mass >0.8 M⊙ (the latter value has a large systematic uncertainty). We also analyzed the architecture of the inner molecular nebula using ALMA observations of rotational emission lines obtained at subarcsecond resolution. We find that the distribution of neutral and ionized gas in the lobes can be reproduced by several nested and incomplete shells or jets with different velocity fields and varying orientations. The analysis indicates that the molecular remnant was created in several ejection episodes, possibly involving an interacting binary system. We calculated the linear momentum (≈1040 g cm s−1) and kinetic energy (≈1047 erg) of the CK Vul outflows and find values that are within the limits typical for classical PPNe. Given the similarities of the CK Vul outflows to PPNe, we suggest there may be CK Vul analogs among wrongly classified PPNe with low intrinsic luminosities, especially among PPNe with post-red-giant-branch central stars.
Key words: stars: AGB and post-AGB / stars: individual: CK Vul / stars: jets / stars: mass-loss / stars: winds, outflows / submillimeter: stars
Two movies associated to Fig. 4 are available at http://www.aanda.org
© ESO 2021
1 Introduction
Nebulae of post asymptotic-giant-branch (post-AGB) stars have been extensively imaged at optical, infrared, and millimeter wavelengths. A large fraction of them are bipolar in shape. Bipolar planetary nebulae (PNe) and pre-planetary nebulae (PPNe) are shaped by mechanisms that are not entirely understood (Balick & Frank 2002). Magnetic fields and stellar rotation may be involved in producing some of the asymmetries of the nebulae but are not considered to be the dominant actors. The still elusive sculpting mechanisms most likely involve binary interactions (e.g., Bujarrabal et al. 2000; Soker & Rappaport 2001), including common-envelope ejections and mergers (Paczyński 1976; Jones & Boffin 2017; Soker & Kashi 2012; Kamiński et al. 2018a). Bipolar nebulae display a wide range of morphologies and kinematical properties. These include structures formed in multiple ejections with different orientations (e.g., Sahai & Trauger 1998), atomic and molecular outflows expanding with high speeds (molecular with roughly 100–300 km s−1 and atomic up to about 2000 km s−1; see e.g. Sánchez Contreras & Sahai 2001), and with the speed increasing linearly with distance. In addition, rotating as well as expanding disks and tori have been observed in the waist of the bipolar structure (Bujarrabal et al. 2016, 2018; Sánchez Contreras et al. 2000). The momenta of the observed outflows nearly always exceed values expected from radiation pressure of the luminous central star by orders of magnitude. Thus, the origin of the bipolar PPNe must be related to dynamic phenomena (e.g., Alcolea et al. 2001), possibly involving accretion episodes in binary or multiple systems (Sánchez Contreras et al. 2004). Most well-studied bipolar PPNe and PNe have kinematic ages of a few hundred years (≲1500 yr) and it is suspected that were created in a relatively short phase, lasting tens of to a few hundred years (Bujarrabal et al. 2001). Many of the nebulae encompass bullets or jets (see e.g., Huang et al. 2016), although the definition of a jet varies between authors. Identifying the shaping mechanism of those post-AGB stars is important for our understanding of the stellar evolution beyond the main sequence in low-mass binary and multiple systems.
The object CK Vul, when observed at optical wavelengths, appears very similar to many bipolar PPNe: it has a large (71′′) hourglass nebula of recombining gas, multiple “bullets” ejected at different orientations (Hajduk et al. 2007), a dust-rich waist (Kamiński et al. 2015), and fast atomic and molecular outflows (Kamiński et al. 2015; Hajduk et al. 2013) which abide by a linear expansion law. What clearly distinguishes CK Vul from post-AGB systems is that its central object is much less luminous (≳0.9 L⊙ in Kamiński et al. 2015; revised here to 16–60 L⊙) than post-AGB stars (typically of 104 L⊙ for PPNe). More importantly, in contrast to PPNe and PNe, CK Vul has been observed directly in outburst. The “new” star was discovered in June 1670 and its changing visual brightness was well documented until the final dimming sometime after May 1672 (Shara et al. 1985). The light curve shows at least three outbursts over the period of ≈3 yr. Such a light curve is not typical for classical novae (Rosenbush 2020), but is typical of a recently recognized group of eruptive objects known as (luminous) red novae or (intermediate-luminosity) red transients. A reddish color for the 1670 transient was noted by J. Hevelius (Shara et al. 1985). Red color is a tell-tale characteristic of red novae in the late stages of their eruptions, and is due to dramatic cooling and increasing obscuration by newly formed dust. The ancient eruption was therefore postulated to be of the red-nova kind (Kato 2003; Tylenda et al. 2013). That hypothesis was corroborated by further analysis of the remnant (Kamiński et al. 2015, 2018b, 2017). (Some authors have presented different views on the nature of the object, see e.g., Shara et al. 1985; Miller Bertolami et al. 2011; Evans et al. 2016; and Eyres et al. 2018, but most of them are invalided by more recent observations; see e.g., Kamiński et al. 2015, 2018b.) As argued by Tylenda & Soker (2006) and directly observed for the case of V1309 Sco (Tylenda et al. 2011), red novae erupt as the results of stellar mergers, events in which the coalescence is preceded by a quick phase of common-envelope evolution (Livio & Soker 1988; Ivanova et al. 2013; MacLeod et al. 2017). Interestingly, some of the red transients, including extragalactic ones, have been linked to PPNe (Prieto et al. 2009; Soker & Kashi 2012). The nebular remnant of Nova 1670, was recovered by Shara & Moffat (1982). Subsequent observations showed the presence of the large hourglass nebula. Within, several clumps of atomic emission were found by Hajduk et al. (2007), including features that we refer to here as the northern jet and bullets (Fig. 1). The photosphere of the stellar remnant has not been observed, either directly or in scattered light (Shara et al. 1985; Naylor et al. 1992; Hajduk et al. 2007, 2013; Tylenda et al. 2019). Quite surprising were observations of CK Vul at millimeter (mm) and submillimeter (submm) wavelengths that were conducted over the last few years. They revealed a very rich molecular component of the remnant, composed of simple and polyatomic molecules, as complex as CH3 OH and CH3 NH2 (Kamiński et al. 2015, 2017). The molecular gas is enhanced in helium, products of the CNO cycles, and partial helium burning, including rare CNO isotopes and 26Al. Their presence is consistent with a red giant branch (RGB) star torn apart in the merger of 1670 (Kamiński et al. 2015, 2017, 2018b). The molecular gas forms a bipolar structure that is approximately seven times smaller than the atomic hourglass nebula.
In Kamiński et al. (2020, hereafter Paper I), we presented an imaging line survey conducted with the Atacama Large Millimeter/submillimeter Array (ALMA) and Submillimeter Array (SMA). The survey allowed us to explore the spatial complexity of the molecular remnant that was traced in 180 spectral lines of 22 molecular species. The bipolar molecular lobes and the central region are well resolved by the interferometers, allowing the first detailed studies of the components of the remnant.
In this paper, we take a close look at the three-dimensional (3D) spatio-kinematic structure of the atomic and molecular remnant of Nova 1670. Observational data at mm wavelengths have been described and presented in Paper I. We start the current study with a revision of the basic astrophysical parameters of the remnant, which are based on optical observations of the large hourglass nebula (Sect. 2). In Sect. 3, we turn mainly to the inner remnant and introduce our modeling methods which were designed to reproduce its architecture in 3D. We present results of the modeling for different components of the remnant, that is, for bulk neutralgas (Sects. 3.1–3.2), molecular ions (Sect. 3.3), and for an extended CO-bearing region (Sect. 3.4). In Sect. 4, we constrain the linear momentum and kinetic energy of the molecular outflow. Finally, in Sect. 5, we discuss the results in search of clues as to the dynamical origin of the molecular outflow and the CK Vul relation to known PNe and PPNe.
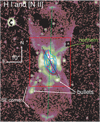 |
Fig. 1 Large-scale hourglass nebula of CK Vul. The background optical image shows the nebular emission in lines of Hα and [N II]. Although most stars are removed from the image, some considerable residuals can be seen (most of the point-like sources; Hajduk et al. 2007). The red dashed rectangle of 26′′ × 31′′ corresponds to the size of the maps in Fig. 11. The cyan contours show emission of CO 1–0. The dashed lines mark the symmetry axes of: the large hourglass nebula (green), the CO region (black), and the optical shell immediately surrounding the molecular nebula (magenta). |
2 Revised physical parameters of the remnant
A distance of 0.7 kpc has often been assumed for CK Vul after Hajduk et al. (2013). It was derived from an analysis of the large hourglass nebula that can be safely assumed to originate in the eruption of 1670. Based on images and long-slit spectroscopy of the nebula, Hajduk et al. performed a 3D analysis which lead them to the inclination of the structure. (For inclination, we adopt the convention that takes the angle between the long axis of the hourglass and the sky plane.) The figures of Hajduk et al. (2013) present a model for an inclination of 25°. Knowing inclinations and radial velocities, and assuming a linear velocity field, one can derive the tangential and the total deprojected velocities of the gas. Subsequently, the angular size of the structure yields the distance to the object. However, in calculating the distance, Hajduk et al. (2013) used an inclination of 65° (sic), which is inconsistent with the shown model (25°), and found a distance of 700 pc. We correct this error and propose a revised model of the hourglass nebula that implies a much greater distance.
We used SHAPE (Steffen & López 2006; Steffen & Koning 2017, version 5.1) to reconstruct the overall spatio-kinematic structure of the large hourglass nebula and compared it to images and long-slit spectra presented in Hajduk et al. (2013). Each optical lobe was modeled as a single shell-like structure. In particular, pointy (nearly triangular) cusps of emission seen at the northern and southern tips of each optical lobe (Fig. 1) were assumed to be part of the hourglass. In the modeling and comparison to the observations, we ignored the inner nebula regions up to radii of about 7′′, where the hourglass structure overlaps with multiple bright features of unknown kinematical ages (cf. Fig. 2). We assumed a linear expansion law (v ∝ r) for the shells. The characteristic presence of the two clear bright cusps at the tips of the hourglass nebula and the simultaneous presence of sharp angles at the NE, NS, SE, and SW “corners” of the hourglass (cf. Fig. 1) imply an upper limit of ≈35° on the inclination. At larger inclinations, the tips of the hourglass appear internal to the lobes and instead of the corners, the rims of the hourglass appear rounded for a wide range of intrinsic shapes. In particular, 65° used by Hajduk et al. (2013) can be ruled out. The nebula morphology does not provide us with a lower limit on the inclination. In Fig. 2, we present a sample model where the northern and southern optical lobes have inclinations of i = 10° and i = 20°, respectively. Such a model reproduces very well the spectra obtained with a slit located at the high-proper motion star west of CK Vul (cf. Figs. 3 and 4 in Hajduk et al. 2013). We find subtle asymmetries between the southern and northern optical lobes (e.g., in size, position, and inclination angle) but these will be explored in another publication.
In the spectra of the bright [N II] λ6583 line, the apexes of the hourglass have an average radial velocity of ±820 km s−1 (blueshifted in the south and redshifted in the north). With the radial extent of each lobe, namely 36′′, and a kinematical age of 340 yr, we calculated the distance and other physical parameters of the CK Vul remnant fordifferent inclinations. Results are shown in Table 1. Our upper limit of i ≈ 35° implies that the object is at a distance larger than ≳2.6 kpc. Our model with i = 15° ± 5° from Fig. 2 puts CK Vul at a distance of 5.7 kpc and indicates the ejecta velocity of 3200 km s−1. We considerthis solution as a sensible upper limit on the distance. With a Galactic longitude of l = 63. °3 for the object, at much lower inclinations (for instance of 5°) the distances would be enormous (17 kpc), putting CK Vul at the outskirts of the Galaxy and implying gas motions comparable to those of supernovae. Such solutions are therefore highly unlikely.
An independent constraint on the distance to CK Vul can be derived from the distance to a field star “variable 2” (Hajduk et al. 2013) located behind the southern molecular lobe. Its Gaia Early Data Release 3 parallax (0.066 ± 0.186 mas; Gaia Collaboration 2021) implies a distance of 4.8 kpc or a 1σ confidence interval 3.0–7.9 kpc (Bailer-Jones et al. 2018). This implies 10° < i < 30°. We thereforetake the distance to CK Vul to be >2.6 kpc and adopt 5.7 kpc as a plausible upper limit.
The bolometric luminosity of the CK Vul remnant was derived from a spectral energy distribution (SED) by Kamiński et al. (2015). The SED was reconstructed from broadband photometric measurements ranging from infrared to radio wavelengths. That luminosity may be an underestimate because it does not take into account radiation escaping the system through polar regions. At the assumed distance of 0.7 kpc, a luminosity of 0.9 L⊙ was derived. The revised distance makes the remnant of CK Vul much more luminous, that is Lbol > 12 L⊙. If CK Vul is located in the Galactic disk, its luminosity is certainly lower than 104 L⊙. The revised luminosity of CK Vul closely matches those of RGB or post-RGB stars, consistent with the RGB merger hypothesis of Kamiński et al. (2018b).
The revised distance also implies a high luminosity of the outburst of Nova 1670. We calculated its maximal bolometric luminosity for the range of distances and present them in the last column of Table 1. In the calculations, we adopted: the minimal visual magnitude of 2.6 during the 1671 peak (Shara et al. 1985); interstellar visual extinction of AV = 2.79 mag (an upper limit from Tylenda et al. 2019); and a bolometric correction of 0.0 mag consistent with a supergiant at a temperature of ~7500 K (i.e., comparable to that of V838 Mon, cf. Tylenda 2005). Although the assumed interstellar extinction and the bolometric correction are uncertain, the peak luminosity of Nova 1670 was very likely on the order of 107 L⊙, perhaps exceeding that of the brightest Galactic red-nova outburst of V838 Mon (Sparks et al. 2008) but comparable to peak luminosities of some extragalactic merger-burst candidates (cf. Pastorello et al. 2019).
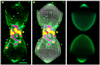 |
Fig. 2 Three-dimensional model of the atomic hourglass nebula of CK Vul. Left: observed image of the nebula (same as in Fig. 1). Bright nebula regions shown in yellow and magenta are not considered to be parts of the hourglass. Center: bipolar-shell model rendered as a mesh overplotted on the observed image. Right: simulated image of the nebula for our line of sight. Polar regions have enhanced emissivity while emission adjacent to them was suppressed. |
Physical parameters of the remnant at different inclinations.
3 Three-dimensional molecular remnant
With the revised basic parameters of the remnant, we come back to the molecular component of the remnant. We again used SHAPE (version X.α.619 from 2018) to reconstruct the overall spatio-kinematic structure in 3D. Cylindrical or point-symmetry was assumed unless otherwise stated.
SHAPE models were iteratively constructed by comparing the simulated spatio-kinematic structure to products of the observational data, including total-intensity maps, channel-velocity maps, and position-velocity (PV) diagrams generated for several virtual slits. The observables were extracted from average data-cubes introduced in Paper I. They typically represent a weighted mean of multiple transitions and isotopologs of a given species (except for CO; see below). The molecular emission is generally optically thin in the molecular lobes on which we focus here, while we omit the “central region”. Defined in Paper I, the central region is within ≈2′′ of the remnant center. It is characterized by a considerable range of temperatures, optically thick emission of the most abundant species, and has an irregular velocity field traced in SO2 lines (see Paper I). To address all of these features would require adopting a different modeling approach from that applied here.
The morphology of the lobes is shown for a number of molecules in Fig. 2 of Paper I. The molecular lobes have a very pronounced point symmetry, but small asymmetries between the northern and southern lobes can be seen. In the majority of the observed molecules, the nebula exhibits an S-shape morphology, except for molecular ions, which have an S -shape (inverse-S) appearance in total intensity maps. The emission distributions of neutral and ionic species complement each other to form an ‘8’-shaped structure.
3.1 Step 1: general shape
First, we focused on reproducing the shape and kinematics of the outermost spatial structures (those farthest from the expansion center) that are visible in neutral-gas tracers observed at a very high signal-to-noise ratio (S/N), such as in HCN and SiO. Each molecular lobe was represented by an ellipsoidal structure whose shape was subsequently manually modified by stretching and squeezing, and by adding several distortions. The sizes of the structures along the sight-line were assumed to be similar to their widths measured directly in the maps. The overall simulated shape of the outer remnant is shown in Fig. 3.
The velocity field was implemented as a stitched function of linear radial expansion laws, in the form v(r) = kr and with different values of k. The reference frame of the velocity field was oriented in the same manner as the spatial structure and thus defined by the same inclination and positionangles. For the bulk of molecular gas in these outer shells, we were able to satisfactorily reproduce the observations with k = 37 km s−1 arcsec−1 near the central region (i.e., roughly within a radius, r, of 1′′) and k = 58–68 km s−1 arcsec−1 outwards. Inour preferred implementation, the structures are only slightly inclined to the sky plane: the northern lobe is at an inclination i = 10° and the southernone is in the sky plane (i = 0). The values of k and i are degenerate and cannot be determined independently. However, high inclinations, say >30°, are highly unlikely.
Within this model, the outermost emission extends to 7′′.2, where gas moves with a deprojected speed of 470 km s−1. Adopting a distance of  kpc (Sect. 2), ballistic motion with such a speed would take
  yr to reach the outer parts of the molecular remnant. This, within the uncertainties, is consistent with an origin time close to the 1670–72 eruption. Slightly higher inclinations require larger shells expanding with considerably lower speeds. For example, at an inclination near 30°, the shells must be ~15% longer and 50% slower resulting in over twice the kinematical age, that is 585 yr at 3.5 kpc. The upper limit on the kinematical age limits the range of inclinations to angles lower than about 15°. (This should not be confused with the inclination of the large hourglass structure.)
Assuming that the main axes of the molecular lobes are in the sky plane, as is nearly the case for our 3D model, the kinematical age of the outer shells may also be determined using solely the maximal radial motions of the gas within this structure, that is 134 km s−1. We assume that the extension of the lobes along the line of sight is the same as the size in the sky plane, that is with a radius of ≈2′′.5. At an age of340 yr, this indicates a distance of 3.8 kpc, which is consistent with the revised kinematical distance to the large hourglass optical nebula (Sect. 2).
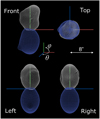 |
Fig. 3 General shape of the molecular lobes in our 3D reconstruction. The outer shells are represented by meshes viewed from four angles. The front view is that for a terrestrial observer but, for convenience, rotated by a position angle of –17°. The northern lobe is shown with a white mesh, southern with a blue one. Cartesian xyz axes are shown for reference in red, green, and blue, respectively. The blue axis corresponds to the line of sight. The convention of counting the azimuthal (θ) and polar (ϕ) angles is shown in the inset. Each lobe is ~8′′ long. |
3.2 Step 2: distribution of neutral species
We filled the shells with virtual gas, the density of which was parametrized in spherical coordinates (r, θ, ϕ). The PV diagrams of many neutral species with extended emission required limiting the distribution of matter to certain ranges of the azimuthal angle, θ. (As indicated in Fig. 3, the angle θ is defined relative to the sky plane and counted positive from the west toward the observer.) For instance, in the northern lobe nearly no emission is assigned to 10° < θ < 90° (i.e., the western part of the near side is empty) and our modeled southern lobe is devoid of emission for 5° < θ < 185° (i.e., nearly the entire far side is missing). Although it is certain that these density variations with θ exist, their magnitude and the exact limits on θ could not be well constrained. A model for neutral species is shown in Fig. 4. A comparison between sample PV diagrams of simulated and observed emission of SiO is shown in Fig. 5. These diagrams correspond to three virtual slits defined in Fig. 6.
Our model of neutral gas was arbitrarily implemented starting from elliptical shells which were devoid of gas for a range of azimuthal angles. However, alternatively the structure could have been implemented as an ensemble of streams or jets propagating at discrete azimuthal and inclination angles. These jets would have to be injected close to the walls of the larger shell to result in the S-shaped morphology. A single jet, even a precessing one, is highly unlikely to be responsible for the observed characteristics.
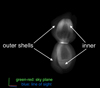 |
Fig. 4 Reconstructed density structure of the neutral gas in CK Vul. The blue bar corresponds to the line of sight. See also the online movie. Another online movie shows the molecular ions in CK Vul. |
3.3 Step 3: molecular ions
Ions displaydifferent spatial distributions from most neutral molecules (Paper I). We analyzed the extended emission of molecular ions using a data-cube representing the combined emission of HCO+ and N2 H+ (cf. Paper I). Our preferred model is shown in Fig. 7 and is compared to observed PV diagrams in Fig. 8 for slits shown in Fig. 6.
The thin outer shell seen in most neutral molecules (and shown in Fig. 3) is seen in ions too, but is very incomplete. Its emission is very weak at large distances from the center and is almost absent for several ranges of the azimuthal angle (e.g., between 70° and 180° in the northern lobe).
Molecular ions display strong features in the PV diagrams that cannot be reproduced by our basic model tailored for the emission from neutral molecules. These are outlined by red dashed ellipses in Fig. 8. We reproduced these features seen in emission from cations by introducing a couple of incomplete shells embedded within the outer shells, one in each molecular lobe. They are scaled-down versions of the outer shells but with multiple shape modifications added, which resulted in very irregular structures, as shown in Fig. 7.
As before, a linear velocity field at low inclination angles (i = 5° or 10°) was assumed for the gas from ionic species. The gas assigned in the simulations to the inner shells generally moves slower than that in the outer shells. Our adopted velocity fields imply kinematic ages of 240–470 yr (at 3.5 kpc). Within the model uncertainties, the age is thus consistent with origin in the 17th-century eruption.
In combination with the very complex shape of the shells, the linear velocity field satisfactorily reproduces most of the observations. Alternatively, introducing more regular shell structures, such as a couple of pure ellipsoids, would require a very complex, highly non-linear velocity field which we consider unlikely. We also experimented with an alternative model where each ionized lobe is represented by three to four ellipsoidal shells of different sizes, inclinations, and (different) linear velocity fields, all leading to an excessive complexity that we find unlikely.
An analysis of the distribution of ionized gas within the shells indicates further complexity. To reproduce the observed PV diagrams, inner shells were filled with emitting matter only for very narrow ranges of the azimuthal angle. For instance, for the northern ionized lobe, the emitting matter was located within 55° < θ < 80° and –80° < θ < 0°. These ranges correspond, respectively, to the mainly redshifted and mainly blueshifted parts of the loops seen in the PV diagrams of the western side. The narrow limits on azimuthal angles indicate a very confined location of molecular ions. The features they display in the northern ionized lobe can alternatively be well reproduced with a pair of jets extending along and inside the walls of the outer shell.
3.4 Step 4: extended bubbles of CO emission
Emission observed in the 1–0 and 2–1 lines of CO has a component that is more extended than any other molecular feature. Most apparent is the extra emission east and west from the central waist of the bipolar structure, as illustrated in Fig. 9. The CO gas is partially outside of the outer shell discussed above and shown in Fig. 3. The CO emission may even be more extended than it appears in our ALMA maps because the interferometric data are not sensitive to structures larger than ≈23′′ (Paper I). Indeed, compared to a single-dish spectrum of CO 1–0 obtained with a beam of 21′′.8 (Kamiński et al. 2017), the ALMA maps recover only about 52% of the line flux. In the analysis below, we ignore the missing flux and focus on the recovered J = 1–0 emission of 12CO and 13CO.
The extended component has a very high radial velocity that implies radial motions ≳300 km s−1 relative to the mean LSR velocity of –10 km s−1. This fast component is shown in a sample of PV diagrams in Fig. 10.
We were unable to construct a regular 3D representation of this extended CO structure that would fully reproduce its spatio-kinematic structure. However, an idealized model consisting of two spherical shells with a size of 16′′ explains some of the observed characteristics. In that implementation, we used a simple velocity law with k = 71 km s−1 arcsec−1. This law is the steepest function v(r) among all analyzed features. The spheres overlap in the central 1′′.7 part of the remnant. The shells are centered at r = 4′′.3 north and south from the remnant center. These CO bubbles are shown in Fig. 7 as the most extended features (in white and pink). However, from current observations it is not clear how far north and south the emission extends.
Some clues as to the structure of the extended molecular emission come from its comparison to atomic emission seen in projection in the same part of the remnant. A comparison is made in Fig. 11, where we used a map of Hα and [N II] emission obtained in 2010 at a resolution of 1′′.1 by Hajduk et al. (2013). The elongated optical filament marked as jet in Fig. 11 closely fills the gap in the loop of CO emission seen in the northern lobe. This suggests a direct link between the two phases of the remnant. The nebular emission within the southern lobe is much less extended and very weak but still constitutes a natural extension of a broken loop of CO emission of that lobe. Weak atomic nebulosity is seen surrounding the entire CO region, as outlined in Fig. 11. Not counting the jet, the brightest clumps of the atomic nebula are seen 2′′.3–7′′.5 east and west from the center. A much weaker structure is seen in almost all directions forming a bi-conical limb-brightened structure surrounding the molecular remnant. Its main axis is at a position angle of ~25°, close to that of the molecular nebula (17°). Its northern tip appears sharply pointed whereas the apex of the southern lobe is rounded and incomplete, or appears so because of an overlap with a bullet. The shell of recombining gas surrounding the molecular remnant is very likely physically linked to the inner remnant traced in molecular emission. As the low kinetic temperature of the molecular gas (≈10–14 K) requires a phase of strong adiabatic cooling, the atomic shell may contain material on which work has been done by the expanding molecular gas.
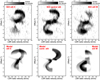 |
Fig. 5 Comparison of observed (top) and modeled (bottom) PV diagrams of SiO emission along the slits shown in Fig. 6. |
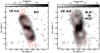 |
Fig. 6 Locations of virtual slits used to generate the PV diagrams in Figs. 5 and 8. The background images show weighted-mean emission in several transitions of SiO (left) and combined N2 H+ and HCO+ emission (right; cf. Paper I). |
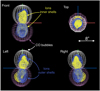 |
Fig. 7 Combined model of nested shells. The model includes two large-scale CO bubbles (pink and white) and shells of ionized molecules (blue and yellow). The outer shells from Fig. 3 are both shown here in blue. |
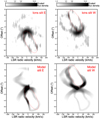 |
Fig. 8 Comparison of observed (top) and modeled (bottom) PV diagrams of ionic emission along the slits shown in Fig. 6. Ellipses drawn with red dashed lines mark locations of loops discussed in the text. |
4 Mass, momentum, and kinetic energy in the lobes
As mentioned in Sect. 1, PPNe have the peculiar characteristic that the linear momentum and the kinetic energy of their bipolar outflows exceed, by orders of magnitude, what the central star is capable of releasing as radiation over the lifetime of the nebula (Bujarrabal et al. 2001). Here we show that the remnant of CK Vul stores a comparably high momentum and kinetic energy. We closely follow the definitions of linear angular momentum and kinetic energy in the outflow of Bujarrabal et al. (2001), who systematically characterized a large number of PPNe and related objects. In particular, we are interested here in scalar angular momentum, which represents the sum of momenta in two opposing lobes (see Bujarrabal et al. 2001 for a discussion of the shortcomings of using this quantity). In our calculations, we use results from Paper I where column densities of CO have been estimated in four parts of the CK Vul remnant: in regions SW, NE, NW, and SE within the lobes, and in the central region. These were found with non-LTE models fit to several rotational transitions of 12 CO and 13 CO. By multiplying these column densities by the respective sizes of the regions, we estimated the number of CO molecules, which we next converted to H2 mass using a CO abundance of 2 × 10⁻⁴ relative to H2 (as in Bujarrabal et al. 2001). We consider three alternative distances to the source when calculating the physical areas of the regions: the lower limit of 2.6 kpc, the most likely value of 3.5 kpc, and our working maximal value of 5.7 kpc (Sect. 2). The column densities and masses are listed in Table 2. The masses are underestimated for several reasons. (i) The 12 CO lines are optically thick in some regions and our radiative transfer procedure applied only a rough correction for the line saturation. (ii) About 50% of the flux is missing in ALMA maps owing to missing “short-spacings” (Sect. 3.4). (iii) The regions considered in Paper I encompass 63% of the total flux of CO 1–0 emission. There are other considerable sources of uncertainty in the calculation, including the actual abundance of CO given the peculiar chemical composition of the nebula. Hot atomic and molecular gases, although certainly present in the nebula, are not accounted for (in accord with calculations in Bujarrabal et al. 2001).
The total mass is higher than 0.3 M⊙ or >0.4 M⊙ when roughly corrected for the incomplete coverage of the CO emission. When further corrected for the flux filtered out by the interferometer, we obtain a mass >0.8 M⊙. Most mass is stored in the central waist. The lobes constitute only 40% of the total mass. We note that the derived masses are comparable to 1 M⊙ given in Kamiński et al. (2015) but the latter corresponds to the invalid distance of 0.7 kpc and is close to current estimates only because of a numerical error (cf. Eyres et al. 2018).
To calculate the momentum (Mv) and kinetic energy (Ekin), we used deprojected velocity profiles, v(r), constrained by our 3D models of the lobes (Sect. 3.1). Using these, we calculated a flux-weighted average CO velocity in the lobes (at r > 2′′) of 312 km s−1. The central region (r < 2′′) is occupied by slower gas, with typical velocities of ≈50 km s−1.
The linear momenta and kinetic energies of the different components of the molecular remnant are listed in Table 2. The lobes carry a few times more momentum (80% of the total) than the central region and contain almost all the kinetic energy. Values at the considered distances are within the ranges of Mv and Ekin found by Bujarrabal et al. (2001) for PPNe, that is, of 1037 −1040 g cm s−1 and 1044−1047 erg, respectively. This demonstrates that the outflows of the merger remnant of Nova 1670 are very similar to these of PPNe and thus may have a similar dynamical origin. Within the uncertainties, the kinetic energy stored in the molecular remnant of CK Vul is also relatively close to the value of 1046 erg found for two other red-nova remnants, V4332 Sgr and V838 Mon (Kamiński et al. 2018a).
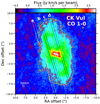 |
Fig. 9 Total intensity map of 12CO 1–0 restored with natural weighting of visibilities. The 3σ level is shown with a red contour. The orange dashed contour shows the 3σ level for combined emission in several lines of HCN and H13CN. Dashed lines indicate locations of four virtual slits for which PV diagrams are shown in Fig. 10. |
 |
Fig. 10 Position-velocity diagrams of CO 1–0 emission for the four virtual slits shown in Fig. 9. The dashed ellipses mark features that are only seen in CO emission. Entire emission seen within slit a is seen exclusively in CO. |
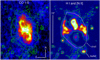 |
Fig. 11 Relative location of atomic and molecular gas in the inner remnant. The color images in the left and right panels represent, respectively, CO 1–0 and optical nebular emission near Hα. The latter is also shown as contours on both maps. Nearly all unrelated continuum sources were removed from both maps. The main features are labeled in the right map. The dashed line roughly marks emission of a partially broken shell of recombining gas that appears to surround the molecular remnant (see text). The bullet is one of the two features studied in Hajduk et al. (2007) and whose proper motions indicate an ejection in 1670. |
5 Discussion
5.1 Evidence of jets
The 3D architecture of CK Vul that we attempted to reproduce entails significant substructures characterized by a range of orientations (inclinations and position angles). Perhaps the most striking finding is that the irregularities of the lobes are associated with a remarkable level of point symmetry between the northern and southern lobe. At least for neutral species, each bump has a corresponding feature in the other lobe, even though some appear to be more pronounced in the north. A single ejection event with a wide opening angle would have to be very asymmetric to produce such complexity in the shape of each lobe and at the same time preserve the strong north–south point symmetry. It is therefore unlikely that a single ejection created the molecular nebula. A more natural explanation of the 3D structures is that they were formed by several collimated streams ejected at different inclinations and position angles but with a high level of north-south symmetry.
The molecular remnant of CK Vul mimics some PPNe and Herbig-Haro objects whose morphologies are indicative of pulsed or periodic collimated outflows that take the form of jets, clumped jets, or bullets. Indeed, outflows with an S- or S -type morphology evident in CK Vul are thought to be driven by episodic jets (Balick & Frank 2002, and references therein). The point symmetry of such nebulae is caused by precession of the objects launching them. Such jetted objects are associated with interior bow shocks, which are also present in CK Vul. Similar outflow mechanisms are very likely in action in CK Vul. Multiple streams that induce shocks naturally explain the positional variations in excitation seen across atomic regions of CK Vul (Tylenda et al. 2019); they also explain the asymmetries in the relative distribution of the neutral and ionic molecular species in CK Vul.
Characteristics of the molecular gas (see text).
5.2 Changes in the lobes and their age
Owing to multiple model degeneracies, our 3D analysis did not provide us with practical constraints on the age of the molecular lobes. However, the molecular lobes are expanding fast and ALMA observations decades into the future will constrain the proper motions of its subcomponents, improving our understanding of the true 3D structure and age.
The dusty and molecular nebula is changing on timescales of years and on spatial scales on the order of μas. This is evidenced by the variability of the two field stars located behind the southern lobe (Hajduk et al. 2013). Because these distant stars have very small angular diameters of a few μas at the distance of CK Vul, even small changes in the dust distribution within the lobe can cause observable changes in the extinction. As the variability is limited to two lines of sight, it does not put constraints on the age or structure of the nebula.
At much lower angular resolutions of 0′′.6–1′′.5, the shapes of discrete features of the optical nebula, including the northern jet, have remained unchanged since the discovery of the optical remnant in 1982 (Shara et al. 1985), so for at least 38 yr. (The nebula is becoming fainter, though.) These atomic features are therefore certainly older than 38 yr but cannot be much older than their recombination time of ≈250 yr (Tylenda et al. 2019). Two bullet-like structures within the optical nebula studied by Hajduk et al. (2007) have proper motions indicative of an ejection in 1670 and thus have an age of 350 yr. Nevertheless, it is not clear whether or not the material responsible for the nebular emission closer to the star than the bullets was ejected at the same time and in the same event as the bullets and the large hourglass. Based on the correspondence in the distribution of optical and CO 1–0 emission discussed in Sect. 3.4, we postulate that the origin of the shock-excited atomic features in the direct neighborhood of the molecular nebula, including the jet, is the same as that of the molecular matter. Molecules are most likely seen in the post-shock cooling zones associated with the recombining plasma behind the shock fronts (cf. Paper I). This sets the age of the molecular nebula between 38 and ~250 yr. However, we cannot exclude that the molecular lobes are older (350 yr) and formed in the latest phases of the 1670–172 eruption, when the central object became cool enough to support the production and survival of molecules.
In the latter scenario, the bipolar molecular remnant could possibly constitute material of the common envelope (CE) whose ejection directly led to the postulated merger. Simulations of the CE evolution predict formation of a central disk-like structure and collimated bipolar structures (e.g., MacLeod et al. 2018) very reminiscent of the CK Vul remnant. It has been demonstrated that even an intrinsically spherical outflow from a CE system can be reshaped into highly collimated and slightly asymmetrical lobes (Zou et al. 2020; Pejcha et al. 2016), similar to structures discussed here. On the other hand, intrinsically collimated jets, if formed near the more compact companion, can also produce bipolar morphologies and would even more naturally explain the multiplicity of shells found in CK Vul. Additionally, it has been demonstrated that jets can effectively unbind nearly 50% of the available envelope material (Shiber et al. 2019). Such a high efficiency would be required to form the massive remnant of CK Vul. If we could confirm the molecular component was created directly in the CE ejection and not later, the observations of the remnant could serve as a valuable reference for complex hydrodynamical simulations of CE and related phenomena.
5.3 Jet precession and binarity
The remnant components can be interpreted as ejected from the central source at varying orientations. The variation in the position angle is evident in Fig. 1. The long axis of the atomic hourglass nebula is at a position angle that is ≈–15° off with respect to the main axis of the CO lobes. Still different is the position angle (off by ≈16°) of the atomic shell directly surrounding the molecular remnant (Sect. 3.4). The bullets were ejected in yet other directions. In particular, the trajectory of the southernmost bullet is at an ≈45° angle to the main axis of the CO region. Our 3D reconstruction of the neutral and ionic molecular lobes also shows evidence of reorientation of the ejection axes. In analogy to the PNe and PPNe, these are most naturally explained by binarity of the central stellar system. Reorientation may be related to precession in the rotation axis of one of the stars or to orbital changes in the binary induced by a circumbinary disk (Artymowicz et al. 1991). Depending on the true age of the molecular remnant, the ejections could have happened at the final phases of the 17th-century eruption or decades andcenturies that followed. Here, we entertain the idea of a central binary system that has remained active long after the main eruption. Within the merger scenario, CK Vul was then a triple system before the 1670 outburst.
Studies of irregular PPNe and symbiotic systems suggest that collimated streams are ejected by the more compact star, often during or in consequence of a periastron passage near a mass-losing companion (e.g., Soker & Mcley 2013; Sahai et al. 2016; Kashi & Soker 2016). If CK Vul is indeed the remnant of a stellar-merger red-nova event, it is expected to now be a bloated star with a low surface gravity and thus may act as the donor (see below). Assuming that the maximal deprojected outflow velocity of 470 km s−1 (Sect. 3.1) is also the escape velocity of the more compact star responsible for launching of the molecular jets, we can roughly constrain the mass of the accretor. For a main sequence companion, the maximal velocity implies a mass of 0.3 M⊙ (a spectral type near M5) and a luminosity of 0.008 L⊙. Nothing that we know about CK Vul contradicts the existence of such a main sequence companion, but direct observational confirmation may be beyond our current capability. The binarity and post-outburst accretion activity of the remnant must remain in the realm of speculation for the moment.
We next consider the possible origin of the jet material. Based on the characteristics of other red-nova remnants, the coalesced star of CK Vul should resemble a red giant or a red supergiant (Kamiński et al. 2009, 2010; Chesneau et al. 2014). Such an object could develop its own radiation-driven wind similar to those in genuine red supergiants and AGB stars (Tylenda et al. 2009; Ortiz-León et al. 2020). The material of that wind could be accreted and ejected by the postulated compact companion. Within this hypothesis, the material we see in the molecular lobes would originate directly from the wind (i.e., is not the material that had been dispersed during the merger). If the mass-losing star managed to alter its surface chemical composition in the course of its dynamical relaxation following the coalescence, the jet material would have a different composition from the merger ejecta. We do observe chemical dissimilarities in the lobes and the central region in CK Vul (Paper I). However, the jet material should eventually also be shocked, and so the molecular composition that we observe today may not be the same as the original molecular composition of the wind.
Alternatively, the material that is accreted and ejected by the hypothetical companion may originate from a circumbinary disk formed prior or during the 1670 merger. Such a structure may be identified in the waist of the bipolar nebula of CK Vul. It has been shown that in many post-AGB systems that have undergone common envelope evolution, the circumstellar gas is transferred to and accreted onto the inner binary from a circumbinary disk that formed in earlier phases (Kashi & Soker 2016; Rafikov 2016; Oomen et al. 2019, and references therein). It is uncertain whether or not such a mechanism could operate in CK Vul, given the much shorter timescales necessary to effectively transfer mass to the companion. However, observations of the red-nova remnants V838 Mon and V4332 Sgr suggest that some material does fall back to the central objects decades after the merger (Rushton et al. 2005; Tylenda et al. 2009, 2015).
5.4 Alternative origins of the molecular remnant
Accretion-powered ejections are not the only viable possibility with which to explain the origin of the jet-like outflows with varying orientations. One of the scenarios worth considering is erratic mass loss from a magnetic merged star. Merger products are expected to develop strong magnetic fields (Soker & Tylenda 2007; Antonini et al. 2010; Schneider et al. 2019) which enhance mass-loss rates from such a newly formed star. In some merger scenarios, magnetic winds are considered an important sink of the excess angular momentum stored in the envelope of a merger product (cf. Braithwaite 2012). Mass loss from such an object is expected to be inhomogeneous and erratic in time and orientation. Such an expanding outflow may be deflected into bipolar lobes by a disk or a torus-like structure formed during the merger and placed in the orbital plane of the former binary. Nevertheless, observational and theoretical verification of such a scenario would be very difficult.
5.5 CK Vul analogs among PPNe?
We outline many similarities between the nebula of CK Vul and PPNe. Are there objects classified as post-AGB or PPNe that are in fact of a similar nature to CK Vul? We think that this is possible. One prominent distinction between the CK Vul remnant and bone fide PPNe is the much lower bolometric luminosity of 12–60 L⊙ compared to 104 L⊙ typical for true post-AGB stars. Some PPNe and PNe, although referred to as post-AGB, are actually thought to be post-RGB systems (cf. Oomen et al. 2019; Kamath et al. 2016) with luminosities close to the upper limit of that of CK Vul. These objects may be a good starting point in searching for a CK Vul analog. We expect the mass of the circumstellar material of post-merger systems to be systematically higher than that of true post-RGB stars with undisturbed evolution.
For many genuine post-AGB PPNe, the distance and the luminosity are unknown or poorly constrained – only a few have well-known parallaxes. Objects that appear on images like PPNe are often assumed to have luminosities of ≈104 L⊙ even though their true evolutionary status is unknown (e.g., see discussion in Bourke et al. 2000). There is a chance that relatives of CK Vul will be found among such mis-identified PPNe once their true luminosities are well constrained. Determining the distances for these heavily embedded stars, although not impossible, is difficult, as the visual extinction may be as high 100 mag.
Despite the similarities to PPNe, CK Vul is unique owing to its well-known eruptive history going back to the 17th century. Many PPNe also have kinematical ages of a few hundred years, and are suspected to have undergone an explosive-type event (e.g., Lee et al. 2013; Schmidt & Ziurys 2019). If the lobe ejections were associated with bright optical outbursts such as that of CK Vul and of other red novae, observational records from the last few centuries should have reported similar eruptive events (at least for a few younger PPNe in the northern hemisphere). No such records are known today. Perhaps the outbursts were overlooked because they were not bright in the visual. Merger progenitors can enshroud the system in dust years prior to the merger (Tylenda et al. 2011; Pejcha et al. 2016; Kashi & Soker 2017). For certain geometries, this would make the outburst essentially unobservable at visual wavelengths but bright in the infrared. Dusty infrared transients have been recognized only very recently (Tylenda et al. 2013; Jencson et al. 2019) and their link to PPNe is indeed intriguing. There is a chance that among objects classified today as PPNe are merger remnants resembling CK Vul.
6 Summary
Through 3D modeling of the optical nebula of CK Vul, we revised the distance to the object to >2.6 kpc which makes the stellar remnant and Nova 1670 significantly more luminous than assumed so far. At the revised distance, the hourglass structure is of enormous size, namely >0.9 pc, and its outermost parts move at very high speeds, >1400 km s−1. Using ALMA data from Paper I, we also reconstructed the 3D spatio-kinematical structure of the molecular remnant of CK Vul. Neutral species and ions fill walls of complex structures that could not have been created in a single mass-ejection episode. Gas is traced in a confined range of azimuthal angle. The distribution of molecular ions appears especially intricate, implying more complex ejections or an extra interaction mechanism that remains unidentified. Within the model uncertainties, the molecular remnant could have been created in the 17th-century eruption or a century later. The molecular bipolar outflows carry out only ≈40% of the total mass of the cool molecular gas. However, with de-projected speeds reaching 470 km s−1, they containmost of the kinetic energy and linear momentum of the molecular remnant. The physical parameters of CK Vul’s outflows are very similar to those of classical PPNe outflows. By analogy to current ideas of PPN formation, we propose that the elaborate molecular structures in CK Vul were created by episodic jets with varying orientation and we speculate that there may be a binary system in the remnant center. We postulate that post-merger remnants similar to CK Vul could be hiding among sources incorrectly classified as post-RGB and post-AGB objects. The current study does not challenge the interpretation of CK Vul as a remnant of a stellar merger involving an RGB star (Kamiński et al. 2018b).
Movies
Movie of Fig. 4 (Ions) Access Supplementary Material
Movie of Fig. 4 (Neutral) Access Supplementary Material
Acknowledgements
T.K. acknowledges funding from grant no 2018/30/E/ST9/00398 from the Polish National Science Center. W.S. acknowledges a support from UNAM DGAPA PASPA. R.T. acknowledges a support from grant 2017/27/B/ST9/01128 financed by the Polish National Science Center. M.H. thanks the Ministry of Science and Higher Education (MSHE) of the Republic of Poland for granting funds for the Polish contribution to the International LOFAR Telescope (MSHE decision no. DIR/WK/2016/2017/05-1) and for maintenance of the LOFAR PL-612 Baldy (MSHE decision no. 59/E-383/SPUB/SP/2019.1). V.B. acknowledges support from Spanish MICINN under project grants AYA2016–78994–P and PID2019-105203GB-C21. This paper makes use of the following ALMA data: ADS/JAO.ALMA#2017.1.00999.S, ADS/JAO.ALMA#2017.A.00030.S, ADS/JAO.ALMA#2016.1.00448.S, and ADS/JAO.ALMA#2015.A.00013.S. ALMA is a partnership of ESO (representing its member states), NSF (USA) and NINS (Japan), together with NRC (Canada), MOST and ASIAA (Taiwan), and KASI (Republic of Korea), in cooperation with the Republic of Chile. The Joint ALMA Observatory is operated by ESO, AUI/NRAO and NAOJ. The National Radio Astronomy Observatory is a facility of the National Science Foundation operated under cooperative agreement by Associated Universities, Inc. The Submillimeter Array is a joint project between the Smithsonian Astrophysical Observatory and the Academia Sinica Institute of Astronomy and Astrophysics and is funded by the Smithsonian Institution and the Academia Sinica. This work has made use of data from the European Space Agency (ESA) mission Gaia (https://www.cosmos.esa.int/gaia), processed by the Gaia Data Processing and Analysis Consortium (DPAC, https://www.cosmos.esa.int/web/gaia/dpac/consortium). Funding for the DPAC has been provided by national institutions, in particular the institutions participating in the Gaia Multilateral Agreement. Based on observations obtained at the international Gemini Observatory, a program of NSF’s NOIRLab, which is managed by the Association of Universities for Research in Astronomy (AURA) under a cooperative agreement with the National Science Foundation. on behalf of the Gemini Observatory partnership: the National Science Foundation (United States), National Research Council (Canada), Agencia Nacional de Investigación y Desarrollo (Chile), Ministerio de Ciencia, Tecnología e Innovación (Argentina), Ministério da Ciência, Tecnologia, Inovações e Comunicações (Brazil), and Korea Astronomy and Space Science Institute (Republic of Korea). Several figures in this paper were prepared with matplolib (Hunter 2007) and with SAO DS9.
References
- Alcolea, J., Bujarrabal, V., Sánchez Contreras, C., et al. 2001, A&A, 373, 932 [NASA ADS] [CrossRef] [EDP Sciences] [Google Scholar]
- Antonini, F., Montez, R., Kastner, J. H., et al. 2010, ApJ, 717, 795 [NASA ADS] [CrossRef] [Google Scholar]
- Artymowicz, P., Clarke, C. J., Lubow, S. H., et al. 1991, ApJ, 370, L35 [NASA ADS] [CrossRef] [Google Scholar]
- Bailer-Jones, C. A. L., Rybizki, J., Fouesneau, M., et al. 2018, AJ, 156, 58 [NASA ADS] [CrossRef] [Google Scholar]
- Balick, B., & Frank, A. 2002, ARA&A, 40, 439 [NASA ADS] [CrossRef] [Google Scholar]
- Bourke, T., Hyland, A. R., Robinson, G., et al. 2000, Asymmetrical Planetary Nebulae II: From Origins to Microstructures (San Francisco: ASP), 171 [Google Scholar]
- Braithwaite, J. 2012, MNRAS, 422, 619 [CrossRef] [Google Scholar]
- Bujarrabal, V., García-Segura, G., Morris, M., et al. 2000, Asymmetrical Planetary Nebulae II: From Origins to Microstructures (San Francisco: ASP), 201 [Google Scholar]
- Bujarrabal, V., Castro-Carrizo, A., Alcolea, J., et al. 2001, A&A, 377, 868 [NASA ADS] [CrossRef] [EDP Sciences] [Google Scholar]
- Bujarrabal, V., Castro-Carrizo, A., Alcolea, J., et al. 2016, A&A, 593, A92 [NASA ADS] [CrossRef] [EDP Sciences] [Google Scholar]
- Bujarrabal, V., Castro-Carrizo, A., Van Winckel, H., et al. 2018, A&A, 614, A58 [NASA ADS] [CrossRef] [EDP Sciences] [Google Scholar]
- Chamandy, L., Blackman, E. G., Frank, A., et al. 2020, MNRAS, 495, 4028 [CrossRef] [Google Scholar]
- Chesneau, O., Millour, F., De Marco, O., et al. 2014, A&A, 569, L3 [NASA ADS] [CrossRef] [EDP Sciences] [Google Scholar]
- Evans, A., Gehrz, R. D., Woodward, C. E., et al. 2016, MNRAS, 457, 2871 [NASA ADS] [CrossRef] [Google Scholar]
- Eyres, S. P. S., Evans, A., Zijlstra, A., et al. 2018, MNRAS, 481, 4931 [NASA ADS] [Google Scholar]
- Gaia Collaboration (Brown, A. G. A., et al.) 2021, A&A, in press, https://doi.org/10.1051/0004-6361/202039657 [Google Scholar]
- Hajduk, M., Zijlstra, A. A., van Hoof, P. A. M., et al. 2007, MNRAS, 378, 1298 [NASA ADS] [CrossRef] [Google Scholar]
- Hajduk, M., van Hoof, P. A. M., & Zijlstra, A. A. 2013, MNRAS, 432, 167 [NASA ADS] [CrossRef] [Google Scholar]
- Huang, P.-S., Lee, C.-F., Moraghan, A., et al. 2016, ApJ, 820, 134 [NASA ADS] [CrossRef] [Google Scholar]
- Hunter, J. D. 2007, Comput. Sci. Eng., 9, 90 [NASA ADS] [CrossRef] [Google Scholar]
- Ivanova, N., Justham, S., Chen, X., et al. 2013, A&A Rev., 21, 59 [NASA ADS] [CrossRef] [MathSciNet] [Google Scholar]
- Jencson, J. E., Kasliwal, M. M., Adams, S. M., et al. 2019, ApJ, 886, 40 [CrossRef] [Google Scholar]
- Jones, D., & Boffin, H. M. J. 2017, Nat. Astron., 1, 0117 [CrossRef] [Google Scholar]
- Kamath, D., Wood, P. R., Van Winckel, H., et al. 2016, A&A, 586, L5 [NASA ADS] [CrossRef] [EDP Sciences] [Google Scholar]
- Kamiński, T., Schmidt, M., Tylenda, R., et al. 2009, ApJS, 182, 33 [NASA ADS] [CrossRef] [Google Scholar]
- Kamiński, T., Schmidt, M., & Tylenda, R. 2010, A&A, 522, A75 [NASA ADS] [CrossRef] [EDP Sciences] [Google Scholar]
- Kamiński, T., Menten, K. M., Tylenda, R., et al. 2015, Nature, 520, 322 [NASA ADS] [CrossRef] [PubMed] [Google Scholar]
- Kamiński, T., Menten, K. M., Tylenda, R., et al. 2017, A&A, 607, A78 [NASA ADS] [CrossRef] [EDP Sciences] [Google Scholar]
- Kamiński, T., Steffen, W., Tylenda, R., et al. 2018a, A&A, 617, A129 [NASA ADS] [CrossRef] [EDP Sciences] [Google Scholar]
- Kamiński, T., Tylenda, R., Menten, K. M., et al. 2018b, Nat. Astron., 2, 778 [NASA ADS] [CrossRef] [Google Scholar]
- Kaminski, T., Menten, K. M., Tylenda, R., et al. 2020, A&A, 644, A59 [CrossRef] [EDP Sciences] [Google Scholar]
- Kashi, A., & Soker, N. 2016, Res. Astron. Astrophys., 16, 99 [NASA ADS] [CrossRef] [Google Scholar]
- Kashi, A., & Soker, N. 2017, MNRAS, 467, 3299 [Google Scholar]
- Kato, T. 2003, A&A, 399, 695 [NASA ADS] [CrossRef] [EDP Sciences] [Google Scholar]
- Lee, C.-F., Sahai, R., Sánchez Contreras, C., et al. 2013, ApJ, 777, 37 [NASA ADS] [CrossRef] [Google Scholar]
- Livio, M., & Soker, N. 1988, ApJ, 329, 764 [NASA ADS] [CrossRef] [Google Scholar]
- MacLeod, M., Macias, P., Ramirez-Ruiz, E., et al. 2017, ApJ, 835, 282 [NASA ADS] [CrossRef] [Google Scholar]
- MacLeod, M., Ostriker, E. C., & Stone, J. M. 2018, ApJ, 868, 136 [NASA ADS] [CrossRef] [Google Scholar]
- Miller Bertolami, M. M., Althaus, L. G., Olano, C., et al. 2011, MNRAS, 415, 1396 [NASA ADS] [CrossRef] [Google Scholar]
- Naylor, T., Charles, P. A., Mukai, K., et al. 1992, MNRAS, 258, 449 [NASA ADS] [CrossRef] [Google Scholar]
- Oomen, G.-M., Van Winckel, H., Pols, O., et al. 2019, A&A, 629, A49 [CrossRef] [EDP Sciences] [Google Scholar]
- Ortiz-León, G. N., Menten, K. M., Kamiński, T., et al. 2020, A&A, 638, A17 [CrossRef] [EDP Sciences] [Google Scholar]
- Paczyński, B. 1976, Structure and Evolution of Close Binary Systems (Dordrecht: Springer), 75 [CrossRef] [Google Scholar]
- Pastorello, A., Mason, E., Taubenberger, S., et al. 2019, A&A, 630, A75 [NASA ADS] [CrossRef] [EDP Sciences] [Google Scholar]
- Pejcha, O., Metzger, B. D., & Tomida, K. 2016, MNRAS, 455, 4351 [NASA ADS] [CrossRef] [Google Scholar]
- Prieto, J. L., Sellgren, K., Thompson, T. A., et al. 2009, ApJ, 705, 1425 [NASA ADS] [CrossRef] [Google Scholar]
- Rafikov, R. R. 2016, ApJ, 830, 8 [NASA ADS] [CrossRef] [Google Scholar]
- Rosenbush, A. 2020, Astron. Notes, submitted [arXiv:2007.11025] [Google Scholar]
- Rushton, M. T., Geballe, T. R., Evans, A., et al. 2005, MNRAS, 359, 624 [NASA ADS] [CrossRef] [Google Scholar]
- Sahai, R., & Trauger, J. T. 1998, AJ, 116, 1357 [NASA ADS] [CrossRef] [Google Scholar]
- Sahai, R., Scibelli, S., & Morris, M. R. 2016, ApJ, 827, 92 [NASA ADS] [CrossRef] [Google Scholar]
- Sánchez Contreras, C., & Sahai, R. 2001, ApJ, 553, L173 [NASA ADS] [CrossRef] [Google Scholar]
- Sánchez Contreras, C., Bujarrabal, V., Neri, R., et al. 2000, A&A, 357, 651 [Google Scholar]
- Sánchez Contreras, C., Gil de Paz, A., & Sahai, R. 2004, ApJ, 616, 519 [NASA ADS] [CrossRef] [Google Scholar]
- Schmidt, D. R., & Ziurys, L. M. 2019, ApJ, 881, L38 [CrossRef] [Google Scholar]
- Schneider, F. R. N., Ohlmann, S. T., Podsiadlowski, P., et al. 2019, Nature, 574, 211 [NASA ADS] [CrossRef] [Google Scholar]
- Shara, M. M.,& Moffat, A. F. J. 1982, ApJ, 258, L41 [NASA ADS] [CrossRef] [Google Scholar]
- Shara, M. M., Moffat, A. F. J., & Webbink, R. F. 1985, ApJ, 294, 271 [NASA ADS] [CrossRef] [Google Scholar]
- Shiber, S., Iaconi, R., De Marco, O., et al. 2019, MNRAS, 488, 5615 [CrossRef] [Google Scholar]
- Soker, N., & Kashi, A. 2012, ApJ, 746, 100 [NASA ADS] [CrossRef] [Google Scholar]
- Soker, N., & Mcley, L. 2013, ApJ, 772, L22 [CrossRef] [Google Scholar]
- Soker, N., & Rappaport, S. 2001, ApJ, 557, 256 [NASA ADS] [CrossRef] [Google Scholar]
- Soker, N., & Tylenda, R. 2007, MNRAS, 375, 909 [NASA ADS] [CrossRef] [Google Scholar]
- Sparks, W. B., Bond, H. E., Cracraft, M., et al. 2008, AJ, 135, 605 [NASA ADS] [CrossRef] [Google Scholar]
- Steffen, W., & Koning, N. 2017, Astron. Comput., 20, 87 [NASA ADS] [CrossRef] [Google Scholar]
- Steffen, W., & López, J. A. 2006, Planetary Nebulae in Our Galaxy and Beyond (Cambridge: Cambridge University Press), 517 [Google Scholar]
- Tylenda, R. 2005, A&A, 436, 1009 [NASA ADS] [CrossRef] [EDP Sciences] [Google Scholar]
- Tylenda, R., & Soker, N. 2006, A&A, 451, 223 [NASA ADS] [CrossRef] [EDP Sciences] [Google Scholar]
- Tylenda, R., Kamiński, T., & Schmidt, M. 2009, A&A, 503, 899 [NASA ADS] [CrossRef] [EDP Sciences] [Google Scholar]
- Tylenda, R., Hajduk, M., Kamiński, T., et al. 2011, A&A, 528, A114 [NASA ADS] [CrossRef] [EDP Sciences] [Google Scholar]
- Tylenda, R., Kamiński, T., Udalski, A., et al. 2013, A&A, 555, A16 [NASA ADS] [CrossRef] [EDP Sciences] [Google Scholar]
- Tylenda, R., Górny, S. K., Kamiński, T., et al. 2015, A&A, 578, A75 [NASA ADS] [CrossRef] [EDP Sciences] [Google Scholar]
- Tylenda, R., Kamiński, T., & Mehner, A. 2019, A&A, 628, A124 [CrossRef] [EDP Sciences] [Google Scholar]
- Zou, Y., Frank, A., Chen, Z., et al. 2020, MNRAS, 497, 2855 [CrossRef] [Google Scholar]
All Tables
All Figures
|
Fig. 1 Large-scale hourglass nebula of CK Vul. The background optical image shows the nebular emission in lines of Hα and [N II]. Although most stars are removed from the image, some considerable residuals can be seen (most of the point-like sources; Hajduk et al. 2007). The red dashed rectangle of 26′′ × 31′′ corresponds to the size of the maps in Fig. 11. The cyan contours show emission of CO 1–0. The dashed lines mark the symmetry axes of: the large hourglass nebula (green), the CO region (black), and the optical shell immediately surrounding the molecular nebula (magenta). |
| In the text | |
|
Fig. 2 Three-dimensional model of the atomic hourglass nebula of CK Vul. Left: observed image of the nebula (same as in Fig. 1). Bright nebula regions shown in yellow and magenta are not considered to be parts of the hourglass. Center: bipolar-shell model rendered as a mesh overplotted on the observed image. Right: simulated image of the nebula for our line of sight. Polar regions have enhanced emissivity while emission adjacent to them was suppressed. |
| In the text | |
|
Fig. 3 General shape of the molecular lobes in our 3D reconstruction. The outer shells are represented by meshes viewed from four angles. The front view is that for a terrestrial observer but, for convenience, rotated by a position angle of –17°. The northern lobe is shown with a white mesh, southern with a blue one. Cartesian xyz axes are shown for reference in red, green, and blue, respectively. The blue axis corresponds to the line of sight. The convention of counting the azimuthal (θ) and polar (ϕ) angles is shown in the inset. Each lobe is ~8′′ long. |
| In the text | |
|
Fig. 4 Reconstructed density structure of the neutral gas in CK Vul. The blue bar corresponds to the line of sight. See also the online movie. Another online movie shows the molecular ions in CK Vul. |
| In the text | |
|
Fig. 5 Comparison of observed (top) and modeled (bottom) PV diagrams of SiO emission along the slits shown in Fig. 6. |
| In the text | |
|
Fig. 6 Locations of virtual slits used to generate the PV diagrams in Figs. 5 and 8. The background images show weighted-mean emission in several transitions of SiO (left) and combined N2 H+ and HCO+ emission (right; cf. Paper I). |
| In the text | |
|
Fig. 7 Combined model of nested shells. The model includes two large-scale CO bubbles (pink and white) and shells of ionized molecules (blue and yellow). The outer shells from Fig. 3 are both shown here in blue. |
| In the text | |
|
Fig. 8 Comparison of observed (top) and modeled (bottom) PV diagrams of ionic emission along the slits shown in Fig. 6. Ellipses drawn with red dashed lines mark locations of loops discussed in the text. |
| In the text | |
|
Fig. 9 Total intensity map of 12CO 1–0 restored with natural weighting of visibilities. The 3σ level is shown with a red contour. The orange dashed contour shows the 3σ level for combined emission in several lines of HCN and H13CN. Dashed lines indicate locations of four virtual slits for which PV diagrams are shown in Fig. 10. |
| In the text | |
|
Fig. 10 Position-velocity diagrams of CO 1–0 emission for the four virtual slits shown in Fig. 9. The dashed ellipses mark features that are only seen in CO emission. Entire emission seen within slit a is seen exclusively in CO. |
| In the text | |
|
Fig. 11 Relative location of atomic and molecular gas in the inner remnant. The color images in the left and right panels represent, respectively, CO 1–0 and optical nebular emission near Hα. The latter is also shown as contours on both maps. Nearly all unrelated continuum sources were removed from both maps. The main features are labeled in the right map. The dashed line roughly marks emission of a partially broken shell of recombining gas that appears to surround the molecular remnant (see text). The bullet is one of the two features studied in Hajduk et al. (2007) and whose proper motions indicate an ejection in 1670. |
| In the text | |
Current usage metrics show cumulative count of Article Views (full-text article views including HTML views, PDF and ePub downloads, according to the available data) and Abstracts Views on Vision4Press platform.
Data correspond to usage on the plateform after 2015. The current usage metrics is available 48-96 hours after online publication and is updated daily on week days.
Initial download of the metrics may take a while.