Free Access
Fig. 10
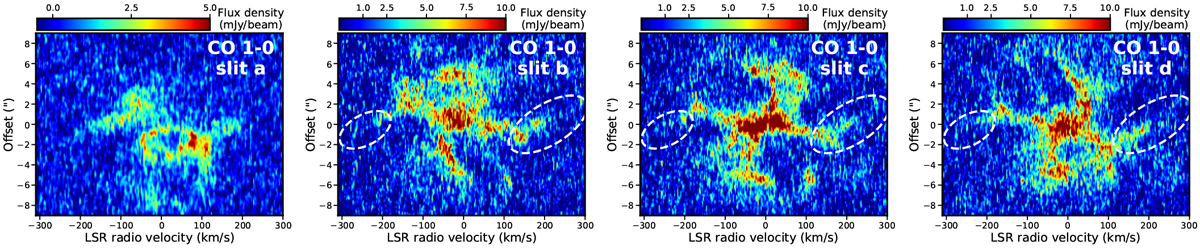
Position-velocity diagrams of CO 1–0 emission for the four virtual slits shown in Fig. 9. The dashed ellipses mark features that are only seen in CO emission. Entire emission seen within slit a is seen exclusively in CO.
Current usage metrics show cumulative count of Article Views (full-text article views including HTML views, PDF and ePub downloads, according to the available data) and Abstracts Views on Vision4Press platform.
Data correspond to usage on the plateform after 2015. The current usage metrics is available 48-96 hours after online publication and is updated daily on week days.
Initial download of the metrics may take a while.