| Issue |
A&A
Volume 672, April 2023
|
|
|---|---|---|
| Article Number | A196 | |
| Number of page(s) | 12 | |
| Section | Interstellar and circumstellar matter | |
| DOI | https://doi.org/10.1051/0004-6361/202244497 | |
| Published online | 21 April 2023 | |
Lithium in red novae and their remnants
1
Nicolaus Copernicus Astronomical Center, Polish Academy of Sciences,
Rabiańska 8,
87-100
Toruń,
Poland
e-mail: This email address is being protected from spambots. You need JavaScript enabled to view it.
2
Space Radio-Diagnostics Research Centre, University of Warmia and Mazury,
ul. Oczapowskiego 2,
10-719
Olsztyn,
Poland
3
Astronomical Observatory, University of Warsaw,
Al. Ujazdowskie 4,
00-478
Warszawa,
Poland
4
Institute of Astronomy, Nicolaus Copernicus University in Toruń,
Grudziądzka 5,
87-100
Toruń,
Poland
Received:
13
July
2022
Accepted:
26
February
2023
Abstract
Context. Galactic red novae are thought to be produced in stellar mergers between non-compact stars, such as main-sequence stars and cool giants. It is hoped that they will help explain the physical processes involved in common-envelope evolution and stellar binary collisions.
Aims. We investigate the presence of lithium in the three best observed Galactic red nova remnants. Explaining the origin of lithium may point to a mixing mechanism present before, during, or after the merger.
Methods. We compared the lithium line at 6707.81 Å to a feature of Ca I] at 6572.78 Å to derive relative abundances in circumstellar gas. We next calculated absolute abundances, assuming the solar calcium-to-lithium abundance ratio.
Results. Our analysis yields the following lithium abundances: A(Li) = 2.3 for V838 Mon, A(Li) = 2.5 for CK Vul, and A(Li) = 1.8 for V1309 Sco.
Conclusions. The super-solar lithium abundances in red novae may suggest that at least some merger products activate mixing mechanisms capable of producing lithium, but other interpretations are possible. In particular, the merger product of V838 Mon may be enhanced in lithium by the matter of one of the progenitor stars. Early observations of lithium in V838 Mon and V1309 Sco hint that Li-producing mechanisms, if present, activate early, perhaps already in the common-envelope phase. Determining the origin of lithium in red novae requires further investigation and a larger sample of measured stars.
Key words: stars: abundances / circumstellar matter / stars: mass-loss / stars: individual: V838 Mon / stars: individual: CK Vul / stars: individual: V1309 Sco
© The Authors 2023
 Open Access article, published by EDP Sciences, under the terms of the Creative Commons Attribution License (https://creativecommons.org/licenses/by/4.0), which permits unrestricted use, distribution, and reproduction in any medium, provided the original work is properly cited.
This article is published in open access under the Subscribe to Open model. This email address is being protected from spambots. You need JavaScript enabled to view it. to support open access publication.
1 Introduction
Red novae (or luminous red novae) are a group of eruptive stars that may outburst as stellar mergers of non-compact1 stars (Tylenda & Soker 2006; Tylenda et al. 2011a; Pastorello et al. 2019b). Five Galactic objects are currently classified as belonging to this group: CK Vul (also known as Nova 1670), V4332 Sgr (Nova Sgr 1994), V838Mon (Nova Mon 2002), V1309 Sco (Nova Sco 2008), and EWS 2002-OGLE-BLG-360. Other Galactic stellar-merger remnants have recently been identified (e.g., TYC 2597-735-1; Hoadley et al. 2020; see also Melis 2020), but red novae are distinguished in that they are observed during the outburst caused by the coalescing stars. Unlike supernovae and classical novae, which are powered by nuclear processes, red novae are primarily powered by accretion and, as a consequence, do not reach high temperatures. In particular, although they share a similar name with “classical novae” (Della Valle & Izzo 2020), red novae do not go through the hot coronal phase characterized by temperatures on the order of 105 K, are typically of higher luminosity, and are much rarer (Howitt et al. 2020). Stellar remnants of red novae – that is, the products of the coalescence – are cool giants or supergiants with effective temperatures of 2000–3000 K. Owing to this low photospheric temperature and to mass-loss phenomena (at different stages), the circumstellar media of the merger products are remarkably rich in cool gas, which is often present in the molecular form, and quickly become enshrouded in dust. The circumstellar envelopes of red nova remnants are very complex as they combine material lost prior, during, and after the merger. Many of the studied structures are asymmetric, indicating the possible formation of disks, jets, wide-angle outflows, and inhomogeneous winds. This complexity seems to hold the key to our understanding of the physical mechanisms that drive stellar systems to merge as well as the merger process itself.
Though we only know of a few Galactic red novae, we do know that they are an inhomogeneous group of variables. While the V838 Mon progenitor was a young (< 20 Myr; Afşar & Bond 2007) triple system (Kamiński et al. 2021b) with an 8 M⊙ primary and a low-mass protostar (Tylenda et al. 2005b), most of the other known red novae were systems of solar-mass stars (1–2 M⊙) that were evolved at the time of the outburst: V1309 Sco and V4332 Sgr were contact systems of two subgiants (Stȩpień 2011), while EWS 2002-BLG-360 and CK Vul were systems that contained a red giant branch (RGB) star (Tylenda et al. 2013; Kamiński et al. 2018b; MacLeod et al. 2022). The timescales on which we have studied the remnants of Galactic red novae are typically short, on the order of decades at most (V4332 Sgr erupted in 1994), but the outburst of CK Vul was first observed in 1670–1672 (Hevelius 1671; Shara et al. 1985), giving us a timescale of over 350 yr. The youngest Galactic red nova, V1309 Sco, erupted in 2008. A brief overview of these objects is provided in Kamiński et al. (2018a).
Over a dozen extragalactic red nova analogs (also known as luminous red novae or, more broadly, intermediate luminosity optical transients) have been identified in the Local Group (e.g., Bond & Siegel 2006; Pastorello et al. 2019a,b, 2021a,b; Blagorodnova et al. 2017, 2020, 2021; Williams et al. 2015, 2020; Kurtenkov et al. 2015; MacLeod et al. 2017; Smith et al. 2016; Rau et al. 2007; Cai et al. 2019, 2022). However, information on their progenitors and remnants is sparse. Due to a lack of adequate spectral observations, they are not the main subject of this study.
In recent years, red novae have been recognized as important objects for understanding the physics of common-envelope evolution and stellar mergers. The focus on red novae especially intensified when the V1309 Sco progenitor, relatively well observed before the red nova outburst in 2008, was recognized to have been an eclipsing contact binary in-spiraling into a common-envelope phase (Tylenda et al. 2011a; Pejcha 2014; Pejcha et al. 2016a). Observations of red novae and their remnants are used to investigate the mechanisms behind common-envelope evolution and merger events, including the associated mass-loss phenomena (e.g., Ivanova et al. 2013; Nandez et al. 2014; Soker & Kaplan 2021; Soker 2021, 2020a,b, 2019, 2016; Soker & Kashi 2012; MacLeod et al. 2022, 2018a,b; MacLeod & Loeb 2020; Pejcha 2014; Pejcha et al. 2016a,b, 2017; Metzger & Pejcha 2017; Iaconi et al. 2018, 2019; Reichardt et al. 2019).
When studying individual red nova remnants, we noticed that at least three of them – the three best observed objects, that is, V838Mon, CK Vul, and V1309 Sco – show clear signatures of lithium in their spectra. Since lithium is generally destroyed in stars, these spectral features usually imply lithium enhancement. Overabundance of lithium in stars, especially evolved ones, is not entirely understood but generally points to effective mixing mechanisms in stellar interiors (e.g., Magrini et al. 2021). Curious as to whether lithium in red novae can be used to identify similar mixing mechanisms and, in turn, shed light on merger physics, we investigated the lithium features in the Galactic red novae using the methods described in Sect. 2. We next constrained lithium content and discuss its origin in V838 Mon, CK Vul, and V1309 Sco in Sects. 3, 4.1, and 5, respectively. We briefly comment on the presence of lithium in V4332 Sgr in Sect. 5.3. The fifth known Galactic red nova, EWS 2002-BLG-360, is not discussed here as no relevant observational data exist for this heavily dust-enshrouded object (Tylenda et al. 2013). We draw our final conclusions in Sect. 6.
2 Methodology
We analyzed the presence of lithium in red nova remnants based on observations of a single feature of 7Li I at 6707 Å, which is formed in the circumstellar gas, not in the photosphere. The feature is a tight doublet of lines separated by 0.15 Å, or 6.7 km s−1. This split is insignificant compared to the local turbulence and kinematic broadening of the features in all analyzed objects. We assumed a weighted mean central wavelength of 6707.81 Å as the reference wavelength of the doublet; we used the transitions’ oscillator strengths as weights (Wiese & Fuhr 2009) in the calculation. Stars rich in lithium occasionally also display features near 6103.6 and 8126.5 Å, which are nonresonant transitions and are not expected to be strong in cool circumstellar matter. We do not find any photospheric Li I features at these wavelengths either. Additionally, the λ6103 transition of Li I overlaps with a line of Ca I at 6102.72 Å, and information on the lithium content cannot be easily extracted from this spectral range. The 8126.5 Å transition is problematic because it is within a telluric band.
In order to derive relative and absolute (i.e., relative to H) abundances of Li I, we compared the λ6707 feature to the resonance line of Ca I at 6572.78 Å. This Ca line is the only semi-forbidden transition among the resonance lines observed toward our sources, and thus it is the least impacted by saturation effects. Its profile is very similar to the Li I line profile in all our targets. Calcium features have been used in the analysis of lithium content in other objects (Wallerstein & Conti 1969), including classical novae (Izzo et al. 2022). However, in circumstellar and interstellar matter, calcium is strongly depleted because it condenses into dust, limiting its usefulness as a reference element. For instance, in the wind of the carbon star CWLeo, calcium was found to be depleted by a factor of 300 with respect to solar abundances (Mauron & Huggins 2010) and by over 3000 in the diffuse interstellar medium (Whittet 1992). Observed species with less significant depletion, for example Na or K, despite being observed in the same outflows of red nova remnants, have lines that are too saturated to be useful in our analysis. If calcium is depleted into dust in the analyzed outflows, our estimates of the absolute abundances of lithium should be treated as upper limits. Depletion of lithium into dust is, in contrast, very small. For instance, Field (1974) found it is depleted by a factor of 2 in the interstellar medium.
Assuming both absorption lines are optically thin or have very similar optical depths, and measuring their equivalent widths, W, we can obtain the column density of Li I relative to Ca I as
 (1)
(1)
Here, f and λ are the oscillator strength and central wavelength of the transition, respectively. We adopted fLiI = 0.75 for the Li I line, which is a sum of the oscillator strengths of the doublet, and fCaI = 5.1 × 10⁻⁵ for the Ca I line. Both species have similar ionization potentials (5.4 and 6.1 eV for Li I and Ca I, respectively), and thus we assumed they have similar ionization fractions. We further assumed that both species are chiefly in the ground state. This is justified by the very low temperatures, a few hundred Kelvin, in the analyzed media. The derived column density ratio can then be interpreted as the relative abundance ratio. Adopting now the solar abundance of Ca of A(Ca) = 6.36 (Grevesse & Sauval 1998) in our objects, we can constrain the Li abundance relative to hydrogen as A(Li) = log(NLiI/NCaI) + A(Ca) (where A(X) = log NX/NH + 12).
3 Lithium in outflows of V838 Mon
The λ6707 line of Li I has been one of the strongest atomic features in the post-outburst spectra of V838 Mon (see below), but it was also clearly present during the outburst, which began at the beginning of January 2002 and had a visual light curve with three peaks. Munari et al. (2002) found a broad – thus circumstellar – feature of Li I as early as in late January, just before the main (second) outburst of V838 Mon. In a quasi-photospheric spectrum observed in March 2002 (i.e., shortly after the third outburst), Kipper et al. (2004) derived a lithium abundance of A(Li) = 3.8. In an improved analysis of the same observational material, Kipper & Škoda (2007) derived A(Li) = 3.4. Thus, in March 2002 the lithium abundance was certainly super-solar (A⊙(Li) = 1.12, Grevesse & Sauval 1998) and marginally super-meteoritic (Amet(Li) = 3.31). We took a closer look at the circumstellar lithium line monitored through highresolution spectra obtained in much later epochs, from 2005 to 2020.
The spectra used in our analysis represent five epochs and are listed in Table 1. As illustrated in Fig. 1, the Ca I profile closely follows the variations in the Li I profile over the years. Both transitions, however, are located in spectral ranges where it is difficult to assess the local pseudo-continua. The presented profiles were normalized by dividing the spectra by high-order polynomials, which were fitted in arbitrarily selected spectral ranges. The Li I line is located between the TiO γ 1–0 R1 and R2 band heads. Their shape influences the underlying “baseline.” Depending on the actual shape of the TiO absorption bands, the Li I profile may or may not possess an emission component at velocities higher than 80 km s−1. This is illustrated in Fig. 1 for the 2005 epoch, for which we present two alternative normalizations of the Li I spectrum. This epoch was the most challenging case.
The Ca I line, on the other hand, is heavily polluted by overlapping absorption bands of the TiOγ (5–3, 6–4) and TiOγ′ (0–1) systems, which makes a correction for the baseline difficult too. For both species, we attempted a normalization by dividing by the spectra of other cool stars or by TiO simulations, but the temperature and velocity structure of the TiO circumstellar gas of V838 Mon is too complex for this approach to work satisfactorily well (but see an example in Fig. A.1). We therefore performed a further analysis with spectra normalized by polynomials. In this approach, we assumed that the atomic line profile is formed by absorbing light from the TiO absorption spectrum, which may not be the case if TiO and neutral atomic gas are well mixed along the line of sight. Full radiative transfer including all opacity sources would be necessary to make a more realistic analysis. Also, all profiles are contaminated by low-amplitude TiO features, on the order of 0.1 of continuum, and the Ca I line is additionally affected by weak telluric features. All these shortcomings increase the uncertainty of the derived abundances, but do not change our overall conclusions.
The profile evolution of the two lines is very similar. The P-Cyg profile from 2005 changed into a double broad absorptiondominated feature in 2009. This slight doubling continued to 2012, but sometime after that the two subcomponents split entirely; since ≈2018 they have been two well-separated velocity components. Both components in both lines become weaker with time, but the Ca I component at the most negative velocities is barely distinguishable from baseline variations from 2020. Taking a closer look, however, the profiles of both species display some differences. A Li I component at extreme heliocentric velocities (i.e., ≤−95 km s−1) has no corresponding absorption in the Ca I profile. Hereafter, we call this Li-rich and Ca-poor component VmaxL. A component that formed the well-separated absorption in Ca I in later epochs, between about −100 and −55 km s−1, is designated VmaxC. The range of intermediate velocities, between about −55 and +25 km s−1, where absorption nearly disappeared in later epochs, is designated as Vmid. All the components mentioned so far can be attributed to outflows caused by the 2002 eruption, which is known to have been associated with mass loss at changing terminal velocities. In the velocity range Vwind between about 25 and 75 km s−1, the latter being the systemic velocity measured from SiO maser observations (Deguchi et al. 2005; Ortiz-León et al. 2020), in late epochs we observe a well-separated component that we assign to the ongoing mass loss (wind) from the coalesced star (cf. Tylenda et al. 2005a; Kamiński et al. 2021b). All components are graphically presented in Fig. 1. There may be an extra narrow component at velocities higher than that of the maser, indicative of a fallback onto the star, but it is too weak to be analyzed here.
We measured equivalent widths of the different components and derived the relative and absolute abundances of Li I in V838 Mon. The results are presented in Table 2. The ratios we obtain for different epochs and different parts of the outflow are very consistent and on average give log(NLiI/NCaI) = −4.0. This constrains the absolute abundance of lithium at A(Li) = 2.3, an order of magnitude lower than that constrained from 2002 quasi-photospheric spectra. At the same time, in the component VmaxL at the highest velocity, where no Ca I emission is observed, the lithium abundance should be at least one order of magnitude higher, that is, close to or higher than the meteoritic value.
We assumed that the analyzed lines are optically thin or at least have similar optical depths. We modeled the Li I P Cyg features of V838 Mon from 2005 using the same techniques as in Tylenda et al. (2005a, their Sect. 5.2). We find the mean optical depth of the λ6572 line to be τ ≲ 4. The line was thus only moderately thick. The lines very likely became even more optically thin in later epochs due to expansion.
High-resolution observations of V838 Mon used in the analysis of the Li I line.
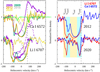 |
Fig. 1 Profiles of the λ6572 line of Ca I and the λ6707 line of Li I in V838 Mon. Normalization of the spectra is uncertain, in particular for the Li I profile from 2005, which may display a profile with (dashed purple) or without (solid purple) emission (see text). The alternative profile normalization for the 2005 epoch shown with a dashed line was divided by 1.3 for better clarity. The Ca I profile is contaminated by two weak telluric features (light green), whose position and depth is different for all epochs but is close to the sample telluric spectrum, presented as the light green line. The dashed vertical line indicates the velocity of the SiO maser, which usually is indicative of the systemic velocity. The left panel shows changes in each profile over time, while the right panel compares profiles of both species for two sample epochs. Spectral regions highlighted in cyan and yellow were measured for relative line intensities (Table 2). |
Equivalent widths of the Li I and Ca I lines in V838 Mon.
3.1 Origin of lithium in V838 Mon
The observations show that lithium was present in the early phases of the outburst, possibly at very high, nearly meteoritic, abundances. Our observations show that lithium had a significant abundance in the matter lost during the 2002 event and in the wind of the coalesced star. The latter indirectly indicates that lithium is also present in the photosphere. We consider three possible sources of the lithium in V838 Mon: (i) an external enrichment through the material of the lower-mass star that merged with the B-type primary in 2002; (ii) lithium originating from the un-depleted outer layers of the B star itself; and (iii) internal lithium production within the rebuilt coalesced star.
3.1.1 Lithium from the progenitor secondary
In the V838 Mon merger hypothesis of Tylenda & Soker (2006), the main-sequence B-type star (or an A-type protostar) collides with a low-mass protostar with a mass of 0.1–0.5 M⊙. This mass is very uncertain, since it was calculated as the mass needed to be accreted onto the 8 M⊙ star to account for the observed power of the outburst. A young age for the progenitor is implied by its membership to a small open cluster (Afşar & Bond 2007), which is still surrounded by large quantities of molecular gas and dust (Kamiński et al. 2011; Tylenda & Kamiński 2012). The presence of early B-type dwarfs implies an upper limit on the age of the cluster of ≤25 Myr, but observations of the translucent molecular cloud near the cluster suggest an even younger age, 3–10 Myr.
The youngest low-mass protostars are known to be lithium-rich (A(Li)) ≈ 3), but, as they are fully convective, they lose lithium very quickly on the way to the main sequence. It is estimated that the Li-depletion timescale is the quickest for stars with masses of 0.6 M⊙, which deplete lithium in about 20 Myr (White & Hillenbrand 2005). The timescales are comparably quick for the masses considered for the secondary progenitor (Bildsten et al. 1997). For instance, for a 0.3 M⊙ protostar, 100-fold Li depletion is expected to take 28 Myr, and a lithium reduction by a factor of 2 takes 18 Myr (Chabrier et al. 1996). Some observations indicate that low-mass protostars (as young as 8 Myr) may be Li depleted sooner than theoretically expected (White & Hillenbrand 2005; Yee & Jensen 2010; Jeffries et al. 2017).
If the age of the V838 Mon progenitor is at the lower end of the suggested range (i.e., < 10 Myr), the low-mass star could still have been rich in Li. This lithium-rich material could have been seen during the outburst and is seen now in the wind (and thus photosphere) of V838 Mon. Stellar-merger simulations show that the matter of the lower-mass body forms the outer layers of the merger product (e.g., Tylenda & Soker 2006; Sills et al. 2001), which would explain the persistent presence of Li in the remnant. Ongoing convection and other mixing mechanisms that do not tap the hot 3He-rich layers will decrease the Li abundance with time.
Additionally, the low-mass protostar could have been surrounded by a protoplanetary disk. Such a disk is expected to be Li rich, as it would be enhanced in lithium produced by spallation. We calculate that, to produce the observed lithium enhancement in an envelope of 0.1 M⊙ of the coalesced star, the primary would have to accrete 0.01 M⊙, or 10 Jupiter masses, of material with a meteoritic abundance of lithium. This is not impossible given the typical masses of protoplanetary disks of low-mass stars (e.g., Andersen et al. 2019), but the survival of such a disk in a close binary with a B3 star is very questionable.
If the progenitor age is closer to ~25 Myr (or if the actual lithium depletion is more effective in low-mass stars than described by theoretical models), the secondary could not have been the main source of lithium in the remnant.
3.1.2 Lithium from the primary progenitor
The progenitor primary of spectral type B3 V is expected to have had a radiative external shell that, during the evolution of a single nonrotating star, should have preserved the original, nearly meteoritic, abundance of Li. However, early B-type stars are often rapid rotators and show a considerable depletion of light elements, such as lithium and boron, primarily as a result of rotational mixing (e.g., Heger et al. 2000; Brott et al. 2011; Proffitt et al. 2016). While lithium cannot be observed in these stars due to the lack of a suitable spectroscopic tracer at photospheric temperatures, a line of B III is observed in the ultraviolet, enabling depletion studies and showing that B depletion levels can be as high as 2 dex, even in relatively young stars (4–16Myr; e.g., Venn et al. 2002; Mendel et al. 2006; Proffitt et al. 2016). The level of depletion of light elements is expected to be stronger for stars with faster rotation and steeper for lithium than for boron (e.g., Heger & Langer 2000). We expect the B-type progenitor of V838 Mon to have been a fast rotator because V838 Mon is a member of a young cluster (Afşar & Bond 2007) and has a B3 companion with υ sin i = 250 ± 50 km s−1 (Kamiński et al. 2009). We thus expect that, at the time of the collision, the progenitor was significantly depleted in Li, with abundances below the currently measured value of 2.3. One could argue that the theory of rotational mixing is not free of inconsistencies (Langer et al. 2010; Proffitt et al. 2016) and that there is a wide scatter in the measured depletion levels (cf. Kaufer 2010), so it is not entirely sure that the radiative envelope of the B3 progenitor was practically free of lithium. It should be noted, however, that the mass of the radiative envelope, where temperatures are lower than the 2.5 MK necessary for Li survival, is very small. In a model retrieved from MESA-Web3 (Paxton et al. 2019) for an 8 M⊙ star with an age of 16 Myr, we find that only 0.03 M⊙ or 3.75%, of the total mass of the star would be able to contain its original lithium content in the (unlikely) absence of mixing mechanisms. A collision with a dense companion should potentially disturb this outer layer and mix it with the Li-poor plasma below it.
Although we cannot entirely exclude the possibility that some of the lithium observed in V838 Mon originates from the progenitor primary or secondary, we find it more likely that both stars were already devoid of lithium at the time of the collision. Below, we explore the possibility that lithium enhancement may be directly related to the merger event and the internal structure of the coalesced star.
3.1.3 Internal lithium enrichment
Our internal production scenario is motivated by the similarity of the post-outburst remnant of V838 Mon to stars on the asymptotic giant branch (AGB; Soker & Tylenda 2007) and to red supergiants (Chesneau et al. 2014). The coalesced star mimics a red giant or a red supergiant well in the sense that it has a large luminosity of 104 L⊙, huge dimensions (with a 460 R⊙ radius; Kamiński et al. 2021b; Chesneau et al. 2014), and a convective envelope that puts it close to the Hayashi limit on the Hertzsprung-Russell diagram. Lithium, or more specifically 7Li, can be produced in some RGB and AGB stars through fast mixing via the Cameron-Fowler mechanism (Cameron 1955; Cameron & Fowler 1971; Sackmann & Boothroyd 1992). In this process, 7Be is produced in the second proton-proton chain (pp II), via 3He(α, γ)7Be, in deep internal layers of the star. In the complete pp II cycle, beryllium is next transformed into 7Li, which, in turn, is quickly destroyed in a reaction with a proton, 7Be(e−, ν)7Li(p, α)4He. However, fast mixing is thought to effectively transfer the freshly produced7 Be to the outer, cooler layers. There it decays into 7Li in conditions in which lithium is not entirely destroyed and can be dredged up to the surface. Convection seems to be the major mixing mechanism explaining surface 7Li abundances in some AGB stars (including hot bottom burning), while in RGB stars an extra mixing mechanism is necessary, be it termohaline mixing, magnetohydrodynamic instabilities, or rapid rotation, to mention just a few of the proposed mixing mechanisms (Charbonnel et al. 2010; Magrini et al. 2021). The currently measured lithium abundance in V838 Mon, 2.3, is very close to the average values of 2.3 and 2.6 measured in RGB and AGB giants (Maciel & Costa 2012). We propose that the 2002 event turned the main-sequence 8 M⊙ star into a giant or supergiant star with a fully convective envelope that can reach deep enough to dredge up 7Be and produce 7Li in the photosphere. This way, V838 Mon would be a more extreme case of a scenario considered by Denissenkov & Weiss (2000) in which a planet or brown-dwarf engulfment can activate the Cameron-Fowler mechanism; in the case of V838 Mon, a much heavier body was accreted, making this process even more effective. However, detailed merger simulations need to be performed to verify the validity of our proposal.
Our proposal certainly has some shortcomings. Given that high lithium abundances were already observed in V838 Mon during the 2002 outburst, the hypothesized 7Li production mechanism must have been active very early on. It is thus tempting to assign Li production to the common-envelope phase that directly preceded the coalescence. Whether the presence of lithium is related to V838 Mon being a merger in addition to being a common event is an open question that requires dedicated modeling.
Alternatively, the rotation of the remnant may provide the extra mixing that can support the Cameron-Fowler mechanism. Some stellar merger models predict that the collision product contains a lot of angular momentum and thus is rapidly rotating (e.g., Schneider et al. 2019). There is, as of now, no direct indication of a fast rotation for V838 Mon. Using the available optical spectra, we find only an upper limit of υ sin i < 28 km s−1. Moreover, since such a star is also supposed to spin down with time, extra mixing is even more likely but perhaps operates on much longer timescales than the 20 yr lifespan of the V838 Mon remnant.
The proposed scenarios in this and previous sections result in lithium abundances with different 7Li/6Li isotopic ratios. While the external enhancement should result in the cosmic 7Li/6Li ratio of about 7, the internal production of lithium should considerably increase the content of the 7Li isotope only. Unfortunately, deriving the lithium isotopic ratio is very difficult even for sharp interstellar lines, and it is hopelessly hard, if not impossible, for the wind features in V838 Mon. An internal production of lithium would also mean anomalous abundances of Be and B, but lines of those species, located in the ultraviolet, are barely observable in the remnant.
3.2 Li-bearing molecules
With the premise that lithium may be very highly enhanced in the circumstellar medium of V838 Mon, we investigated whether there may be an enhanced presence of Li-bearing molecules in the remnant. A detection of such molecules would be instrumental in determining the dominant isotope of lithium. Overall, observations of Li-bearing species in astronomical environments are very rare (Muller et al. 2020). We considered two species, LiOH and LiC1, which are thought to be among the main Li-bearing species that are easily accessible for millimeter-wave spectroscopy through their pure rotational transitions. We used the GGchem code (Woitke et al. 2018) to investigate molecular abundances in gas at different temperatures and pressures, assuming that the gas was in thermochemical equilibrium. This assumption is questionable for the circumstellar gas of the red nova remnant, but we only used the calculation as a first guideline. We find that, even if lithium abundance were extremely high, with A(Li) = 3–5, the Li-bearing molecules would have low absolute abundances and would produce lines that are not easily detectable with modern submillimeter interferometers such as the Atacama Large Millimeter/submillimeter Array (ALMA). In particular, LiOH emission should be 1–3 orders of magnitude weaker than that AlOH lines detected in V838 Mon at a modest S/N (Kamiński et al. 2021b).
4 Lithium in the CK Vul outflow
4.1 Observations
The photosphere of the stellar remnant of Nova 1670 is not observable, as it is deeply embedded in circumstellar dust. The presumed merger product is surrounded by a dusty bipolar nebula, which contains cool molecular gas as well as shock-excited atomic and H2 matter (Kamiński et al. 2020). Hajduk et al. (2013) noticed two variable stars toward the southern lobe of the nebula. Their variability can only be explained if they are far background stars affected by changing extinction originating from the expanding outflow of CK Vul. In an optical spectrum of the brighter of the variable stars, Hajduk et al. found a strong lithium feature near 6707 Å. Here we take a closer look at this feature, aiming to constrain the abundance and origin of lithium in the circumstellar medium of CK Vul.
We used a spectrum of Hajduk et al. (2013) obtained with the Gemini Multiobject Spectrograph (GMOS) in 2010 to constrain the parameters of the background star. We assumed that the spectrum is correctly calibrated in fluxes, and we made no extra corrections for chromatic slit losses or effects caused by the atmospheric chromatic aberration. Using a grid of synthetic AMBRE spectra (de Laverny et al. 2012), we find that the spectrum is best approximated by a photosphere with an effective temperature of 4750 ± 250 K (spectral type ~K3) and a reddening (interstellar plus circumstellar) of AV = 6.0 mag. Results of the best-fit search are shown in Fig. A.2. We used the standard interstellar extinction curve (Cardelli et al. 1989) with a selective extinction parameter of RV = 3.1. Since no uncontaminated photospheric features are present, the luminosity class of the photosphere remains unconstrained. The effective temperature is well constrained. Cooler stars would produce a conspicuous MgH band near 5200 Å, which is not present, and hotter stars would be betrayed by a Hα line that would be much stronger than the observed one. The derived temperature is close to that of the spectral type K4 (Teff ≈ 4500 K) assigned to the star by Hajduk et al. However, the V-band reddening of 6.0 mag we derived is significantly higher than the 4.4 mag postulated earlier.
Hajduk et al. measured the R magnitude of the background star to be lower than 19 mag in 2010. Adopting a spectral type K3 and assuming the star is on the main sequence, we would expect a (V – R) of 0.8 mag and thus a de-reddened V magnitude of 18.6. Assuming now an absolute magnitude of 6.9 mag for a K3 V star, we obtain a distance of 2.2 kpc. Gaia parallax measurements of the background star (0.0660±0.1858 mas; Lindegren et al. 2021) imply a 3σ lower limit of 2.6 kpc for the distance, so a luminosity class V can still be reconciled with the Gaia limits. However, higher luminosity classes, such as giants, are more likely because the distance to CK Vul is much larger than 3 kpc (Kamiński et al. 2021a; Banerjee et al. 2020). Since only a small fraction, 1–2%, of field giants have strong lithium features in their spectra (e.g., Smiljanic et al. 2018), it is very unlikely that we observe one here.
There are no clear photospheric features in the spectrum of the background star, but Na I and Hα seem to have a photospheric component that partially blends with interstellar and outflow absorption components. We tentatively assigned the photosphere a heliocentric velocity of ≈−250±50 km s−1. This is a much more negative velocity than the dominant interstellar and circumstellar components (cf. Fig. 2).
The spectrum contains pure interstellar features. The strongest diffuse interstellar band (DIB) we identified is the one near 5780.59 Å. There is also possibly a DIB at 6613.56 Å.
The lithium line λ6707 is free of any contamination – the closest features known in this source from other observations are the λ6716 line of the [S II] doublet and the λ6678 of He I, which, fortunately, do not overlap with the Li line. In the absence of other photospheric lines, the line of lithium is very unlikely to be contaminated by absorption intrinsic to the field star, even if it happened to be a Li-rich giant. The Ca I line, when observed at the modest resolution of the GMOS spectra, is partially contaminated by a Hα feature, which itself combines photospheric absorption and absorption from the CK Vul lobe (at different velocities; weak emission may also be present). Despite this complication, and as shown in Fig. 2, the velocity profiles of the Li I and Ca I lines overlap closely in velocity. This suggests that they are formed in the same region with a central heliocentric radial velocity of about −110 km s−1 and that the lines can be directly compared. Their radial velocity is certainly different from that of the interstellar gas probed by DIBs, which we measure to be centered near 40 km s−1. They also overlap with the velocity range −180 to 0 km s−1 occupied by the undoubtedly circumstellar CO J = 1–0 emission observed by ALMA along the same line of sight (Kamiński et al. 2020). The lithium and calcium lines are thus circumstellar.
The equivalent widths of WLiI = 1.3 and WCaI = 0.6 Å (both ±0.1 Å) yield log(NLiI/NCaI) = −3.8 (±0.1). In a standard solar composition, this implies a lithium abundance of A(Li) = 2.5. This lithium abundance is 1.4 dex higher than in the Sun, but still well below the meteoritic value.
4.2 Interpretation of Li in CK Vul
Formation of Li in CK Vul may be different from that in V838 Mon. There is a large body of evidence that CK Vul’s circumstellar material has been heavily processed by nucleosynthesis processes associated with the progenitor and the merger event. Observations of optical atomic lines of the inner nebular remnant indicate a highly processed elemental composition. First and foremost, helium is approximately twice more abundant relative to hydrogen than in the solar photosphere, and the N/O ratio is nearly ten times higher than in the Sun (Tylenda et al. 2019). Millimeter-wave observations of the cool molecular gas of the CK Vul remnant also suggest a general overabundance of nitrogen (Kamiński et al. 2015b). They additionally yield numerous isotopic ratios, for instance 12C/13C≈3.8, 14N/15N≈20, and 16O/18O≈36 (Kamiński et al. 2017), which together are very unusual. The chemical characteristics can be coherently explained by processing in the CNO hydrogen-burning cycles and by incomplete helium burning. Moreover, based on an unprecedented detection of an A1F isotopologue containing 26Al, which implies 27Al/26Al≈7, it was postulated that the progenitor system included an RGB star (Kamiński et al. 2018b). Currently, the most likely scenario is a merger of an RGB star with a He white dwarf (WD; Tylenda & Kamiński 2022).
The abundance of Li in CK Vul is close to those observed in other Li-enriched objects, including RGB and AGB giants (J-type stars among them), classical novae, and R CrB (RCB) stars. Especially relevant for the discussion here is the similarity to RCB stars and J-type carbon stars, which are thought to be products of mergers between either CO and He WDs (RCB stars) or He WDs and red giants (J stars). The merger of CK Vul was certainly different from that postulated for RCB stars, chiefly due to the presence of a hydrogen envelope, but models of RCB stars still offer an informative analogy. In nucleosynthesis models of merging WDs,7Li is produced in 3He(α, γ)7Be(e−, ν)7Li, as in the Cameron-Fowler mechanism. White dwarf mergers are thought to effectively produce 7Be – and thus 7Li – only if 3He is abundantly available from earlier processing or directly from the matter of the He WD. The Li-rich region is also expected to be mainly located in the outer layers of the merger product (Longland et al. 2012), which provides a chance of identifying the species in stellar spectra.
Models of mergers leading to the formation of J-type (and early R-type) carbon stars – that is, models that involve a collision between a WD and a red giant – are even closer analogs of CK Vul (Tylenda & Kamiński 2022). They produce lithium provided that large quantities of 3He are mixed down to the He-burning layer and that freshly produced lithium has a way to escape to the outer layers of the coalesced star (Zhang & Jeffery 2013; Zhang et al. 2020). In those models, lithium abundances steeply increase over the first ~1000 yr after the merger and can reach super-meteoritic values. The lithium abundance of 2.5 dex in CK Vul’s outflow observed some 350 yr after the merger can be reconciled with these models, but more studies on the kinematic age of the Li-bearing outflow are necessary to assure this, as there is a chance that the outflow is younger than 350 yr (Kamiński et al. 2021a). As mentioned, observations of CK Vul indicate an abundance of He that amounts to over half the mass of the optical nebula. There was therefore enough raw material to produce Li in the 3He(α, ν)7Li process. We consider models of Zhang et al. as the most adequate to explain lithium in the outflow of CK Vul.
Although classical novae are known sources of Li (e.g., Izzo et al. 2022, and references therein) and Nova 1670 had been identified as a classical nova, today there is a large body of evidence that Nova 1670 was not in fact a classical nova (e.g., Kamiński et al. 2017, 2018b, 2022). We therefore do not consider nova nucleosynthesis as a viable origin of lithium in the outflow of CK Vul and other red novae.
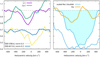 |
Fig. 2 Profiles of absorption lines toward the star located behind the southern lobe of the CK Vul outflow. The left panel shows circumstellar absorption of Li I and Ca I in the circumstellar gas (upper lines) and interstellar features (lines shifted down by 0.3). Note the different central velocities of the two groups. The right panel shows features of the Na I doublet and Hα that combine circumstellar, interstellar, and photospheric absorption. The filled cyan area shows absorption common for both lines of the blending Na I doublet and approximates the shape of the intrinsic Na I absorption. |
5 Lithium in the emission spectrum of V1309 Sco
V1309 Sco is an important member of the red nova group, as it is the only object with well-documented photometric variability prior to the merger in 2008 (Tylenda et al. 2011a). Located in a dense field, it is a challenging source for optical observations. After around 2010, its spectral evolution could be traced mainly through emission lines with no direct observations of the stellar continuum (Kamiński et al. 2015a, 2018a).
Lithium features have not been reported in the spectra of V1309 Sco before this work. We found the λ6707 feature in emission in an X-shooter spectrum from May–July 2016. The spectrum was reported by Kamiński et al. (2018a). Parts of the spectrum covering the lithium and calcium lines of interest are shown in Fig. 3. The Ca I line is very close to Hα, with both lines having nearly equal strengths, but the Ca I line is relatively free of contamination by Hα. The Li I line partially overlaps with a broad blend composed of the TiO γ 1–0 band and a line of [S II] (at a rest wavelength of 6716.44 Å). As shown in Fig. 4, the lithium and calcium lines have almost the same profiles, but the exact appearance relies on an arbitrary definition of the local baselines. The measured line fluxes of FCaI = 33.2±0.7 and FLiI = 4.8±0.4 10−16 erg s−1 cm−2 yield a calcium-to-lithium flux ratio of 6.9±0.6, but uncertainty in this value is larger than indicated owing to uncertain baseline levels for both lines.
The spectrum of the V1309 Sco remnant is dominated by emission lines formed through resonant (Rayleigh) scattering (Chandrasekhar 1960), whereby absorption of a stellar photon from the ground state is followed by emission to the ground. The emission is thus coupled to the incident light of the star. This kind of spectrum was well studied in V4332 Sgr, a spectroscopic twin of V1309 Sco (Kamiński & Tylenda 2013; Tylenda et al. 2015). Assuming that the lines of Li I and Ca I are formed in the same volume of gas, the number density ratio of both species can be calculated as

Here, F and F* represent the integrated line fluxes and the incident starlight fluxes at the wavelengths of the lines. Since the photospheric spectrum of V1309 Sco was not observed directly (being attenuated by circumstellar dust since before 2012; see Kamiński et al. 2015a), the ratio of the intrinsic stellar fluxes is unknown. Nevertheless, due to the many analogies between V1309 Sco and V4332 Sgr, we can assume that the stellar spectrum is close to that of a giant with an effective temperature of 3200 K, as determined for V4332 Sgr in Kamiński et al. (2010). Synthetic spectra of giants at this temperature (Gustafsson et al. 2008) show a flux ratio  . However, the incident spectrum that is scattered by the Ca I and Li I lines is already affected by the circumstellar absorption of TiO, which greatly increases the ratio. For instance, in the spectrum of V838 Mon observed in 2005, this ratio is about 4.5 (Kamiński et al. 2009, their Fig. 3). We therefore adopted a value of 3.0±1.5 for V1309 Sco.
Although the calcium line is a semi-forbidden transition, it can have a significantly higher optical depth than the seven-times-weaker line of lithium. Because we do not have a reliable constraint on the size of the emission region, calculating line opacities solely from the observed fluxes is not possible, and thus we ignored the saturation effects, that is, we took τCaI = τLiI = 0.
We obtain the density ratio nLiI/nCaI = 2.8(±1.7)×10−5 and the absolute abundance A(Li) = 1.8(±0.3). The lithium abundance is a few times higher than in the Sun (A⊙(Li) = 1.1), but is also a few times lower than in the two other red nova remnants analyzed here.
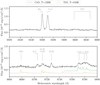 |
Fig. 3 Spectra of V1309 Sco from 2016 near the lithium and calcium resonance lines. Neighboring features are identified. To better illustrate the contribution of TiO and CrO emission, simple simulations of their emission are shown in orange and green, respectively. The simulations were performed as in Kamiński et al. (2015a). Spectra were de-reddened but were not corrected for the spectroscopic baseline (which is not the true continuum of V1309 Sco). |
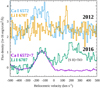 |
Fig. 4 Profiles of the Ca I and Li I resonance lines in X-shooter observations of V1309 Sco from 2012 (upper lines) and 2016 (lower lines). The Ca I flux in 2016 was divided by 7. In 2016, at velocities higher than about 0 km s−1, the Li I line partially overlaps with a blend of TiO and [S II]. |
5.1 Early appearance of Li features?
Lines of both species are centered at −130 (±10) km s−1 and occupy a velocity range typical for most other neutral resonance lines in the late 2016 spectrum of V1309 Sco, for example the K I doublet (cf. Kamiński et al. 2015a, 2018a). This velocity is also close to our best constraints on the systemic heliocentric velocity of the object, that is, −110 or −120 km s−1 (Kamiński et al. 2018a; Mason & Shore 2022). As shown in Fig. 4, the calcium line was also present in a spectrum obtained in 2012 and reported in Kamiński et al. (2015a). However, the lithium line was not detected in 2012, most likely due to a poorer signal-to-noise ratio. The non-detection is consistent with the line ratio that we measured for the 2016 features.
Even earlier spectra, such as those from 2009 presented by Kamiński et al. (2015a), do not show any feature near 6707 Å. We also analyzed Ultraviolet and Visual Echelle Spectrograph (UVES) spectra from Mason et al. (2010) taken during the outburst of V1309 Sco, that is, in September–October 2008, but do not find any features at velocities near −130 km s−1 that could be assigned to the Ca I and Li I resonance lines. However, multiple spectra in this data set show broad absorption features centered at ≈−105 km s−1 that can be assigned to Ca I and may have a very faint corresponding feature of lithium. We find these lines in spectra from 18, 20, and 28 September 2008 and 8 and 20 October 2008 – but not in spectra from early September 2008. Sample spectra are shown in Fig. 5. The relatively low expansion velocity of the calcium-bearing gas places it within the “low-velocity component” of Mason & Shore (2022), which – according to these authors – originates in material lost from the V1309 Sco system before the red nova outburst and which was excited in 2008–2009 by the radiation of the outburst. If the weak features that we have identified indeed belong to Li I, the enrichment in lithium may even precede the 2008 eruption of V1309 Sco, possibly when the progenitor system of subgiants (Stȩpień 2011) was losing mass. Some solar-mass subgiants are known to have super-solar lithium abundances (Randich et al. 1999), and thus the progenitors could have been a direct source of the lithium reservoir. However, the spectra from the 2008–2009 outburst phase are very complex, and it is difficult to make unambiguous identifications of the observed features. While it is certain that the remnant displayed a modest lithium enrichment in circumstellar gas in 2016, it is uncertain for dates earlier than 2016.
5.2 Origin of lithium in V1309 Sco
Identifying the source of Li in V1309 Sco is currently not possible, as too little is known about the remnant and its progenitor system. We find it most tempting to speculate that lithium production is directly related to mixing mechanisms that occurred prior to or during a merger or to the internal structure of the coalesced star. Being currently a bloated star with a convective envelope, the stellar remnant of V1309 Sco is similar to V838 Mon, although with a much lower mass. Detailed modeling is necessary to investigate whether the newly created star can develop convection and mixing that could activate the Cameron-Fowler mechanism.
5.3 V4332 Sgr
V4332 Sgr is a close analog of V1309 Sco (Kamiński et al. 2015a, 2018a). Its outburst was observed in 1994, that is, 12 yr before that of V1309 Sco. No lithium feature has ever been reported in the spectra of V4332 Sgr. Spectra obtained during and soon after the 1994 eruption (Martini et al. 1999; Kimeswenger 2006; Banerjee et al. 2015; Tylenda et al. 2005a) do not show any conspicuous features that could be assigned to Li I λ6707. However, most of these spectra have very modest spectral resolutions (<10 000) and signal-to-noise ratios, and thus we cannot definitively claim that lithium is absent. Because V4332 Sgr is an oxygen-rich object, its strong photospheric and circumstellar bands of TiO γ 1–0 hamper any meaningful tests for the presence of Li I λ6707 in the poor quality spectra. Also, there was a gap of 8 yr between the earliest spectra obtained in 1994 by Martini et al. (1999) and the next one, from August 2002 (Kimeswenger 2005). The best-quality spectrum of the V4332 Sgr remnant was obtained with UVES in 2005 (Tylenda et al. 2015), and it does not show any Li features. If the Li I line was a temporal feature in V4332 Sgr, it could have been missed.
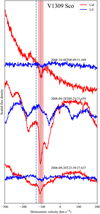 |
Fig. 5 Sample spectra near the Li I and Ca I resonance lines, as observed by UVES in 2009, in V1309 Sco (Mason et al. 2010). The observing epochs are indicated as UT times for each pair. Spectra were not normalized and, for each pair, are to scale. The area highlighted in pink is where the strongest Ca I absorption is observed and where Li I may have a weaker corresponding feature. The vertical dotted line marks the central velocity of this component. The dashed line marks the peak position of the Li I and Ca I emission lines in the 2016 spectrum. |
6 Conclusions
A high abundance of lithium is observed in all three well-observed red nova remnants, V838 Mon, V1309 Sco, and CK Vul. The origin of the observed lithium is, however, not clear and, as discussed, may have different origins in different objects. In V838 Mon, it is most tempting to link the lithium to a development of a deep mixing layer in a convective supergiant that led to the activation of the Cameron-Fowler mechanism. However, other extrinsic sources of lithium in the V838 Mon remnant cannot be entirely excluded at this time. In CK Vul, the Li production mechanism may be similar to that modeled for the formation of R stars and involve mixing analogous to that of the Cameron-Fowler mechanism. Because in some objects there are hints of Li overabundance during the outburst (V838 Mon) and possibly even before it (V1309 Sco), some convective configuration prior to the merger may be involved. Since common-envelope evolution appears to be a common feature in all three objects investigated here, deep convection in that phase is one possible scenario that would explain lithium in red novae. With this observational analysis, we would like to encourage theoretical studies of lithium production through the activation of mixing mechanisms in common-envelope systems, merger events, and merger remnants. Certainly, more observations of red nova remnants are necessary to better recognize the link between lithium and stellar mergers. An observation of a red nova or a red nova remnant with readily super-meteoritic Li abundances would be a strong and more direct confirmation of internal Li production, but it is uncertain whether any short-lived mixing mechanism can compete with cosmic-ray spallation reactions operating on much longer timescales.
The curious presence of lithium in red novae and their remnants is not the only link between lithium production and common-envelope evolution or stellar mergers. Lithium enhancements are often found in non-binary giants with a history of enhanced mass loss and with rapid rotation, including small subsets of RGB stars (e.g., de La Reza et al. 1996) and AGB stars (e.g., Reyniers & Van Winckel 2001). A link of some of them to red novae was recently discussed by Melis (2020). It also appears that mergers are the only sensible way to explain J-type and early R-type carbon stars rich in lithium (Izzard et al. 2007; Zhang et al. 2020). Finally, the resonance line of lithium was observed in extragalactic gap transients, including an intermediate-luminosity red transient, AT 2019abn (Williams et al. 2020), and possibly a luminous red nova, AT 2017jfs (Pastorello et al. 2019a, and priv. comm.), which may be powered by mergers as well. Lithium appears to be an important element for understanding a wide range of systems suspected of common-envelope evolution or mergers.
This study identifies red novae and their remnants as potential lithium producers. However, given their rarity, now estimated to be two bright outbursts per decade (Kochanek et al. 2014), they are unlikely to be key players in the Milky Way lithium budget.
The derivation of circumstellar lithium abundances is difficult in red nova remnants. The potential depletion of calcium into dust makes our estimates of A(Li) upper limits, and further studies of dust formation in these objects may reduce the uncertainties. Radiative transfer modeling of the spectra of these objects in different phases is underway to better address line opacity effects.
Acknowledgements
We are grateful to Th. Rauch for kindly sending us spectra from the early outburst of V838 Mon; P. Martini for providing us with spectra of V4332 Sgr; A. Pastorello for sharing the spectra of AT 2017jfs; and Y. Cai for sharing data on AT 2021biy. We thank R. Tylenda for comments on the manuscript and Y. Pavlenko for attempts in modeling the high-excitation lines of lithium in V838 Mon. T.K. and I.I. acknowledge funding from grant SONATA BIS no 2018/30/E/ST9/00398 from the Polish National Science Center. Based on observations collected at the European Organization for Astronomical Research in the Southern Hemisphere under ESO programs 382.D-0152, 088.D-0112, 60.A-9445, 089.D-0041, 097.D-0092, and 281.D-5055. This research is based in part on data collected at the Subaru Telescope, which is operated by the National Astronomical Observatory of Japan. We are honored and grateful for the opportunity of observing the Universe from Maunakea, which has the cultural, historical, and natural significance in Hawaii. Some data presented herein were obtained at the W. M. Keck Observatory, which is operated as a scientific partnership among the California Institute of Technology, the University of California and the National Aeronautics and Space Administration. The Observatory was made possible by the generous financial support of the W. M. Keck Foundation. The authors wish to recognize and acknowledge the very significant cultural role and reverence that the summit of Maunakea has always had within the indigenous Hawaiian community. We are most fortunate to have the opportunity to conduct observations from this mountain. Some observations reported in this paper were obtained with the Southern African Large Telescope (SALT). Polish participation in SALT is funded by grant no. MNiSW DIR/WK/2016/07. Based on observations obtained at the international Gemini Observatory, a program of NSF’s NOIRLab, which is managed by the Association of Universities for Research in Astronomy (AURA) under a cooperative agreement with the National Science Foundation on behalf of the Gemini Observatory partnership: the National Science Foundation (United States), National Research Council (Canada), Agencia Nacional de Investigación y Desarrollo (Chile), Ministerio de Ciencia, Tecnología e Innovación (Argentina), Ministério da Ciência, Tecnologia, Inovações e Comunicações (Brazil), and Korea Astronomy and Space Science Institute (Republic of Korea).
Appendix A Spectral fits
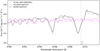 |
Fig. A.1 Sample correction of the spectrum near lithium lines via a simulation of TiO bands. The observed spectrum (gray) was obtained with the Southern African Large Telescope (SALT) in 2020. The simulation (magenta) included TiO opacity of a cool (800 K) slab of circumstellar gas. Aside from Li I absorption components, most of the spectral features are TiO rotational lines in the P2 (Jlow=24–27) and Q2 (Jlow=36–40) branches. Weak absorption from a couple of Fe I lines may be present as well. |
 |
Fig. A.2 Best-fit synthetic spectrum (orange) attempting to reproduce the observed spectrum (blue) of the field star observed behind the outflow of CK Vul. The model spectrum was reddened by AV=6 mag. The main features are identified. |
References
- Afşar, M., & Bond, H. E. 2007, AJ, 133, 387 [Google Scholar]
- Andersen, B. C., Stephens, I. W., Dunham, M. M., et al. 2019, ApJ, 873, 54 [Google Scholar]
- Banerjee, D. P. K., Nuth, I., Joseph, A., Misselt, K. A., et al. 2015, ApJ, 814, 109 [NASA ADS] [CrossRef] [Google Scholar]
- Banerjee, D. P. K., Geballe, T. R., Evans, A., et al. 2020, ApJ, 904, L23 [NASA ADS] [CrossRef] [Google Scholar]
- Bildsten, L., Brown, E. F., Matzner, C. D., & Ushomirsky, G. 1997, ApJ, 482, 442 [NASA ADS] [CrossRef] [Google Scholar]
- Blagorodnova, N., Kotak, R., Polshaw, J., et al. 2017, ApJ, 834, 107 [NASA ADS] [CrossRef] [Google Scholar]
- Blagorodnova, N., Karambelkar, V., Adams, S. M., et al. 2020, MNRAS, 496, 5503 [CrossRef] [Google Scholar]
- Blagorodnova, N., Klencki, J., Pejcha, O., et al. 2021, A&A, 653, A134 [NASA ADS] [CrossRef] [EDP Sciences] [Google Scholar]
- Bond, H. E., & Siegel, M. H. 2006, AJ, 131, 984 [NASA ADS] [CrossRef] [Google Scholar]
- Brott, I., de Mink, S. E., Cantiello, M., et al. 2011, A&A, 530, A115 [NASA ADS] [CrossRef] [EDP Sciences] [Google Scholar]
- Cai, Y. Z., Pastorello, A., Fraser, M., et al. 2019, A&A, 632, A6 [NASA ADS] [CrossRef] [EDP Sciences] [Google Scholar]
- Cai, Y. Z., Pastorello, A., Fraser, M., et al. 2022, A&A, 667, A4 [Google Scholar]
- Cameron, A. G. W. 1955, ApJ, 121, 144 [NASA ADS] [CrossRef] [Google Scholar]
- Cameron, A. G. W., & Fowler, W. A. 1971, ApJ, 164, 111 [NASA ADS] [CrossRef] [Google Scholar]
- Cardelli, J. A., Clayton, G. C., & Mathis, J. S. 1989, ApJ, 345, 245 [Google Scholar]
- Chabrier, G., Baraffe, I., & Plez, B. 1996, ApJ, 459, L91 [NASA ADS] [CrossRef] [Google Scholar]
- Chandrasekhar, S. 1960, Radiative transfer (New York: Dover) [Google Scholar]
- Charbonnel, C., Tosi, M., Primas, F., & Chiappini, C. 2010, Light Elements in the Universe (IAU S268) (Cambridge University Press) [Google Scholar]
- Chesneau, O., Millour, F., De Marco, O., et al. 2014, A&A, 569, A3 [NASA ADS] [CrossRef] [EDP Sciences] [Google Scholar]
- de La Reza, R., Drake, N. A., & da Silva, L. 1996, ApJ, 456, L115 [NASA ADS] [CrossRef] [Google Scholar]
- de Laverny, P., Recio-Blanco, A., Worley, C. C., & Plez, B. 2012, A&A, 544, A126 [NASA ADS] [CrossRef] [EDP Sciences] [Google Scholar]
- Deguchi, S., Matsunaga, N., & Fukushi, H. 2005, PASJ, 57, L25 [NASA ADS] [Google Scholar]
- Della Valle, M., & Izzo, L. 2020, A&ARv, 28, 3 [NASA ADS] [CrossRef] [Google Scholar]
- Denissenkov, P. A., & Weiss, A. 2000, A&A, 358, A49 [NASA ADS] [Google Scholar]
- Field, G. B. 1974, ApJ, 187, 453 [NASA ADS] [CrossRef] [Google Scholar]
- Grevesse, N., & Sauval, A. J. 1998, Space Sci. Rev., 85, 161 [Google Scholar]
- Gustafsson, B., Edvardsson, B., Eriksson, K., et al. 2008, A&A, 486, 951 [NASA ADS] [CrossRef] [EDP Sciences] [Google Scholar]
- Hajduk, M., van Hoof, P. A. M., & Zijlstra, A. A. 2013, MNRAS, 432, 167 [NASA ADS] [CrossRef] [Google Scholar]
- Heger, A., & Langer, N. 2000, ApJ, 544, 1016 [CrossRef] [Google Scholar]
- Heger, A., Langer, N., & Woosley, S. E. 2000, ApJ, 528, 368 [NASA ADS] [CrossRef] [Google Scholar]
- Hevelius, J. 1671, Philos. Trans. Roy. Soc. Lond. Ser. I, 6, 2197 [Google Scholar]
- Hoadley, K., Martin, D. C., Metzger, B. D., et al. 2020, Nature, 587, 387 [NASA ADS] [CrossRef] [Google Scholar]
- Howitt, G., Stevenson, S., Vigna-Gómez, A., et al. 2020, MNRAS, 492, 3229 [CrossRef] [Google Scholar]
- Iaconi, R., De Marco, O., Passy, J.-C., & Staff, J. 2018, MNRAS, 477, 2349 [NASA ADS] [CrossRef] [Google Scholar]
- Iaconi, R., Maeda, K., De Marco, O., Nozawa, T., & Reichardt, T. 2019, MNRAS, 489, 3334 [NASA ADS] [CrossRef] [Google Scholar]
- Ivanova, N., Justham, S., Chen, X., et al. 2013, A&ARv, 21, 59 [Google Scholar]
- Izzard, R. G., Jeffery, C. S., & Lattanzio, J. 2007, A&A, 470, 661 [NASA ADS] [CrossRef] [EDP Sciences] [Google Scholar]
- Izzo, L., Molaro, P., Cescutti, G., et al. 2022, MNRAS, 510, 5302 [CrossRef] [Google Scholar]
- Jeffries, R. D., Jackson, R. J., Franciosini, E., et al. 2017, MNRAS, 464, 1456 [Google Scholar]
- Kamiński, T., & Tylenda, R. 2013, A&A, 558, A82 [NASA ADS] [CrossRef] [EDP Sciences] [Google Scholar]
- Kamiński, T., Schmidt, M., Tylenda, R., Konacki, M., & Gromadzki, M. 2009, ApJS, 182, 33 [Google Scholar]
- Kamiński, T., Schmidt, M., & Tylenda, R. 2010, A&A, 522, A75 [NASA ADS] [CrossRef] [EDP Sciences] [Google Scholar]
- Kamiński, T., Tylenda, R., & Deguchi, S. 2011, A&A, 529, A48 [NASA ADS] [CrossRef] [EDP Sciences] [Google Scholar]
- Kamiński, T., Mason, E., Tylenda, R., & Schmidt, M. R. 2015a, A&A, 580, A34 [NASA ADS] [CrossRef] [EDP Sciences] [Google Scholar]
- Kamiński, T., Menten, K. M., Tylenda, R., et al. 2015b, Nature, 520, 322 [CrossRef] [Google Scholar]
- Kamiński, T., Menten, K. M., Tylenda, R., et al. 2017, A&A, 607, A78 [NASA ADS] [CrossRef] [EDP Sciences] [Google Scholar]
- Kamiński, T., Steffen, W., Tylenda, R., et al. 2018a, A&A, 617, A129 [NASA ADS] [CrossRef] [EDP Sciences] [Google Scholar]
- Kamiński, T., Tylenda, R., Menten, K. M., et al. 2018b, Nat. Astron., 2, 778 [CrossRef] [Google Scholar]
- Kamiński, T., Menten, K. M., Tylenda, R., et al. 2020, A&A, 644, A59 [NASA ADS] [CrossRef] [EDP Sciences] [Google Scholar]
- Kamiński, T., Steffen, W., Bujarrabal, V., et al. 2021a, A&A, 646, A1 [NASA ADS] [CrossRef] [EDP Sciences] [Google Scholar]
- Kamiński, T., Tylenda, R., Kiljan, A., et al. 2021b, A&A, 655, A32 [NASA ADS] [CrossRef] [EDP Sciences] [Google Scholar]
- Kamiński, T., Mazurek, H. J., Menten, K. M., & Tylenda, R. 2022, A&A, 659, A109 [NASA ADS] [CrossRef] [EDP Sciences] [Google Scholar]
- Kaufer, A. 2010, in Light Elements in the Universe, eds. C. Charbonnel, M. Tosi, F. Primas, & C. Chiappini, 268, 317 [NASA ADS] [Google Scholar]
- Kimeswenger, S. 2005, Astron. Nachr., 326, 657 [NASA ADS] [Google Scholar]
- Kimeswenger, S. 2006, Astron. Nachr., 327, 44 [Google Scholar]
- Kipper, T., & Škoda, P. 2007, ASP Conf. Ser., 363, 231 [NASA ADS] [Google Scholar]
- Kipper, T., Klochkova, V. G., Annuk, K., et al. 2004, A&A, 416, 1107 [NASA ADS] [CrossRef] [EDP Sciences] [Google Scholar]
- Kochanek, C. S., Adams, S. M., & Belczynski, K. 2014, MNRAS, 443, 1319 [NASA ADS] [CrossRef] [Google Scholar]
- Kurtenkov, A. A., Pessev, P., Tomov, T., et al. 2015, A&A, 578, A10 [Google Scholar]
- Langer, N., Brott, I., Cantiello, M., et al. 2010, in Light Elements in the Universe, eds. C. Charbonnel, M. Tosi, F. Primas, & C. Chiappini, 268, 411 [NASA ADS] [Google Scholar]
- Lindegren, L., Klioner, S. A., Hernández, J., et al. 2021, A&A, 649, A2 [EDP Sciences] [Google Scholar]
- Longland, R., Lorén-Aguilar, P., José, J., García-Berro, E., & Althaus, L. G. 2012, A&A, 542, A117 [NASA ADS] [CrossRef] [EDP Sciences] [Google Scholar]
- Maciel, W. J., & Costa, R. D. D. 2012, Memorie della Societa Astron. Ital. Suppl., 22, 103 [Google Scholar]
- MacLeod, M., & Loeb, A. 2020, ApJ, 895, 29 [Google Scholar]
- MacLeod, M., Macias, P., Ramirez-Ruiz, E., et al. 2017, ApJ, 835, 282 [NASA ADS] [CrossRef] [Google Scholar]
- MacLeod, M., Ostriker, E. C., & Stone, J. M. 2018a, ApJ, 868, 136 [NASA ADS] [CrossRef] [Google Scholar]
- MacLeod, M., Ostriker, E. C., & Stone, J. M. 2018b, ApJ, 863, 5 [NASA ADS] [CrossRef] [Google Scholar]
- MacLeod, M., De, K., & Loeb, A. 2022, ASS J., submitted, [arXiv:2205.07929] [Google Scholar]
- Magrini, L., Smiljanic, R., Lagarde, N., et al. 2021, The Messenger, 185, 18 [NASA ADS] [Google Scholar]
- Martini, P., Wagner, R. M., Tomaney, A., et al. 1999, AJ, 118, 1034 [NASA ADS] [CrossRef] [Google Scholar]
- Mason, E., & Shore, S. N. 2022, A&A, 664, A12 [NASA ADS] [CrossRef] [EDP Sciences] [Google Scholar]
- Mason, E., Diaz, M., Williams, R. E., Preston, G., & Bensby, T. 2010, A&A, 516, A108 [CrossRef] [EDP Sciences] [Google Scholar]
- Mauron, N., & Huggins, P. J. 2010, A&A, 513, A31 [NASA ADS] [CrossRef] [EDP Sciences] [Google Scholar]
- Melis, C. 2020, Res. Notes AAS, 4, 238 [NASA ADS] [CrossRef] [Google Scholar]
- Mendel, J. T., Venn, K. A., Proffitt, C. R., Brooks, A. M., & Lambert, D. L. 2006, ApJ, 640, 1039 [NASA ADS] [CrossRef] [Google Scholar]
- Metzger, B. D., & Pejcha, O. 2017, MNRAS, 471, 3200 [NASA ADS] [CrossRef] [Google Scholar]
- Muller, S., Roueff, E., Black, J. H., et al. 2020, A&A, 637, A7 [EDP Sciences] [Google Scholar]
- Munari, U., Henden, A., Kiyota, S., et al. 2002, A&A, 389, A51 [Google Scholar]
- Nandez, J. L. A., Ivanova, N., & Lombardi, J. C., 2014, ApJ, 786, 39 [NASA ADS] [CrossRef] [Google Scholar]
- Ortiz-León, G. N., Menten, K. M., Kamiński, T., et al. 2020, A&A, 638, A17 [NASA ADS] [CrossRef] [EDP Sciences] [Google Scholar]
- Pastorello, A., Chen, T. W., Cai, Y. Z., et al. 2019a, A&A, 625, A8 [Google Scholar]
- Pastorello, A., Mason, E., Taubenberger, S., et al. 2019b, A&A, 630, A75 [NASA ADS] [CrossRef] [EDP Sciences] [Google Scholar]
- Pastorello, A., Fraser, M., Valerin, G., et al. 2021a, A&A, 646, A119 [EDP Sciences] [Google Scholar]
- Pastorello, A., Valerin, G., Fraser, M., et al. 2021b, A&A, 647, A93 [NASA ADS] [CrossRef] [EDP Sciences] [Google Scholar]
- Paxton, B., Smolec, R., Schwab, J., et al. 2019, ApJS, 243, 10 [Google Scholar]
- Pejcha, O. 2014, ApJ, 788, 22 [NASA ADS] [CrossRef] [Google Scholar]
- Pejcha, O., Metzger, B. D., & Tomida, K. 2016a, MNRAS, 461, 2527 [NASA ADS] [CrossRef] [Google Scholar]
- Pejcha, O., Metzger, B. D., & Tomida, K. 2016b, MNRAS, 455, 4351 [Google Scholar]
- Pejcha, O., Metzger, B. D., Tyles, J. G., & Tomida, K. 2017, ApJ, 850, 59 [NASA ADS] [CrossRef] [Google Scholar]
- Proffitt, C. R., Lennon, D. J., Langer, N., & Brott, I. 2016, ApJ, 824, 3 [NASA ADS] [CrossRef] [Google Scholar]
- Randich, S., Gratton, R., Pallavicini, R., Pasquini, L., & Carretta, E. 1999, A&A, 348, 487 [NASA ADS] [Google Scholar]
- Rau, A., Kulkarni, S. R., Ofek, E. O., & Yan, L. 2007, ApJ, 659, 1536 [NASA ADS] [CrossRef] [Google Scholar]
- Reichardt, T. A., De Marco, O., Iaconi, R., Tout, C. A., & Price, D. J. 2019, MNRAS, 484, 631 [NASA ADS] [CrossRef] [Google Scholar]
- Reyniers, M., & Van Winckel, H. 2001, A&A, 365, 465 [NASA ADS] [CrossRef] [EDP Sciences] [Google Scholar]
- Sackmann, I. J., & Boothroyd, A. I. 1992, ApJ, 392, L71 [NASA ADS] [CrossRef] [Google Scholar]
- Schneider, F. R. N., Ohlmann, S. T., Podsiadlowski, P., et al. 2019, Nature, 574, 211 [Google Scholar]
- Shara, M. M., Moffat, A. F. J., & Webbink, R. F. 1985, ApJ, 294, 271 [NASA ADS] [CrossRef] [Google Scholar]
- Sills, A., Faber, J. A., Lombardi, J., James, C., Rasio, F. A., & Warren, A. R. 2001, ApJ, 548, 323 [NASA ADS] [CrossRef] [Google Scholar]
- Smiljanic, R., Franciosini, E., Bragaglia, A., et al. 2018, A&A, 617, A4 [NASA ADS] [CrossRef] [EDP Sciences] [Google Scholar]
- Smith, N., Andrews, J. E., Van Dyk, S. D., et al. 2016, MNRAS, 458, 950 [Google Scholar]
- Soker, N. 2016, New A, 47, 16 [NASA ADS] [CrossRef] [Google Scholar]
- Soker, N. 2019, MNRAS, 483, 5020 [NASA ADS] [CrossRef] [Google Scholar]
- Soker, N. 2020a, ApJ, 893, 20 [Google Scholar]
- Soker, N. 2020b, Galaxies, 8, 26 [NASA ADS] [CrossRef] [Google Scholar]
- Soker, N. 2021, Res. Astron. Astrophys., 21, 112 [Google Scholar]
- Soker, N., & Kaplan, N. 2021, Res. Astron. Astrophys., 21, 090 [Google Scholar]
- Soker, N., & Kashi, A. 2012, ApJ, 746, 100 [NASA ADS] [CrossRef] [Google Scholar]
- Soker, N., & Tylenda, R. 2007, MNRAS, 375, 909 [CrossRef] [Google Scholar]
- Stȩpień, K. 2011, A&A, 531, A18 [NASA ADS] [CrossRef] [EDP Sciences] [Google Scholar]
- Tylenda, R., & Kamiński, T. 2012, A&A, 548, A23 [NASA ADS] [CrossRef] [EDP Sciences] [Google Scholar]
- Tylenda, R., & Kamiński, T. 2022, A&A, submitted [NASA ADS] [CrossRef] [EDP Sciences] [Google Scholar]
- Tylenda, R., & Soker, N. 2006, A&A, 451, 223 [NASA ADS] [CrossRef] [EDP Sciences] [Google Scholar]
- Tylenda, R., Crause, L. A., Górny, S. K., & Schmidt, M. R. 2005a, A&A, 439, 651 [NASA ADS] [CrossRef] [EDP Sciences] [Google Scholar]
- Tylenda, R., Soker, N., & Szczerba, R. 2005b, A&A, 441, 1099 [NASA ADS] [CrossRef] [EDP Sciences] [Google Scholar]
- Tylenda, R., Hajduk, M., Kamiński, T., et al. 2011a, A&A, 528, A114 [NASA ADS] [CrossRef] [EDP Sciences] [Google Scholar]
- Tylenda, R., Kamiński, T., Schmidt, M., Kurtev, R., & Tomov, T. 2011b, A&A, 532, A138 [NASA ADS] [CrossRef] [EDP Sciences] [Google Scholar]
- Tylenda, R., Kamiński, T., Udalski, A., et al. 2013, A&A, 555, A16 [NASA ADS] [CrossRef] [EDP Sciences] [Google Scholar]
- Tylenda, R., Górny, S. K., Kamiński, T., & Schmidt, M. 2015, A&A, 578, A75 [NASA ADS] [CrossRef] [EDP Sciences] [Google Scholar]
- Tylenda, R., Kamiński, T., & Mehner, A. 2019, A&A, 628, A124 [NASA ADS] [CrossRef] [EDP Sciences] [Google Scholar]
- Venn, K. A., Brooks, A. M., Lambert, D. L., et al. 2002, ApJ, 565, 571 [NASA ADS] [CrossRef] [Google Scholar]
- Wallerstein, G., & Conti, P. S. 1969, ARA&A, 7, 99 [Google Scholar]
- White, R. J., & Hillenbrand, L. A. 2005, ApJ, 621, L65 [Google Scholar]
- Whittet, D. C. B. 1992, Dust in the Galactic Environment (CRC Press) [CrossRef] [Google Scholar]
- Wiese, W., & Fuhr, J. 2009, J. Phys. Chem. Ref. Data, 38, 565 [NASA ADS] [CrossRef] [Google Scholar]
- Williams, S. C., Darnley, M. J., Bode, M. F., & Steele, I. A. 2015, ApJ, 805, L18 [Google Scholar]
- Williams, S. C., Jones, D., Pessev, P., et al. 2020, A&A, 637, A20 [NASA ADS] [CrossRef] [EDP Sciences] [Google Scholar]
- Woitke, P., Helling, C., Hunter, G. H., et al. 2018, A&A, 614, A1 [NASA ADS] [CrossRef] [EDP Sciences] [Google Scholar]
- Yee, J. C., & Jensen, E. L. N. 2010, ApJ, 711, 303 [NASA ADS] [CrossRef] [Google Scholar]
- Zhang, X., & Jeffery, C. S. 2013, MNRAS, 430, 2113 [NASA ADS] [CrossRef] [Google Scholar]
- Zhang, X., Jeffery, C. S., Li, Y., & Bi, S. 2020, ApJ, 889, 33 [NASA ADS] [CrossRef] [Google Scholar]
We currently include objects where at least one of the merging components is a main-sequence star or a giant or a subgiant but exclude mergers involving black holes, neutron stars, and double white dwarfs.
In both papers, the authors compared V838 Mon’s lithium abundance to the meteoritic Solar System abundance, not to the photospheric values, and incorrectly concluded that V838 Mon had a nearly solar lithium abundance.
All Tables
All Figures
|
Fig. 1 Profiles of the λ6572 line of Ca I and the λ6707 line of Li I in V838 Mon. Normalization of the spectra is uncertain, in particular for the Li I profile from 2005, which may display a profile with (dashed purple) or without (solid purple) emission (see text). The alternative profile normalization for the 2005 epoch shown with a dashed line was divided by 1.3 for better clarity. The Ca I profile is contaminated by two weak telluric features (light green), whose position and depth is different for all epochs but is close to the sample telluric spectrum, presented as the light green line. The dashed vertical line indicates the velocity of the SiO maser, which usually is indicative of the systemic velocity. The left panel shows changes in each profile over time, while the right panel compares profiles of both species for two sample epochs. Spectral regions highlighted in cyan and yellow were measured for relative line intensities (Table 2). |
| In the text | |
|
Fig. 2 Profiles of absorption lines toward the star located behind the southern lobe of the CK Vul outflow. The left panel shows circumstellar absorption of Li I and Ca I in the circumstellar gas (upper lines) and interstellar features (lines shifted down by 0.3). Note the different central velocities of the two groups. The right panel shows features of the Na I doublet and Hα that combine circumstellar, interstellar, and photospheric absorption. The filled cyan area shows absorption common for both lines of the blending Na I doublet and approximates the shape of the intrinsic Na I absorption. |
| In the text | |
|
Fig. 3 Spectra of V1309 Sco from 2016 near the lithium and calcium resonance lines. Neighboring features are identified. To better illustrate the contribution of TiO and CrO emission, simple simulations of their emission are shown in orange and green, respectively. The simulations were performed as in Kamiński et al. (2015a). Spectra were de-reddened but were not corrected for the spectroscopic baseline (which is not the true continuum of V1309 Sco). |
| In the text | |
|
Fig. 4 Profiles of the Ca I and Li I resonance lines in X-shooter observations of V1309 Sco from 2012 (upper lines) and 2016 (lower lines). The Ca I flux in 2016 was divided by 7. In 2016, at velocities higher than about 0 km s−1, the Li I line partially overlaps with a blend of TiO and [S II]. |
| In the text | |
|
Fig. 5 Sample spectra near the Li I and Ca I resonance lines, as observed by UVES in 2009, in V1309 Sco (Mason et al. 2010). The observing epochs are indicated as UT times for each pair. Spectra were not normalized and, for each pair, are to scale. The area highlighted in pink is where the strongest Ca I absorption is observed and where Li I may have a weaker corresponding feature. The vertical dotted line marks the central velocity of this component. The dashed line marks the peak position of the Li I and Ca I emission lines in the 2016 spectrum. |
| In the text | |
|
Fig. A.1 Sample correction of the spectrum near lithium lines via a simulation of TiO bands. The observed spectrum (gray) was obtained with the Southern African Large Telescope (SALT) in 2020. The simulation (magenta) included TiO opacity of a cool (800 K) slab of circumstellar gas. Aside from Li I absorption components, most of the spectral features are TiO rotational lines in the P2 (Jlow=24–27) and Q2 (Jlow=36–40) branches. Weak absorption from a couple of Fe I lines may be present as well. |
| In the text | |
|
Fig. A.2 Best-fit synthetic spectrum (orange) attempting to reproduce the observed spectrum (blue) of the field star observed behind the outflow of CK Vul. The model spectrum was reddened by AV=6 mag. The main features are identified. |
| In the text | |
Current usage metrics show cumulative count of Article Views (full-text article views including HTML views, PDF and ePub downloads, according to the available data) and Abstracts Views on Vision4Press platform.
Data correspond to usage on the plateform after 2015. The current usage metrics is available 48-96 hours after online publication and is updated daily on week days.
Initial download of the metrics may take a while.