Fig. 1
Download original image
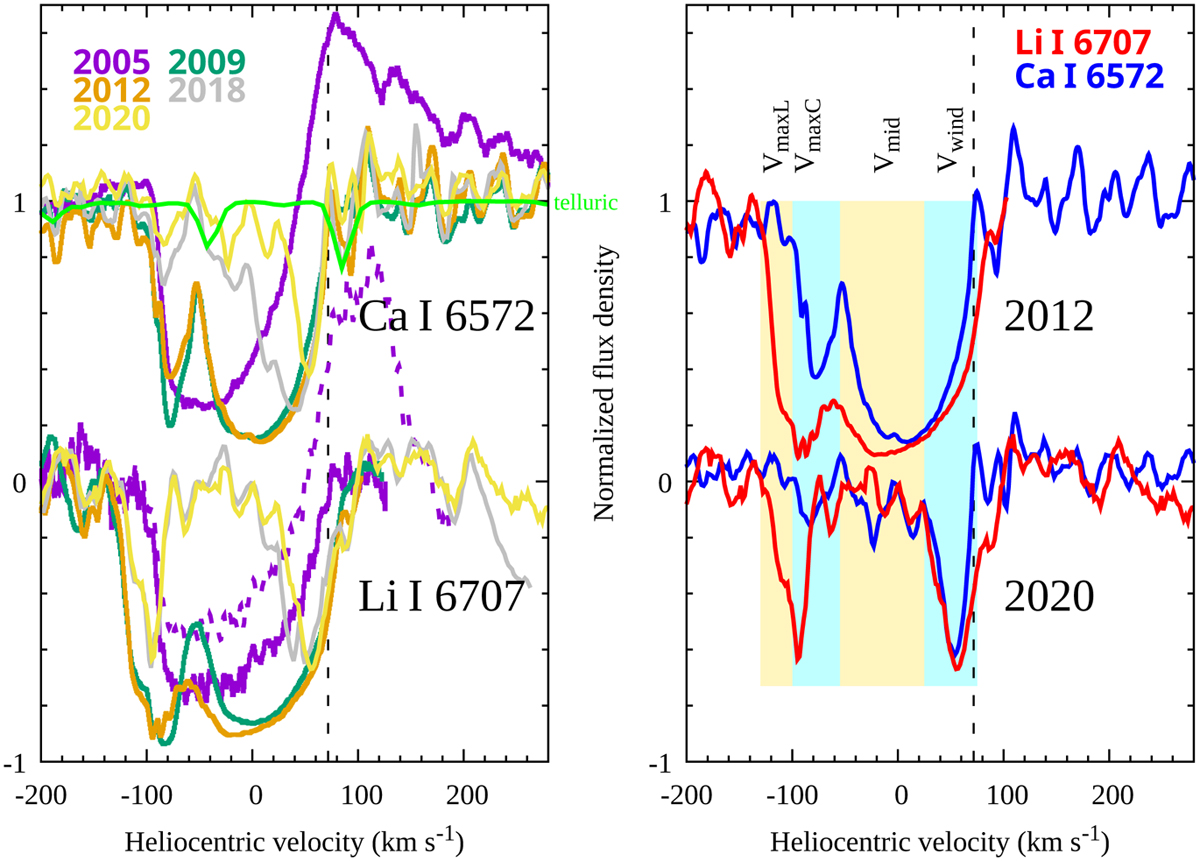
Profiles of the λ6572 line of Ca I and the λ6707 line of Li I in V838 Mon. Normalization of the spectra is uncertain, in particular for the Li I profile from 2005, which may display a profile with (dashed purple) or without (solid purple) emission (see text). The alternative profile normalization for the 2005 epoch shown with a dashed line was divided by 1.3 for better clarity. The Ca I profile is contaminated by two weak telluric features (light green), whose position and depth is different for all epochs but is close to the sample telluric spectrum, presented as the light green line. The dashed vertical line indicates the velocity of the SiO maser, which usually is indicative of the systemic velocity. The left panel shows changes in each profile over time, while the right panel compares profiles of both species for two sample epochs. Spectral regions highlighted in cyan and yellow were measured for relative line intensities (Table 2).
Current usage metrics show cumulative count of Article Views (full-text article views including HTML views, PDF and ePub downloads, according to the available data) and Abstracts Views on Vision4Press platform.
Data correspond to usage on the plateform after 2015. The current usage metrics is available 48-96 hours after online publication and is updated daily on week days.
Initial download of the metrics may take a while.