Fig. 5
Download original image
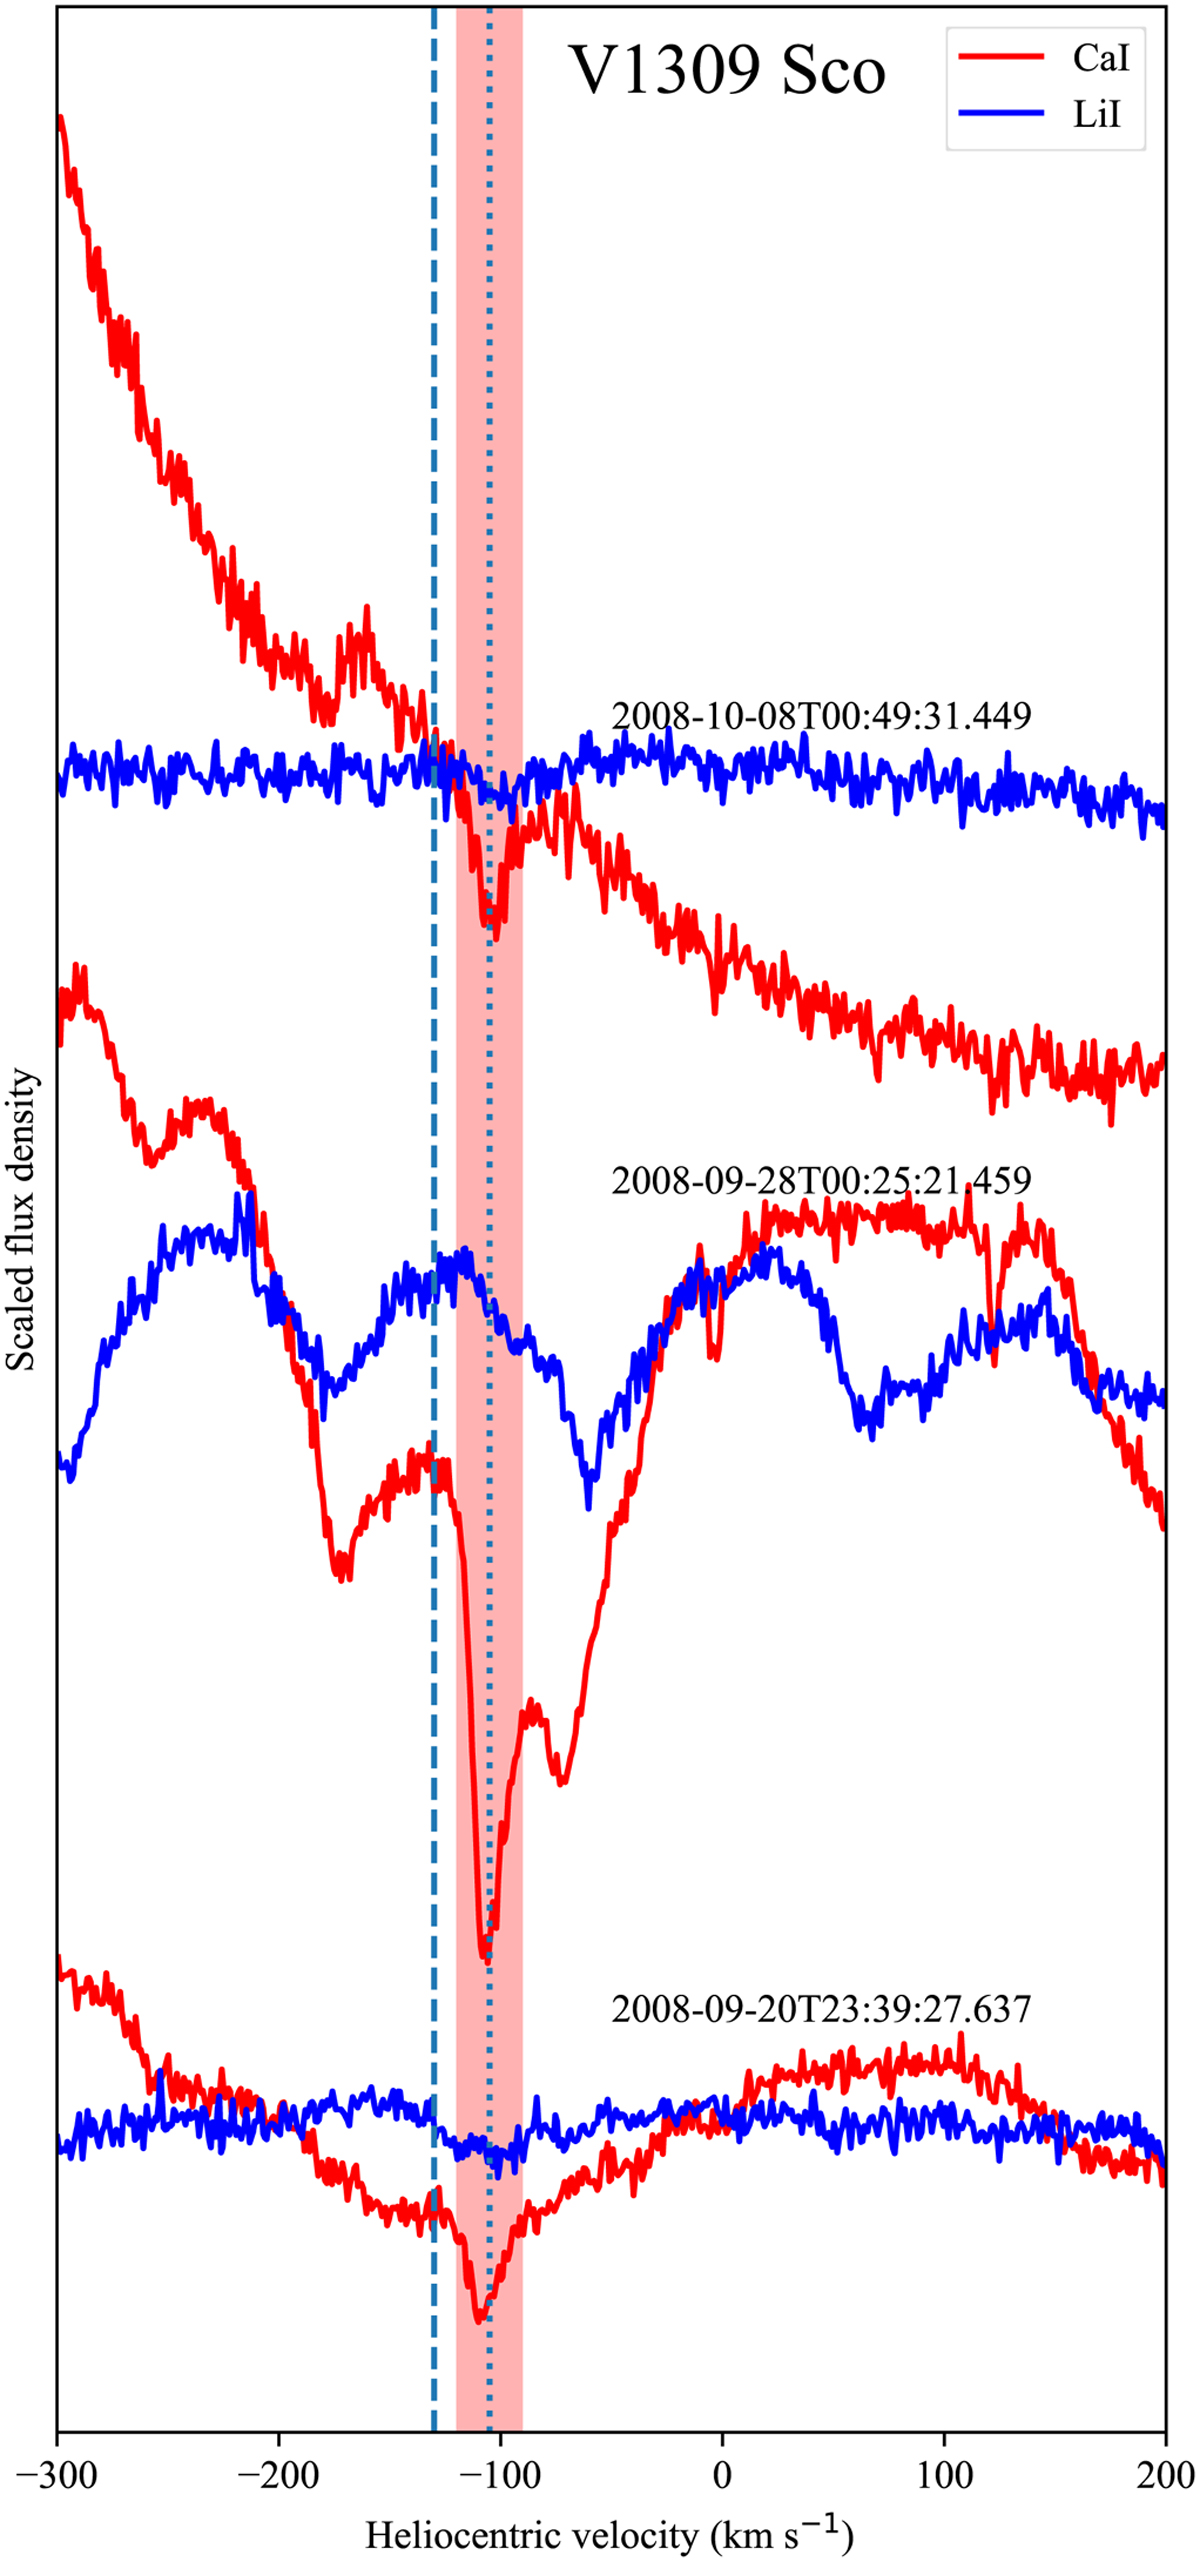
Sample spectra near the Li I and Ca I resonance lines, as observed by UVES in 2009, in V1309 Sco (Mason et al. 2010). The observing epochs are indicated as UT times for each pair. Spectra were not normalized and, for each pair, are to scale. The area highlighted in pink is where the strongest Ca I absorption is observed and where Li I may have a weaker corresponding feature. The vertical dotted line marks the central velocity of this component. The dashed line marks the peak position of the Li I and Ca I emission lines in the 2016 spectrum.
Current usage metrics show cumulative count of Article Views (full-text article views including HTML views, PDF and ePub downloads, according to the available data) and Abstracts Views on Vision4Press platform.
Data correspond to usage on the plateform after 2015. The current usage metrics is available 48-96 hours after online publication and is updated daily on week days.
Initial download of the metrics may take a while.