Fig. 3
Download original image
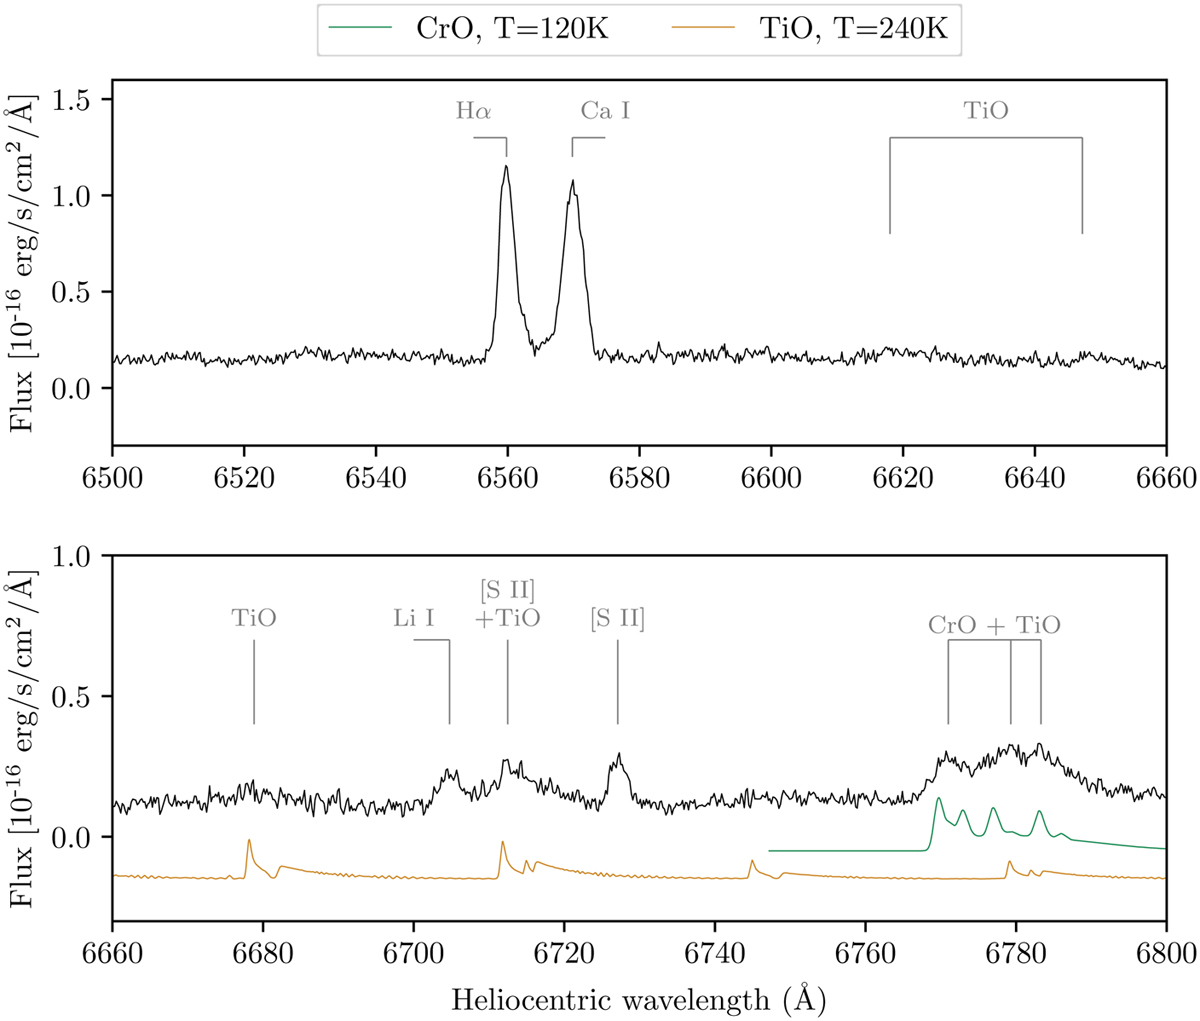
Spectra of V1309 Sco from 2016 near the lithium and calcium resonance lines. Neighboring features are identified. To better illustrate the contribution of TiO and CrO emission, simple simulations of their emission are shown in orange and green, respectively. The simulations were performed as in Kamiński et al. (2015a). Spectra were de-reddened but were not corrected for the spectroscopic baseline (which is not the true continuum of V1309 Sco).
Current usage metrics show cumulative count of Article Views (full-text article views including HTML views, PDF and ePub downloads, according to the available data) and Abstracts Views on Vision4Press platform.
Data correspond to usage on the plateform after 2015. The current usage metrics is available 48-96 hours after online publication and is updated daily on week days.
Initial download of the metrics may take a while.