Fig. 11
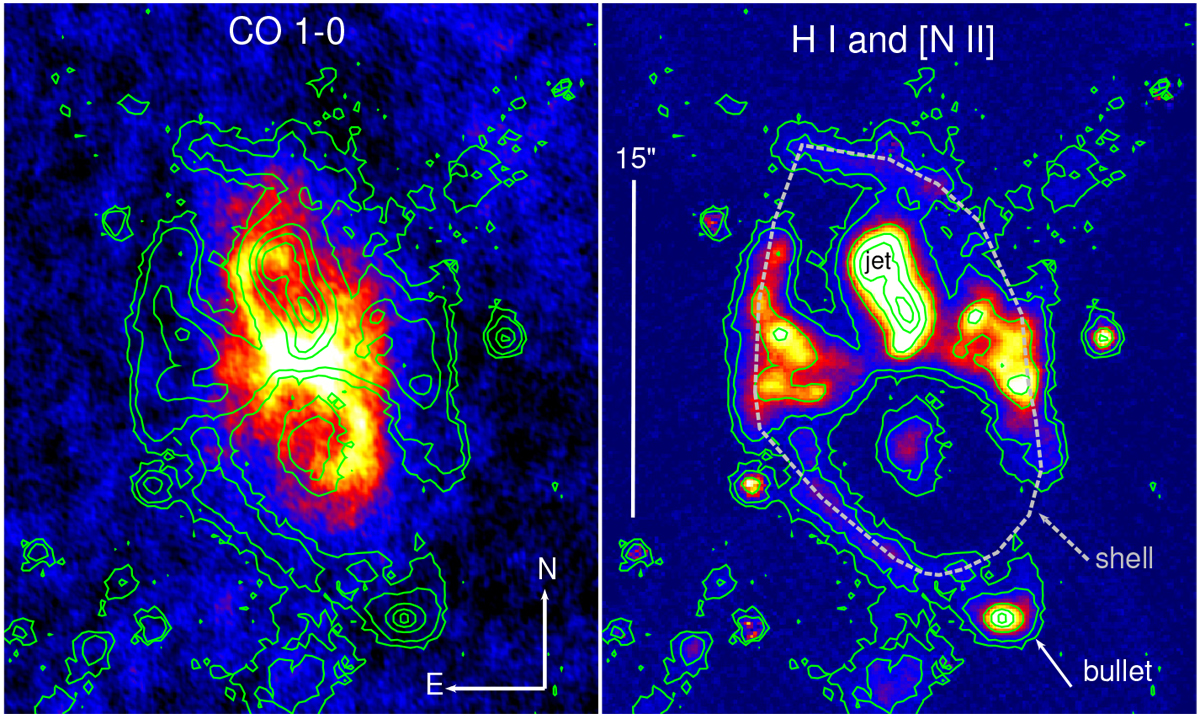
Relative location of atomic and molecular gas in the inner remnant. The color images in the left and right panels represent, respectively, CO 1–0 and optical nebular emission near Hα. The latter is also shown as contours on both maps. Nearly all unrelated continuum sources were removed from both maps. The main features are labeled in the right map. The dashed line roughly marks emission of a partially broken shell of recombining gas that appears to surround the molecular remnant (see text). The bullet is one of the two features studied in Hajduk et al. (2007) and whose proper motions indicate an ejection in 1670.
Current usage metrics show cumulative count of Article Views (full-text article views including HTML views, PDF and ePub downloads, according to the available data) and Abstracts Views on Vision4Press platform.
Data correspond to usage on the plateform after 2015. The current usage metrics is available 48-96 hours after online publication and is updated daily on week days.
Initial download of the metrics may take a while.