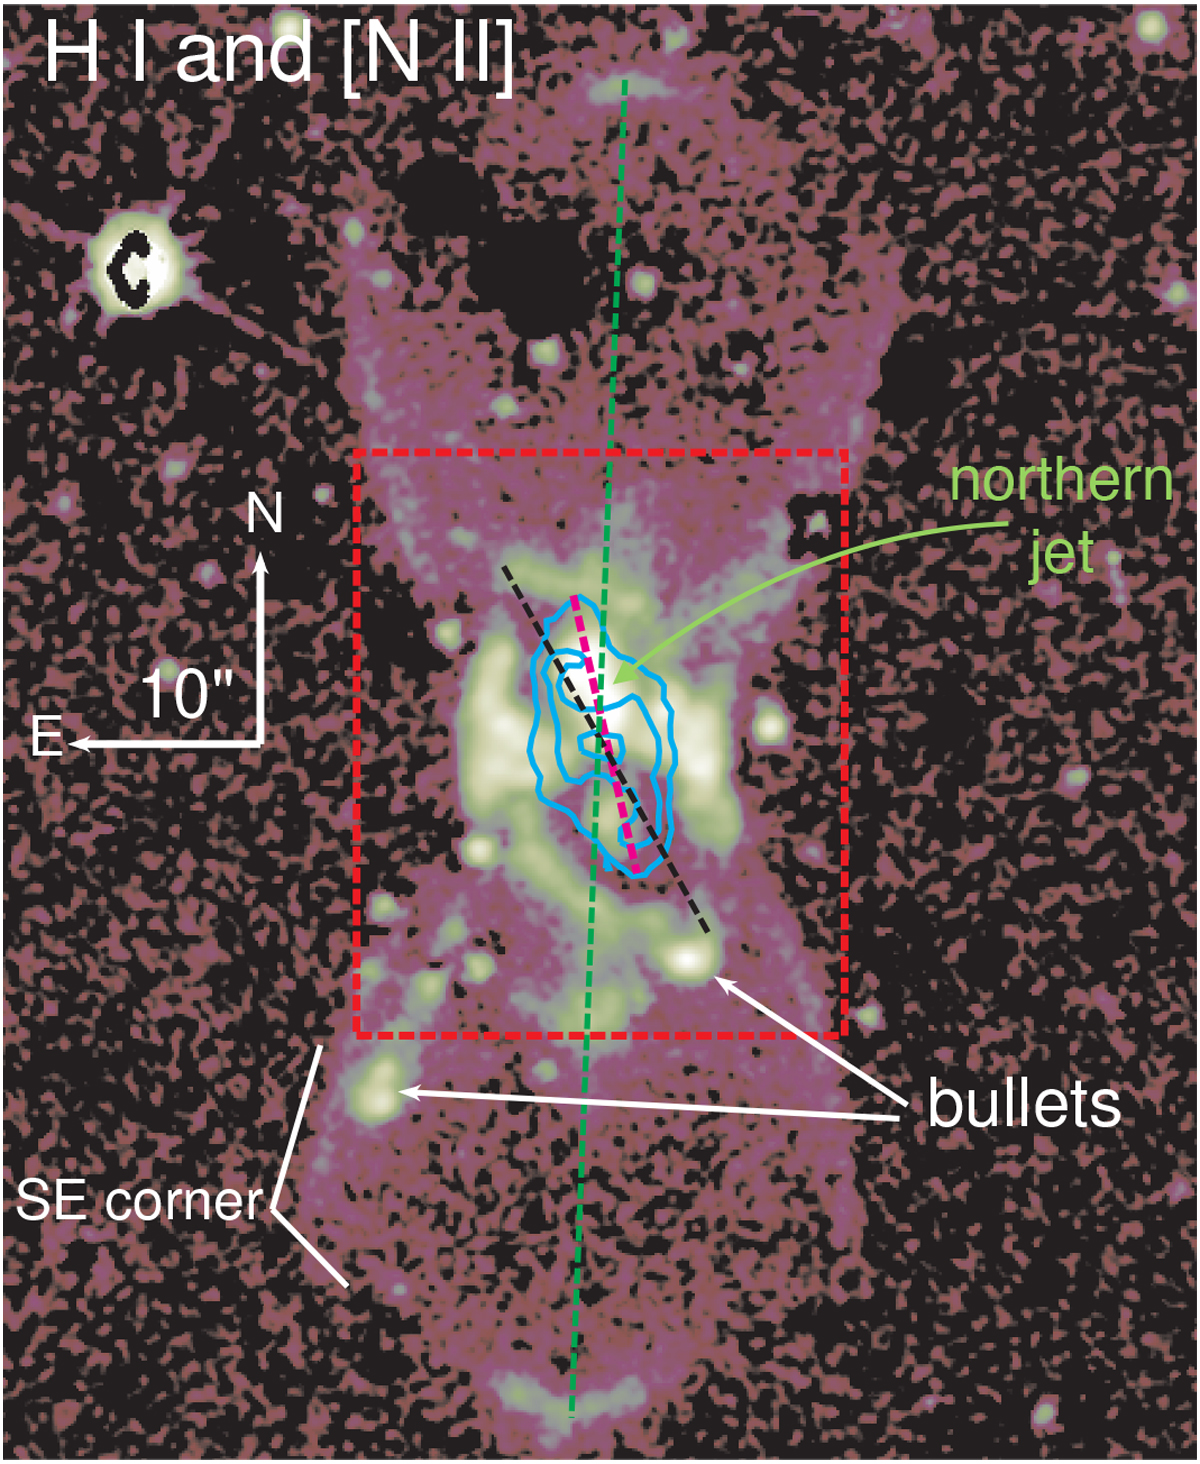
Fig. 1
Large-scale hourglass nebula of CK Vul. The background optical image shows the nebular emission in lines of Hα and [N II]. Although most stars are removed from the image, some considerable residuals can be seen (most of the point-like sources; Hajduk et al. 2007). The red dashed rectangle of 26′′ × 31′′ corresponds to the size of the maps in Fig. 11. The cyan contours show emission of CO 1–0. The dashed lines mark the symmetry axes of: the large hourglass nebula (green), the CO region (black), and the optical shell immediately surrounding the molecular nebula (magenta).
Current usage metrics show cumulative count of Article Views (full-text article views including HTML views, PDF and ePub downloads, according to the available data) and Abstracts Views on Vision4Press platform.
Data correspond to usage on the plateform after 2015. The current usage metrics is available 48-96 hours after online publication and is updated daily on week days.
Initial download of the metrics may take a while.