Free Access
Fig. 9
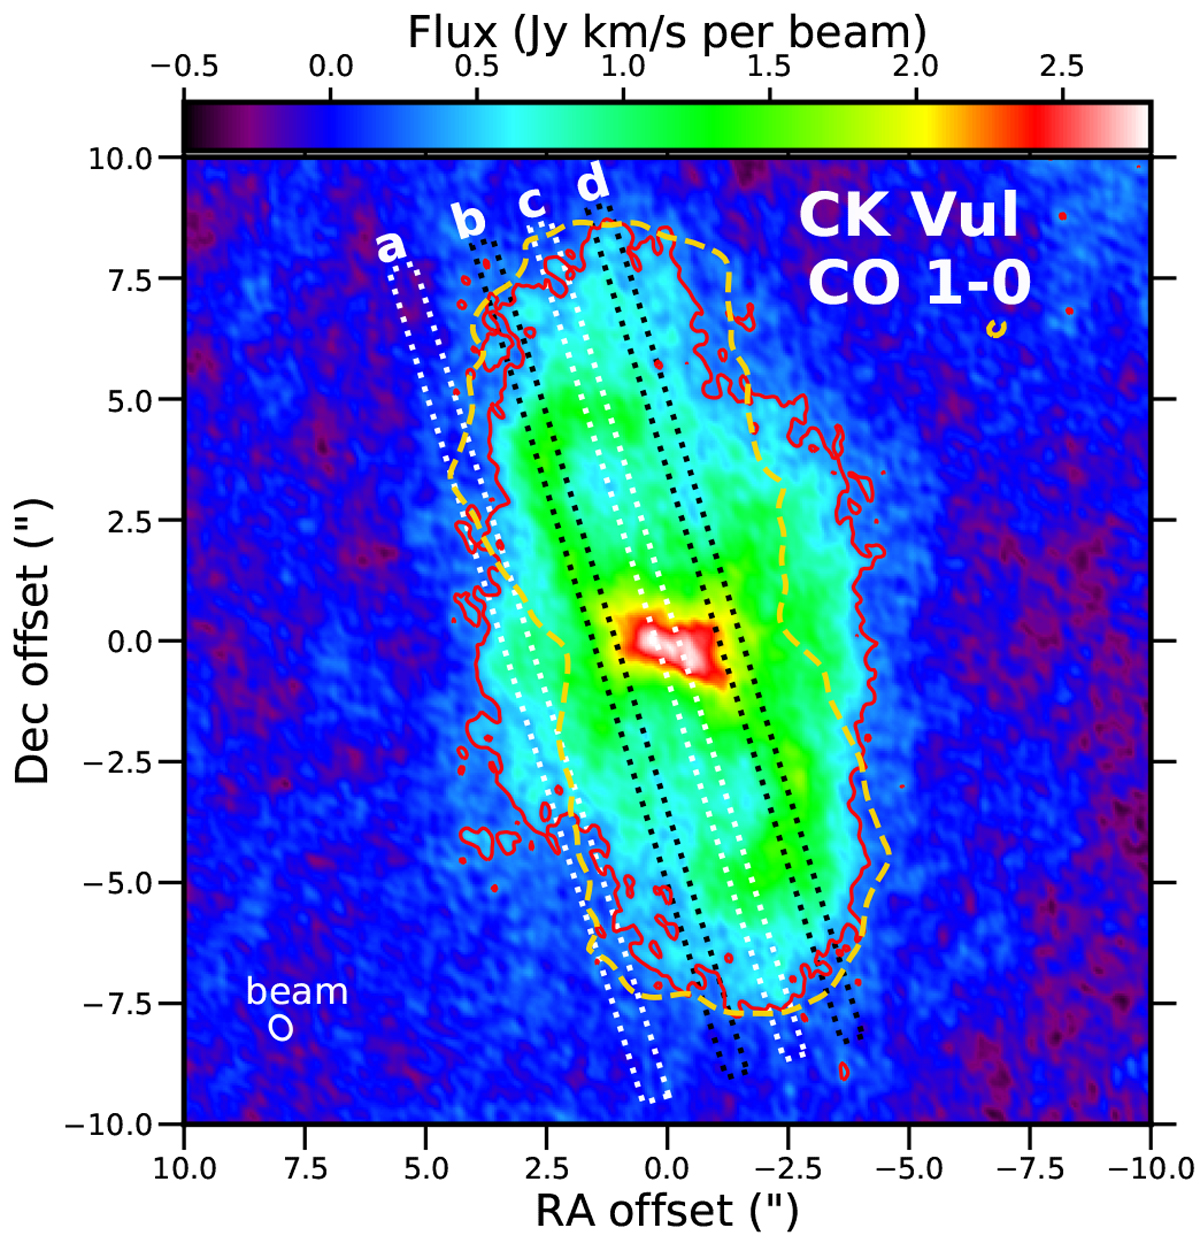
Total intensity map of 12CO 1–0 restored with natural weighting of visibilities. The 3σ level is shown with a red contour. The orange dashed contour shows the 3σ level for combined emission in several lines of HCN and H13CN. Dashed lines indicate locations of four virtual slits for which PV diagrams are shown in Fig. 10.
Current usage metrics show cumulative count of Article Views (full-text article views including HTML views, PDF and ePub downloads, according to the available data) and Abstracts Views on Vision4Press platform.
Data correspond to usage on the plateform after 2015. The current usage metrics is available 48-96 hours after online publication and is updated daily on week days.
Initial download of the metrics may take a while.