| Issue |
A&A
Volume 645, January 2021
|
|
|---|---|---|
| Article Number | A132 | |
| Number of page(s) | 12 | |
| Section | Planets and planetary systems | |
| DOI | https://doi.org/10.1051/0004-6361/202039245 | |
| Published online | 29 January 2021 | |
Linking planetary embryo formation to planetesimal formation
II. The effect of pebble accretion in the terrestrial planet zone
1
Max Planck Institute for Astronomy, Heidelberg,
Königstuhl 17,
69117 Heidelberg, Germany
e-mail: This email address is being protected from spambots. You need JavaScript enabled to view it.
2
Department of Space Studies, Southwest Research Institute,
Boulder,
CO 80302, USA
Received:
24
August
2020
Accepted:
23
October
2020
Abstract
Context. The accretion of pebbles onto planetary cores has been widely studied in recent years and is found to be a highly effective mechanism for planetary growth. While most studies assume planetary cores as an initial condition in their simulation, the question of the manner, location, and time at which these cores form is often neglected.
Aims. We study the effect of pebble accretion during the formation phase and subsequent evolution of planetary embryos in the early stages of circumstellar disk evolution. In doing so, we aim to quantify the timescales and local dependence of planetary embryo formation based on the solid evolution of the disk.
Methods. We connected a one-dimensional two-population model for solid evolution and pebble-flux-regulated planetesimal formation to the N-body code LIPAD. We focused on the growth of planetesimals with an initial size of 100 km in diameter by planetesimal collisions and pebble accretion for the first one million years of a viscously evolving disk. We compared 18 different N-body simulations in which we varied the total planetesimal mass after one million years, the surface density profile of the planetesimal disk, the radial pebble flux, and the possibility of pebble accretion.
Results. Pebble accretion leads to the formation of fewer but substantially more massive embryos. The area of possible embryo formation is weakly affected by the accretion of pebbles, and the innermost embryos tend to form slightly earlier than in simulations in which pebble accretion is neglected.
Conclusions. Pebble accretion strongly enhances the formation of super-Earths in the terrestrial planet region, but it does not enhance the formation of embryos at larger distances.
Key words: planets and satellites: formation / planets and satellites: terrestrial planets
© O. Voelkel et al. 2021
 Open Access article, published by EDP Sciences, under the terms of the Creative Commons Attribution License (https://creativecommons.org/licenses/by/4.0), which permits unrestricted use, distribution, and reproduction in any medium, provided the original work is properly cited.
Open Access funding provided by Max Planck Society.
1 Introduction
The accretion of solids and eventually gas (Pollack et al. 1996) onto planetary cores is widely used as the standard scenario for planet formation. Most studies in the field of planet formation begin with an initial planetary core that grows by either planetesimal (Ida & Lin 2004; Mordasini et al. 2012; Emsenhuber et al. 2020a,b; Voelkel et al. 2020) or pebble accretion (Bitsch et al. 2015, Ndugu et al. 2017, Lambrechts & Johansen 2012). Recent work included the consistent formation (Lenz et al. 2019) and accretion of planetesimals onto planetary embryos into a global model of planet formation (Voelkel et al. 2020). Despite the improvement, the presence of planetary embryos is still treated as an initial assumption. A fully consistent global model for planet formation however, would also have to form planetary embryos based on the previous evolution of the system. Studies that form planetary embryos from planetesimals usually neglect the formation of the planetesimals by assuming an initial distribution in the disk (Levison et al. 2015; Walsh & Levison 2015; Carter et al. 2015; Clement et al. 2020). We here present an expansion of our companion paper (Voelkel et al. 2021), in which we investigated the formation of planetary embryos from a dynamically evolving planetesimal disk and derived a one-dimensional parameterized analytic model for planetary embryo formation. The effect of pebble accretion (Ormel & Klahr 2010; Klahr & Bodenheimer 2006) on the formation of planetary embryo formation is now added to the same framework in this study.
To motivate our work, we discuss the following aspects (often either neglected or not accounted for in detail by previous works). One aspect that is generally neglected in the study of pebble accretion is that the pebble flux in a disk is not a constant, but instead evolves through radial drift and decays over time. Because pebble accretion relies on the active pebble flux, the time and location at which a planetary embryo is introduced into the simulation is therefore imperative for the evolution of this embryo. The accretion of planetesimals onto planetary embryos, as well as planetesimal growth by collisions, is sensitive to the size of planetesimals, the local planetesimal surface density, and the orbital distance to the star. The evolution and growth of a planet thus strongly depends on its environment, but the cores themselves are also assumed to form from the smaller material in the disk. Modeling the formation of planetary embryos therefore requires an understanding of the local solid evolution of a circumstellar disk. To fully understand the local evolution, however, we need to understand the global evolution of the disk as well because solids can drift through the circumstellar disk from far-out regions. Modeling the formation of planetary embryos in the terrestrial planet region in a self-consistent disk therefore requires understanding the global formation of planetesimals and evolution of the pebble flux during the time of embryo formation. This study is an extension of our companion paper, Voelkel et al. (2021), in which we studied the effect of the planetesimals surface density and disk mass on the formation of embryos. Our companion paper found that the formation of planetary embryos from 100 km planetesimals occurs from the inside out and that the orbital separation of initial embryos converges to ≈ 15RHill. Our finding confirmed the oligarchic growth nature of the embryo formation process (Kokubo & Ida 1998, Kobayashi et al. 2011, and Walsh & Levison 2019, to mention just a few).
One main result from Voelkel et al. (2021) is that the total number of embryos does not simply increase by introducing more mass in the system. The embryos that exist grow larger, thus increasing their mutual orbital separation. Additionally, the formation area within 1 Myr increases for higher disk masses, which leads to a similar number of embryos after 1 Myr for our systems. The orbital separation leads to a cumulative number of embryos that increases logarithmic with distance. This behavior is not strongly affected by the planetesimal surface density profile.
Voelkel et al. (2021) also introduced an analytic model that succeeded in reproducing the total number, spatial distribution, and formation time of planetary embryos when given the same one-dimensional planetesimal surface density evolution.
In our companion paper, we find that the innermost embryos form while planetesimals are still forming as well. This instigates that an active pebble flux exists after the formation of the innermost embryos. The outer embryos form after the formation of planetesimals has mostly ceased. While the accretion of pebbles is not considered in our first study, their presence is promising for planetary growth.
In addition to our companion paper, we now introduce the accretion of pebbles onto planetesimals and planetary embryos. Studies regarding the evolution of a planetary system from planetesimals and pebbles in the LIPAD (Levison et al. 2012) code have been conducted by Kretke & Levison (2014). In contrast to what has been studied in Kretke & Levison (2014), we introduce planetesimals over time based on their formation of a one-dimensional planetesimal formation model described in Sect. 2. Within this study we connect a global model for the evolution of a circumstellar disk that involves the formation and drift of pebbles, as well as the pebble-flux-regulated formation of planetesimals with N-body simulations. The N-body then tracks their subsequent growth and dynamical evolution. Using this framework, we study a wide range of parameters to investigate their individual contribution to the formation of planetary embryos and the evolution of planetary systems in the terrestrial planet region. In addition to the formation of planetesimals, we now introduce a radial pebble flux and the possibility of pebble accretion in our framework. The evolution of the pebble flux stems from the same disk evolution that also forms the planetesimals within the N-body simulation. Comparing our results from this study with our previous study, we present 18 different N-body simulations in which we vary the planetesimal surface density profile, the total mass in planetesimals, and the total pebble flux.
In Sect. 2 we summarize the theory behind our approach, and we explain the numerical setup in Sect. 3. Section 4 presents the results, which are discussed in Sect. 5. Section 6 summarizes our findings and gives an outlook to future work.
2 Pebbles, planetesimals, and embryos
The goal of this study is to comprehensively model the formation and early dynamical evolution of planetary embryos following an initial population of dust as it is converted into pebbles and planetesimals. We specifically focus on investigating how the accretion of pebbles affects this formation process. The framework that we chose to make this possible is split into two parallel subprocesses. We first compute the viscous evolution of a circumstellar gas disk including its solid evolution and planetesimal formation. The qualitative evolution of the solids serves as a proxy for planetesimal formation and the pebble flux to be included in the N-body simulations. In this way, the N-body simulation runs with the planetesimals and pebbles that have been formed using the one-dimensional approach while continuing to compute their growth through collision and accretion.
A detailed description of the pebble-flux-regulated planetesimal formation model and the two-population solid evolution model can be found in Lenz et al. (2019) and Birnstiel et al. (2012). Our approach of coupling the one-dimensional planetesimal formation model to the N-body simulation in LIPAD (Levison et al. 2012), as well as a detailed description of the physical models, is described in our previous work (Voelkel et al. 2021). In the following we give a brief summary of the underlying physical principles.
2.1 Planetesimal formation and pebble evolution
Our framework uses the two-population solid evolution approach from Birnstiel et al. (2012) to compute the dust and pebble evolution of a viscously evolving circumstellar disk (Shakura & Sunyaev 1973) and the pebble-flux-regulated planetesimal formation model by Lenz et al. (2019). This framework has recently been used to study the effect of planetesimal formation on the formation of planets (Voelkel et al. 2020) and was applied in our companion paper (Voelkel et al. 2021).
The two-population model uses a parameterized mass relation between a small and a large population of solids in the disk, defined by their Stokes number. The small particles (St ≪1) are coupled to the dynamic motion of the gas and can be seen as dust, while the larger particles (St ~ 1) are detached from the gas motion and can be seen as pebbles. The parameter that separates the two populations was derived by fitting the two-population approach to larger coagulation-based simulations of grain growth (Birnstiel et al. 2010). Planetesimals then form proportional to the radial pebble flux (Lenz et al. 2019). The planetesimal formation model assumes that particle traps can appear at any location in the disk and last for a given lifetime. The model assumes that a fraction of the radial pebble flux that drifts through a particle trap can be transformed into planetesimals. Planetesimals form with an initial size of 100 km in diameter (Klahr & Schreiber 2020; Abod et al. 2019; Johansen et al. 2009) in our setup and in Lenz et al. (2019). As an arising necessity, to form at least one planetesimal, a threshold mass has to be reached that is transformed from the pebble flux. The approach itself does not specify the underlying mechanism or instability (e.g., streaming instability or Kelvin-Helmholtz instability) that drives the formation of planetesimals, it is a model-independent framework that forms planetesimals based on the radial pebble flux.
2.2 Embryo formation
We define a planetary embryo as an object with at least one lunar mass (Me = 0.0123M⊕) in our study. Growing an embryo from 100 km sized planetesimals (with a bulk density of ρ = 1 g cm−3) requires more than 5 orders of magnitude of growth. This would require hundreds of thousands of planetesimals to form a single embryo through collisions, making this problem computationally unfeasible for classical numerical integrators. Thus, in order to solve this problem, we used the code known as LIPAD (Lagrangian integrator for planetary accretion and dynamics, see Levison et al. 2012). LIPAD is a Lagrangian code that uses the concept of tracer particles to follow the dynamical, collisional, and accretional evolution of a very large number of sub-kilometer and kilometer-sized planetesimals all the away until they become planets.
Collisional routines are employed to determine when collisions between tracers occur. In this event, following a probabilistic outcome based on a fragmentation law by Benz & Asphaug (1999), tracers can be assigned new physical radii. Therefore a distribution of tracers in LIPAD represents the size distribution of the evolving planetesimal population. The interaction among tracers results from statistical algorithms for viscous stirring, dynamical friction, and collisional damping.
Our study introduces planetesimal and pebble tracer particles and computes their growth by planetesimal collisions and pebble accretion. Tracer particles are represented by three quantities: mass, physical radius, and bulk density. These three quantities relate to each other as ![Mathematical equation: $n_{\textrm{pl}} = m_{\textrm{tr}} / [ (4./3.) \rho r_{\textrm{pl}}^3 ]$](/articles/aa/full_html/2021/01/aa39245-20/aa39245-20-eq1.png) . Here, npl is the number of planetesimals represented by a single tracer particle, mtr is the tracer constant mass, ρ its constant bulk density, and rpl the planetesimal size that the tracer represents. This implies that the number of planetesimals represented by a single tracer is larger for smaller planetesimals. It also implies that as planetesimals grow as a result of their collisional evolution and accretion, they are less represented by a single tracer. As a result, once a planetesimal grows to the point where a tracer will represent only one object (a lunar mass object in our case), this tracer becomes an embryo and is then treated as an individual N-body object in the simulation. These planetary embryos interact among themselves, as well as with tracers, through normal N-body routines (Duncan et al. 1998).
. Here, npl is the number of planetesimals represented by a single tracer particle, mtr is the tracer constant mass, ρ its constant bulk density, and rpl the planetesimal size that the tracer represents. This implies that the number of planetesimals represented by a single tracer is larger for smaller planetesimals. It also implies that as planetesimals grow as a result of their collisional evolution and accretion, they are less represented by a single tracer. As a result, once a planetesimal grows to the point where a tracer will represent only one object (a lunar mass object in our case), this tracer becomes an embryo and is then treated as an individual N-body object in the simulation. These planetary embryos interact among themselves, as well as with tracers, through normal N-body routines (Duncan et al. 1998).
The promotion of a planetesimal tracer particle to a planetary embryo in LIPAD is what we define as the initial formation of a planetary embryo. We refer to Voelkel et al. (2021) for a detailed description of the conversion of one-dimensional solid evolution outcomes into tracers, as well as to Levison et al. (2012), Kretke & Levison (2014), Walsh & Levison (2016, 2019), Deienno et al. (2019, 2020) for a series of previous applications of LIPAD.
LIPAD also contains a prescription of the gaseous nebula from Hayashi (1981). This gas disk provides aerodynamic drag, eccentricity, and inclination damping on every object.
2.3 Pebble accretion
The fundamental difference to Voelkel et al. (2021) of our study lies in the accretion of pebbles onto planetesimals and planetary embryos. In the following we briefly explain the concept of pebble accretion based on Ormel & Klahr (2010) and Lambrechts & Johansen (2012). A detailed description of the implementation of pebble accretion in LIPAD can be found in Kretke & Levison (2014). When we refer to pebble accretion, we talk about the accretion of particles onto bodies that is strongly enhanced by gas drag. For this to occur, several conditions need to be met. The stopping timescale of the particle that is to be accreted must be long compared to the timescale of deflection by the target’s object gravity. More specifically, the timescale of the gravitational encounter must be shorter than four times the stopping time,
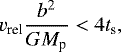 (1)
(1)
with G as the gravitational constant and ts the stopping time. vrel is given as the relative velocity of the particle and the planetesimal or planetary embryo of mass Mp. The impact parameter b2 can then be expressed as
 (2)
(2)
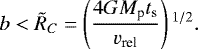
The second criterion states that the stopping time of the particle must be shorter than the time it takes for the particle to drift past the target. The impact parameter for the time at which a particle is deflected by 90° then gives
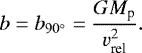 (3)
(3)
In summary, the first criterion states that small dust cannot contribute to pebble accretion because it is too strongly coupled to the motion of the gas, while the second criterion illustrates why larger objects such as planetesimals do not benefit from gas drag. The critical crossing timescale can then be defined as
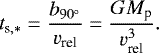 (4)
(4)
In the LIPAD simulation, pebbles radially drift inward. The decision whether a pebble can be accreted by an object is made if the particle is within the Hill radius of the object and under the condition that
![Mathematical equation: \begin{align*} b < R_C = \Tilde{R}_C \exp{\left[ - \left(\frac{t_{\textrm{s}}}{4 t_{\textrm{s},*}} \right){}^{\gamma} \right],} \end{align*}](/articles/aa/full_html/2021/01/aa39245-20/aa39245-20-eq6.png) (5)
(5)
with γ = 0.65 (Ormel & Klahr 2010). Pebbles enter the N-body simulation in the form of pebble tracers (Kretke & Levison 2014).
3 Simulation setup
The setup of our present study is an expansion of our previous work (Voelkel et al. 2021) and is described there in greater detail, but for the purposes of this work, we briefly describe the model setup here. We computed the first 1 Myr of a viscously evolving disk including the two-population solid evolution and pebble-flux-regulated planetesimal formation model from Sect. 2. The mass rate of planetesimal formation was then given as input to the LIPAD N-body simulation in terms of a corresponding number of planetesimal tracers every 10 kyr. With our setup we studied the evolution of planetary embryo formation for 18 different systems in which we varied the total planetesimal disk mass after 1 Myr, the planetesimal surface density profile, and the total pebble flux. The total planetesimal masses after 1 Myr are given by 6 M⊕, 13 M⊕, and 27 M⊕. The planetesimal surface density profile varied by ΣP ∝ r−1.0, ΣP ∝ r−1.5, and ΣP ∝ r−2.0. Our study individually compares systems in which pebble accretion is active to those in which it is ignored. In addition to our previously published work (Voelkel et al. 2021), we introduced a radial pebble flux into the LIPAD simulation. Pebbles were placed outside the outer edge of our computational domain at 5 au. The total mass of the pebble flux over 1 Myr was varied by 57.7 M⊕ in the 6 M⊕ case, 115.8 M⊕ in the 13 M⊕ case, and 232.5 M⊕ in the 27 M⊕ case. The corresponding mass was introduced over 1 Myr into the simulation in the form of pebble tracers. Pebble tracers were then accreted by the planetesimal tracers and the embryos in the domain. The qualitative evolution of the pebble flux at 5 au was taken from our one-dimensional solid evolution model as well, similar to the formation of the planetesimal disk. LIPAD currently does not have the capability of transforming a flux of pebbles into planetesimals. The formation of planetesimals still stems from the one-dimensional disk evolution as in Voelkel et al. (2021).
The change in disk mass, the disk formation rate, and the radial pebble flux at 5 au that were used in our setups is shown in Fig. 1. While simulations that evolve the systems for longer times (e.g., 100 Myr) are technically possible, we chose to focus on the first million years for several reasons. Not only is the longer computation very costly, but Fig. 1 also shows that the formation of planetesimals after 1 Myr in our setup has largely ceased. Another reason is that the interaction between larger planets and the gas disk (e.g., planetary migration) would need to be treated more carefully, as would the dispersal of the gas disk itself. The system after1 Myr remains mostly dynamically cold. The reason is that the gas component of the disk does not decrease in our setup. Thus, aerodynamic damping in eccentricity plays an important role in our simulations. We understand that neglecting gas disk dispersal is not necessarily ideal (the amount of gas in the disk would likely decay with time). However, the gas is not expected to vanish within 1 Myr either, and even a small gas component could result in a substantial effect on the growing planets. Because of the large uncertainties involving gas-dispersal timescales and because we are mostly interested in determining where and when lunar-mass embryos would form (within a 1 Myr period), we therefore hold the differences regarding the gas-disk decay to be minor for our goals.
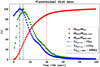 |
Fig. 1 Percentage change of the planetesimal disk mass Ṁdisk, the total disk mass Mdisk, and the radial pebble flux at 5 au. The disk mass (red dots) is normalized by the total disk mass after 106 yr. The green dots indicate the disk-mass increase every 104 yr (Ṁdisk), normalized by the maximum mass change (Ṁdisk, max). The blue dots indicate the pebble flux every 104 yr (Ṁpeb), normalized by the maximum pebble flux (Ṁpeb, max). We find that ~90% of planetesimals have formed within 400 kyr with a peak in the pebble flux at ~75 kyr and another in planetesimal formation at ~115 kyr. |
4 Numerical results
4.1 Embryo formation
In Figs. 2–4 we show the time, mass, and semimajor axis evolution of planetary embryo formation with the LIPAD code. The total mass after 1 Myr in planetesimals is given as 6 M⊕ (Fig. 2), 13 M⊕ (Fig. 3), and 27 M⊕ (Fig. 4). The simulations in which pebble accretion is not included (left panels) were taken from our previous work (Voelkel et al. 2021) and serve as comparison in this study. The panels on the right always show the same system in which pebble accretion is included. The black dots can be interpreted as the initial formation of embryos. In addition to this, we define the term “active” embryos. This term refers to all objects above embryo mass at a given time. Every active embryo used to be an initial embryo, butnot every initial embryo remains in the system because of mergers. The individual embryos are connected by a gray line for clarity. The red line refers to the analytical estimate after which embryo formation is possible from Voelkel et al. (2021)
4.2 Embryo masses
Figure 5 shows the number of different embryo masses after 1 Myr for the systems from Figs. 2–4. The blue and orange histograms refer to simulations where we considered and neglected pebble accretion, respectively. Without pebble accretion, there is no embryo with a mass higher than 1 M⊕, whereas thisis a very common outcome for the simulations in which pebble accretion is included. In every system, the highest mass is generally achieved when pebble accretion is included.
While the systems in which pebble accretion is neglected fail to build super-Earths with our input parameters, the formation of such planets becomes possible when pebble accretion is included. While the number of active embryos decreases when pebble accretion is included (see Fig. 6), their masses increase drastically.
4.3 Active number and total mass
Figure 6 shows the total number of embryos and the total mass that is in embryos over time for the setups from Figs. 2–4. We also give the fraction of total embryo mass MEmb over the mass that was given to the planetesimaldisk after 1 Myr (MD) for each setup. The first embryos always form in the systems in which pebble accretion is enabled. However, the number of active embryos during the simulation is almost a factor of 2 below the number of embryos in the systems without pebble accretion. The mass in embryos differs even more strongly than the active number of embryos for the corresponding systems. The fraction MEmb∕MD consistentlyincreases for higher total masses and steeper ΣP -profiles, respectively. In the systems in which pebble accretion is included, it can exceed unity. This means that the mass in planetary embryos can be higher than the mass that is transformed into planetesimals through pebble accretion.
4.4 Orbital separation
In Fig. 7 we compare the mean orbital separation of embryos over time for the systems from Figs. 2–4. The orbital separation is expressed in units of the embryos Hill radii. The mean orbital separation after 1 Myr converges to ≈ 10RHill for each setup. The simulations in which pebble accretion is included show a smoother and more stable behavior over time than the systems in which pebble accretion is neglected. The explanation of these differences lies in the fact that the first embryos can start growing farther apart from each other in the runs that only consider planetesimal accretion. Therefore numerous embryos are needed in order to converge for a characteristic orbital Hill spacing.
When pebble accretion is considered, embryos initially tend to grow closer to each other. Connecting the orbital separation from Fig. 7 with the embryo masses from Fig. 5 and the time semimajor-axis evolution from Figs. 2–4, we can see that the absolute physical distance between embryos increases largely because of their mass increase and therefore their increasing Hill radius.
The dynamical separation of embryos when expressed in Hill radii does not change, but their physical separation as a consequencedoes. The possible area of embryo formation, on the other hand, does not enlarge if pebble accretion is included (see Figs. 2–4). Because the orbital separation increases, the number of active embryos within the possible area of embryo formation decreases. This is a consequence of their rapid growth by pebble accretion.
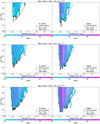 |
Fig. 2 Time over semimajor-axis evolution of the N-body simulation in LIPAD. The time and location at which an object has first reached lunar mass is indicated by the black dots in the plot. The subsequent growth of the embryo is tracked and connected with the gray lines, and its mass is given by the color bar. The mass in planetesimals after 1 Myr is given by 6 M⊕ in these runs, the planetesimal surface density slope is varied (ΣP ∝ r−1.0, ΣP ∝ r−1.5, and ΣP∝ r−2.0). Left panels: system without pebble accretion. Right panels: system in which pebble accretion is included. The red line indicates the time after which the analytic model presented in Voelkel et al. (2021) states that embryo formation is possible. |
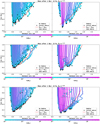 |
Fig. 3 Time over semimajor-axis evolution of the N-body simulation in LIPAD. The time and location at which an object has first reached lunar mass is indicated by the black dots in the plot. The subsequent growth of the embryo is tracked and connected with the gray lines, and its mass is given by the color bar. The mass in planetesimals after 1 Myr is given by 13 M⊕ in these runs, the planetesimal surface density slope is varied (ΣP ∝ r−1.0, ΣP ∝ r−1.5 and, ΣP∝ r−2.0). Left panels: system without pebble accretion. Right panels: system in which pebble accretion is included. The red line indicates the time after which the analytic model presented in Voelkel et al. (2021) states that embryo formation is possible. |
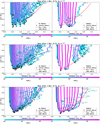 |
Fig. 4 Time over semimajor-axis evolution of the N-body simulation in LIPAD. The time and location at which an object has first reached lunar mass is indicated by the black dots in the plot. The subsequent growth of the embryo is tracked and connected with the grey lines, and its mass is given by the colorbar. The mass in planetesimals after 1 Myr is given by 27 M⊕ in these runs, the planetesimal surface density slope is varied (ΣP ∝ r−1.0, ΣP ∝ r−1.5, and ΣP∝ r−2.0). Left panels: system without pebble accretion. Right panels: system in which pebble accretion is included. The red line indicates the time after which the analytic model presented in Voelkel et al. (2021) states that embryo formation is possible. |
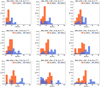 |
Fig. 5 Embryo masses after 1 Myr for the different parameters from Figs. 2–4. The orange histograms show the systems in which pebble accretion is neglected, and the blue histograms show the systems in which pebble accretion is enabled. |
4.5 Cumulative distribution
As we showed in Fig. 6, the total number of active embryos in the simulation decreases strongly when pebble accretion is included. In Fig. 8 we show the cumulative number of initial embryos for the systems from Figs. 2–4. We also highlight where the innermost and outermost embryos form within 1 Myr for each setup via vertical dotted lines with corresponding colors. In terms of the initial formation of embryos, the outermost embryo forms farther out in the system in which pebble accretion is neglected. For the formation of the innermost embryo, pebble accretion shows no dominant effect. Because the orbital separation is still the same in terms of theembryos Hill radii, which scales linearly with the distance to the star, we find the same logarithmic distribution of cumulative embryos, but with a lower total number than in the simulations without pebble accretion.
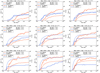 |
Fig. 6 Number of active embryos (solid line) and total mass in embryos (dashed line) over time for the systems from Figs. 2–4. The orange curves refer to the systems in which pebble accretion is disabled, whereas the blue lines refer to the systems in which pebble accretion is enabled. We also give the fraction of embryo mass over the total mass that entered the planetesimal disk after 1 Myr (MEmb ∕MD). |
5 Discussion
5.1 Effect of pebble accretion
We showed that an active pebble flux has major consequences on the evolution of the planetary systems within the first 1 Myr. The accretion of pebbles leads to the formation of a lower number of substantially more massive embryos within a smaller semimajor-axis interval of embryo formation. The physical spacing between embryos increases because of their higher masses in the pebble accretion runs. Their orbital separation when expressed in Hill radii remains unaffected and converges to ≈10 RHill in both cases. Embryos that form at larger distances (>1.5 au) well after  remain with low masses because they fail to undergo significant pebble accretion. This behavior has been predicted in our first study, which neglected the accretion of pebbles, but suggested that the disk formation rate is a valid constraint for pebble accretion because it depends on pebble flux. We find that the outer edge of embryo formation moves slightly inwards when the accretion of pebbles is considered. No formation of embryos occurs at larger heliocentric distances within the lifetime of the pebble flux. The necessary size for significant pebble accretion is not reached at larger distances within the lifetime of our pebble flux.
The formation of the first embryo occurs earlier in the inner region when pebble accretion is considered. The embryos that form first finally have the highest masses after 1 Myr. The accretion of pebbles plays a major role once embryos have formed. Their effect on the local formation time, while noticeable, plays a subordinate role. In general, the accretion of pebbles strongly favors the formation of super-Earths in the terrestrial planet region, but it does not enhance planetary embryo formation at larger distances.
5.2 Consequences for the analytic embryo formation model
In our companion study (Voelkel et al. 2021) we introduced an analytic model that succeeded to reproduce the results of the local formation time, the spatial distribution, and the total number of initial embryos in N-body simulations without pebble accretion. In brief, the formation of embryos in the analytic model is based on two criteria. Criterion I refers to the necessary local growth time. Criterion II determines the orbital separation to other embryos. The model uses a parameterized approach to compute the local growth timescales of planetesimals based on the local planetesimal surface density evolution. Embryos are placed if the analytic growth surpassed the mass of a planetary embryo and the orbital separation to the other already existing embryos is above an input parameter.
As discussed in Sect. 5.1, the effect of pebble accretion is largely found in the mass of the embryos, not in their initial formation time. Criterion I of the embryo formation model therefore still yields the correct results (even though we find slight deviations in the inner regions).
The number of embryos and their spatial distribution are determined by criterion II. Under the assumption that the already placed embryos grow by pebble accretion and their Hill radii increase, respectively, the physical spacing between the embryos thus enlarges. As a consequence, the total number of embryos decreases because the semimajor-axis interval of embryo formation does not increase (criterion I). The analytic model for embryo formation from Voelkel et al. (2021) is therefore still valid in a framework that includes pebble accretion. Implementing the analytic model into a global model for planet formation that includes planetesimal formation and pebble accretion is the subject of future studies.
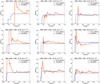 |
Fig. 7 Orbital separation of active embryos over time from the systems from Figs. 2–4. The orange curves refer to the systems in which pebble accretion is disabled, and the blue curves refer to the systems in which pebble accretion is enabled. The distance is expressed in units of the embryos Hill radii. |
6 Summary and outlook
We studied the effect of pebble accretion and planetesimal formation on the formation of planetary embryos in the terrestrial planet region. For this purpose, we connected a one-dimensional model for pebble-flux-regulated planetesimal formation and solid evolution with the N-body code LIPAD. Thus we studied the growth and fragmentation of planetesimals with an initial size of 100 km in diameter within the first million years of a viscously evolving circumstellar disk. In this paper we compared 18 different N-body simulations in which we varied the total mass in planetesimals, the radial pebble flux, and the planetesimal surface density profile. Building on the efforts of our previous study (Voelkel et al. 2021), we included a radial pebble flux and the accretion of pebbles during the formation of planetary embryos. The main effects on embryo formation by pebble accretion in the terrestrial planet region are summarized below:
-
pebble accretion is highly favorable for the formation of super-Earths;
-
when compared with planetesimal accretion alone, the total number of embryos decreases strongly when pebble accretion is considered, while the individual embryos grow significantly more massive;
-
embryos that form early in the inner regions of the disk grow rapidly by pebble accretion, whereas the outer embryos that form later fail to do so;
-
the outer edge of planetary embryo formation is not increased when pebble accretion is included. Our work indicates that it is not possible to form planetary embryos at larger distances (>2 au) within the lifetime of a radial pebble flux for our assumptions.
Our findings from the first part of our study are still valid: the formation of planetary embryos first occurs in the innermost regions and then proceeds to larger distances. The number of embryos is given as the number of orbital distances within their possible formation zone. Because embryos grow more massive when pebble accretion is included, we find that the number of embryos decreases. The area in which they form, however, is not increased by pebble accretion because pebble accretion only becomes an effective growth mechanism for sizes far larger than 100 km. By the time the outer objects have grown to larger sizes by planetesimal collisions, the pebble flux has largely ceased. Even though the first embryos form earlier in the inner parts of the disk for the simulations in which pebbles are accreted, this trend does not continue to larger distances. The conundrum of distant embryo formation within the lifetime of a radial pebble flux as found in Voelkel et al. (2021) remains. A possible solution to this issue might be locally enhanced substructures in the planetesimal surface density profile at larger distances or the formation of planetesimals that initially form large enough for pebble accretion. Future work may include the formation of planetary embryos in distant local substructures, such as in pressure bumps and around the water-ice line (Drążkowska & Alibert 2017).
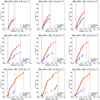 |
Fig. 8 Cumulative number of initial embryos after 1 Myr for the systems from Figs. 2–4. The orange dots refer to the systems in which pebble accretion is disabled, and the blue dots refer to the systems in which pebble accretion is enabled. |
Acknowledgements
We thank Agustin Dugaro for his very constructive and careful review that helped improving this work. R.D. and K.K. acknowledge support from NASA’s Emerging Worlds program. We also wish to thank Kevin Walsh, Hal Levison and Christian Lenz for many fruitful discussions on this project. This research has been supported by the Deutsche Forschungsgemeinschaft Schwerpunktprogramm (DFG SPP) SPP 1992 “Exploring the diversity of extrasolar planets” contract: KL 1469/17-1 Consistent Planetesimal Formation from Pebbles for Synthetic Population Syntheses of Exo-Planets.
References
- Abod, C. P., Simon, J. B., Li, R., et al. 2019, ApJ, 883, 192 [Google Scholar]
- Benz, W., & Asphaug, E. 1999, Icarus, 142, 5 [NASA ADS] [CrossRef] [Google Scholar]
- Birnstiel, T., Dullemond, C. P., & Brauer, F. 2010, A&A, 513, A79 [NASA ADS] [CrossRef] [EDP Sciences] [Google Scholar]
- Birnstiel, T., Klahr, H., & Ercolano, B. 2012, A&A, 539, A148 [NASA ADS] [CrossRef] [EDP Sciences] [Google Scholar]
- Bitsch, B., Lambrechts, M., & Johansen, A. 2015, A&A, 582, A112 [NASA ADS] [CrossRef] [EDP Sciences] [Google Scholar]
- Carter, P. J., Leinhardt, Z. M., Elliott, T., Walter, M. J., & Stewart, S. T. 2015, ApJ, 813, 72 [NASA ADS] [CrossRef] [EDP Sciences] [Google Scholar]
- Clement, M. S., Kaib, N. A., & Chambers, J. E. 2020, Planet. Sci. J., 1, 18 [NASA ADS] [CrossRef] [Google Scholar]
- Deienno, R., Walsh, K. J., Kretke, K. A., & Levison, H. F. 2019, ApJ, 876, 103 [NASA ADS] [CrossRef] [Google Scholar]
- Deienno, R., Walsh, K. J., Levison, H. F., & Kretke, K. A. 2020, ApJ, 890, 170 [NASA ADS] [CrossRef] [Google Scholar]
- Drążkowska, J., & Alibert, Y. 2017, A&A, 608, A92 [NASA ADS] [CrossRef] [EDP Sciences] [Google Scholar]
- Duncan, M. J., Levison, H. F., & Lee, M. H. 1998, AJ, 116, 2067 [NASA ADS] [CrossRef] [EDP Sciences] [Google Scholar]
- Emsenhuber, A., Mordasini, C., Burn, R., et al. 2020a, A&A, submitted [arXiv:2007.05561] [Google Scholar]
- Emsenhuber, A., Mordasini, C., Burn, R., et al. 2020b, A&A, submitted [arXiv:2007.05562] [Google Scholar]
- Hayashi, C. 1981, Prog. Theor. Phys. Suppl., 70, 35 [NASA ADS] [CrossRef] [MathSciNet] [Google Scholar]
- Ida, S., & Lin,D. N. 2004, ApJ, 604, 388 [NASA ADS] [CrossRef] [PubMed] [Google Scholar]
- Johansen, A., Youdin, A., & Mac Low, M.-M. 2009, ApJ, 704, L75 [NASA ADS] [CrossRef] [Google Scholar]
- Klahr, H., & Bodenheimer, P. 2006, ApJ, 639, 432 [NASA ADS] [CrossRef] [Google Scholar]
- Klahr, H., & Schreiber, A. 2020, ApJ, 901, 54 [NASA ADS] [CrossRef] [Google Scholar]
- Kobayashi, H., Tanaka, H., & Krivov, A. V. 2011, ApJ, 738, 35 [NASA ADS] [CrossRef] [Google Scholar]
- Kokubo, E., & Ida, S. 1998, Icarus, 131, 171 [Google Scholar]
- Kretke, K., & Levison, H. 2014, AJ, 148, 109 [NASA ADS] [CrossRef] [Google Scholar]
- Lambrechts, M., & Johansen, A. 2012, A&A, 544, A32 [CrossRef] [EDP Sciences] [Google Scholar]
- Lenz, C. T., Klahr, H., & Birnstiel, T. 2019, ApJ, 874, 36 [CrossRef] [Google Scholar]
- Levison, H. F., Duncan, M. J., & Thommes, E. 2012, AJ, 144, 119 [NASA ADS] [CrossRef] [Google Scholar]
- Levison, H. F., Kretke, K. A., & Duncan, M. J. 2015, Nature, 524, 322 [CrossRef] [Google Scholar]
- Mordasini, C., Alibert, Y., Benz, W., Klahr, H., & Henning, T. 2012, A&A, 541, A97 [NASA ADS] [CrossRef] [EDP Sciences] [Google Scholar]
- Ndugu, N., Bitsch, B., & Jurua, E. 2017, MNRAS, 474, 886 [Google Scholar]
- Ormel, C., & Klahr, H. 2010, A&A, 520, A43 [NASA ADS] [CrossRef] [EDP Sciences] [Google Scholar]
- Pollack, J. B., Hubickyj, O., Bodenheimer, P., et al. 1996, Icarus, 124, 62 [NASA ADS] [CrossRef] [Google Scholar]
- Shakura, N. I., & Sunyaev, R. A. 1973, A&A, 24, 337 [NASA ADS] [Google Scholar]
- Voelkel, O., Klahr, H., Mordasini, C., Emsenhuber, A., & Lenz, C. 2020, A&A, 642, A75 [NASA ADS] [CrossRef] [EDP Sciences] [Google Scholar]
- Voelkel, O., Deienno, R., Kretke, K., & Klahr, H. 2021 A&A, 645, A131 [NASA ADS] [CrossRef] [EDP Sciences] [Google Scholar]
- Walsh, K. J., & Levison, H. F. 2015, DPS, 302 [Google Scholar]
- Walsh, K. J., & Levison, H. F. 2016, AJ, 152, 68 [NASA ADS] [CrossRef] [Google Scholar]
- Walsh, K. J., & Levison, H. F. 2019, Icarus, 329, 88 [NASA ADS] [CrossRef] [Google Scholar]
All Figures
|
Fig. 1 Percentage change of the planetesimal disk mass Ṁdisk, the total disk mass Mdisk, and the radial pebble flux at 5 au. The disk mass (red dots) is normalized by the total disk mass after 106 yr. The green dots indicate the disk-mass increase every 104 yr (Ṁdisk), normalized by the maximum mass change (Ṁdisk, max). The blue dots indicate the pebble flux every 104 yr (Ṁpeb), normalized by the maximum pebble flux (Ṁpeb, max). We find that ~90% of planetesimals have formed within 400 kyr with a peak in the pebble flux at ~75 kyr and another in planetesimal formation at ~115 kyr. |
| In the text | |
|
Fig. 2 Time over semimajor-axis evolution of the N-body simulation in LIPAD. The time and location at which an object has first reached lunar mass is indicated by the black dots in the plot. The subsequent growth of the embryo is tracked and connected with the gray lines, and its mass is given by the color bar. The mass in planetesimals after 1 Myr is given by 6 M⊕ in these runs, the planetesimal surface density slope is varied (ΣP ∝ r−1.0, ΣP ∝ r−1.5, and ΣP∝ r−2.0). Left panels: system without pebble accretion. Right panels: system in which pebble accretion is included. The red line indicates the time after which the analytic model presented in Voelkel et al. (2021) states that embryo formation is possible. |
| In the text | |
|
Fig. 3 Time over semimajor-axis evolution of the N-body simulation in LIPAD. The time and location at which an object has first reached lunar mass is indicated by the black dots in the plot. The subsequent growth of the embryo is tracked and connected with the gray lines, and its mass is given by the color bar. The mass in planetesimals after 1 Myr is given by 13 M⊕ in these runs, the planetesimal surface density slope is varied (ΣP ∝ r−1.0, ΣP ∝ r−1.5 and, ΣP∝ r−2.0). Left panels: system without pebble accretion. Right panels: system in which pebble accretion is included. The red line indicates the time after which the analytic model presented in Voelkel et al. (2021) states that embryo formation is possible. |
| In the text | |
|
Fig. 4 Time over semimajor-axis evolution of the N-body simulation in LIPAD. The time and location at which an object has first reached lunar mass is indicated by the black dots in the plot. The subsequent growth of the embryo is tracked and connected with the grey lines, and its mass is given by the colorbar. The mass in planetesimals after 1 Myr is given by 27 M⊕ in these runs, the planetesimal surface density slope is varied (ΣP ∝ r−1.0, ΣP ∝ r−1.5, and ΣP∝ r−2.0). Left panels: system without pebble accretion. Right panels: system in which pebble accretion is included. The red line indicates the time after which the analytic model presented in Voelkel et al. (2021) states that embryo formation is possible. |
| In the text | |
|
Fig. 5 Embryo masses after 1 Myr for the different parameters from Figs. 2–4. The orange histograms show the systems in which pebble accretion is neglected, and the blue histograms show the systems in which pebble accretion is enabled. |
| In the text | |
|
Fig. 6 Number of active embryos (solid line) and total mass in embryos (dashed line) over time for the systems from Figs. 2–4. The orange curves refer to the systems in which pebble accretion is disabled, whereas the blue lines refer to the systems in which pebble accretion is enabled. We also give the fraction of embryo mass over the total mass that entered the planetesimal disk after 1 Myr (MEmb ∕MD). |
| In the text | |
|
Fig. 7 Orbital separation of active embryos over time from the systems from Figs. 2–4. The orange curves refer to the systems in which pebble accretion is disabled, and the blue curves refer to the systems in which pebble accretion is enabled. The distance is expressed in units of the embryos Hill radii. |
| In the text | |
|
Fig. 8 Cumulative number of initial embryos after 1 Myr for the systems from Figs. 2–4. The orange dots refer to the systems in which pebble accretion is disabled, and the blue dots refer to the systems in which pebble accretion is enabled. |
| In the text | |
Current usage metrics show cumulative count of Article Views (full-text article views including HTML views, PDF and ePub downloads, according to the available data) and Abstracts Views on Vision4Press platform.
Data correspond to usage on the plateform after 2015. The current usage metrics is available 48-96 hours after online publication and is updated daily on week days.
Initial download of the metrics may take a while.