Fig. 6
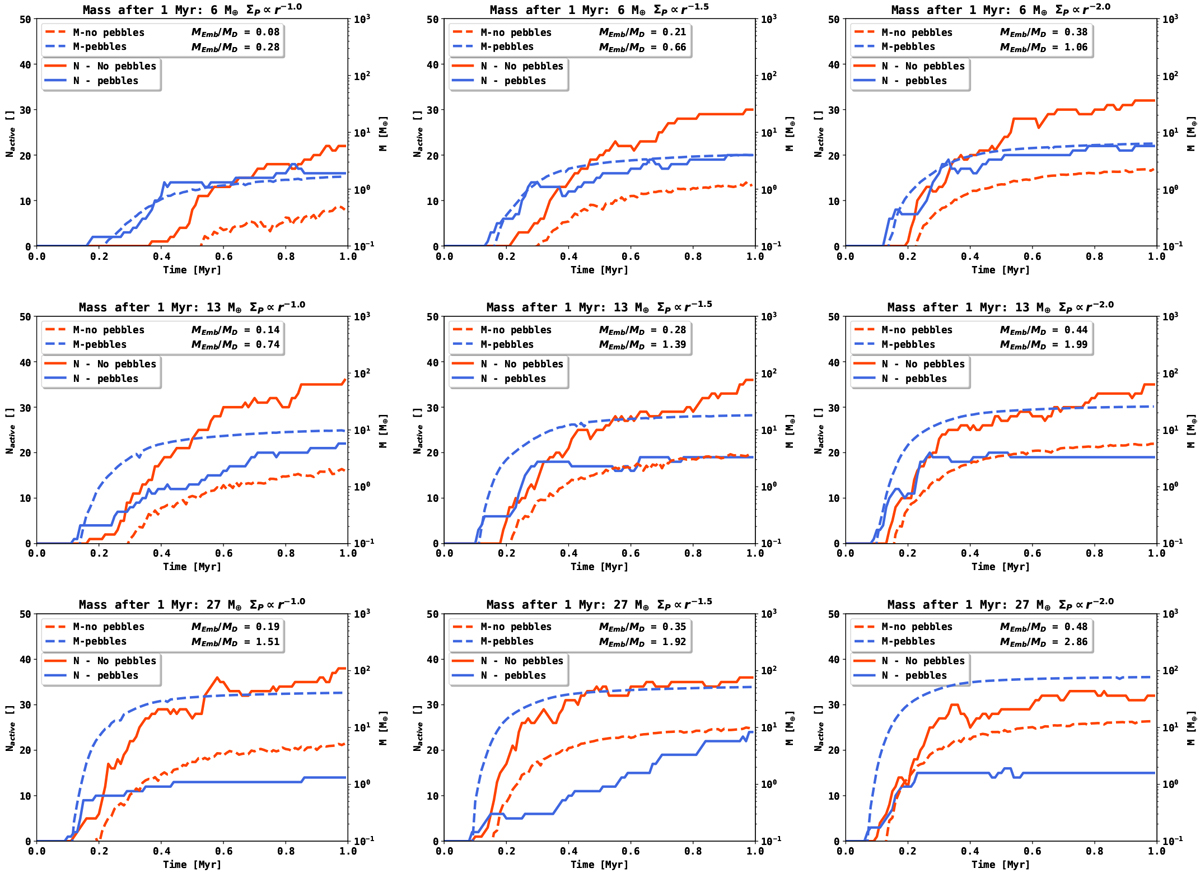
Number of active embryos (solid line) and total mass in embryos (dashed line) over time for the systems from Figs. 2–4. The orange curves refer to the systems in which pebble accretion is disabled, whereas the blue lines refer to the systems in which pebble accretion is enabled. We also give the fraction of embryo mass over the total mass that entered the planetesimal disk after 1 Myr (MEmb ∕MD).
Current usage metrics show cumulative count of Article Views (full-text article views including HTML views, PDF and ePub downloads, according to the available data) and Abstracts Views on Vision4Press platform.
Data correspond to usage on the plateform after 2015. The current usage metrics is available 48-96 hours after online publication and is updated daily on week days.
Initial download of the metrics may take a while.