| Issue |
A&A
Volume 644, December 2020
|
|
|---|---|---|
| Article Number | L7 | |
| Number of page(s) | 7 | |
| Section | Letters to the Editor | |
| DOI | https://doi.org/10.1051/0004-6361/202039593 | |
| Published online | 09 December 2020 | |
Letter to the Editor
The evolution of the gas fraction of quiescent galaxies modeled as a consequence of their creation rate
1
Instituto de Física, Pontificia Universidad Católica de Valparaíso, Casilla 4059, Valparaíso, Chile
e-mail: This email address is being protected from spambots. You need JavaScript enabled to view it.
2
Cosmic Dawn Center (DAWN), Copenhagen, Denmark
3
DTU-Space, Technical University of Denmark, Elektrovej 327, 2800 Kgs. Lyngby, Denmark
4
University of Copenhagen, Jagtvej 128, 2200 Copenhagen N, Denmark
5
CEA, Irfu, DAp, AIM, Université Paris-Saclay, Université de Paris, CNRS, 91191 Gif-sur-Yvette, France
Received:
5
October
2020
Accepted:
16
November
2020
Abstract
We discuss the evolution of the interstellar medium of quiescent galaxies, currently emerging from recent analyses, with the help of a simple model based on well-established empirical relations such as the stellar mass functions and the main sequence of star formation. This model is meant to describe observed quantities without making specific assumptions on the nature of quenching processes, but relying on their observable consequences. We find that the high gas fractions seen or suggested at high redshift in quiescent galaxies, and their apparent mild evolution at early times, can be mostly attributed to a progenitor effect where recently quenched galaxies with ∼10% gas fractions dominate the quiescent galaxy population until z ∼ 1. In the same context, the much lower gas and dust fractions measured in local early-type galaxies are interpreted as the product of the steady depletion of their interstellar medium on a ∼2 Gyr timescale, coupled with a higher fraction of more gas-exhaustive events.
Key words: galaxies: elliptical and lenticular, cD / galaxies: formation / galaxies: ISM
© ESO 2020
1. Introduction
Early-type galaxies (ETGs) are the eventual end product of galaxy evolution and, as such, are overwhelmingly passive systems relative to the overall coeval galaxy population. Consequently, their faint interstellar medium (ISM) has historically received relatively little attention, at least compared to that of star-forming late-type galaxies, except in the local Universe where it is much more easily detectable. This changed recently, following the systematization of mid- and far-infrared (FIR) astronomy that allowed for (and was spurred by) an increased understanding of star formation (SF) in galaxies. The ISM of quiescent galaxies can indeed inform us about the mechanisms mediating the cessation (hereafter, “quenching”) of star formation, since some processes, such as the suppression of gas infall and cooling (e.g., Birnboim & Dekel 2003; Croton et al. 2006) or the gravitational stabilization by galactic spheroids (Martig et al. 2009; Tacchella et al. 2015), are expected to leave untapped reservoirs in these galaxies. Interestingly, the currently emerging picture suggests that, while local ETGs are largely gas-poor (e.g., Young et al. 2011), their higher-redshift counterparts can have gas fractions (Mgas/(M⋆ + Mgas), hereafter fgas) that are higher by a factor 10–100 (Rudnick et al. 2017; Spilker et al. 2018; Gobat et al. 2018, hereafter G18). On the other hand, most studies so far have used samples that were selected ad hoc and, consequently, this inferred evolution does not account for progenitor bias. Here we present a simple model to interpret the observed variation with redshift of the fgas of quiescent galaxies (QGs), which we compared to a collection of constraints from the literature. Section 2 describes the model, Sect. 3 lists the various quiescent and post-starburst (hereafter, “pSB”) galaxy samples used in this work, while we discuss the results of the fit in Sect. 4 and present our conclusions in Sect. 5. We assume a Salpeter (1955) initial mass function (IMF) throughout and a ΛCDM cosmology with H0 = 70 km s−1 Mpc−1, ΩM = 0.3, and ΩΛ = 0.7.
2. Model description
To understand the evolution of the ISM of QGs, we first considered their stellar mass function (MF) Φ(M⋆, z) and its evolution from z > 3 to z ∼ 0. Here we used the Davidzon et al. (2017) MFs, as they currently cover the largest redshift range; for passive galaxies, they are fit up to z = 4, in redshift bins of 0.5 at z > 1.5 and 0.3 below. The rate at which QGs of a given stellar mass M⋆ appear is then given by the derivative of the MF, ∂Φ(M⋆, z)/∂z, which for the purposes of this study we forced to always be either positive or null; that is to say, we neglected rejuvenation in QGs and assumed that their number density can only decrease due to mergers. We computed this numerically, interpolating the MFs to an arbitrarily fine redshift grid for practicality. However, since information on the evolution of the MFs is, in any case, limited by their redshift binning, we did not smooth them to avoid risking inducing spurious behavior. The mean or median observable ⟨ξ⟩ of a QG population can then be modeled as the average of ξ as a function of time, from the beginning of QGs to the epoch of observation, weighted by the QG production rate. At fixed mass M⋆ and redshift z,
 (1)
(1)
depending on the type of data to which the model is compared. Here zmax is the epoch at which the first QGs appear. Given the redshift limit and binning of the MFs, we adopted zmax = 3.5.
For example, Fig. 1 shows the mass- and luminosity-weighted ages of several spectroscopic field QGs samples (Gallazzi et al. 2014; Choi et al. 2014; Mendel et al. 2015; Onodera et al. 2015; Domínguez Sánchez et al. 2016; Gobat et al. 2017; Belli et al. 2019; D’Eugenio et al. 2020), as well as an individual z ∼ 3 QG (Gobat et al. 2012), compared to the average quenching age (i.e., the look-back time to the quenching event) and mass-weighted age predicted by the QG formation rate, two quantities which should bracket the luminosity-weighted age. To compute mass-weighted ages, we used a star formation history (SFH) starting at z = 10 and following the main sequence of star formation (MS, as parameterized by Sargent et al. 2014) until truncation (see, e.g., Mendel et al. 2015, for a similar approach). The predicted ages follow the observed trend, reproducing the dynamic range of ages at z ∼ 0 reasonably well (Thomas et al. 2005), but somewhat under-predicting their spread at z > 1 (e.g., Bedregal et al. 2013; Zanella et al. 2016). However, we note that ages derived from observations using non-MS SFHs, such as exponentially-declining ones, can be significantly higher than those assuming a truncated MS SFH. Conversely, high-redshift massive QGs might have followed super-MS paths prior to quenching (e.g., Valentino et al. 2020).
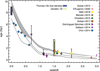 |
Fig. 1. Average mass-weighted age and time since quenching (gray and dotted regions, respectively) of QGs with log(M/M⊙) = 10.5 − 11.5 predicted by the QG formation rate, compared to various field samples of ∼1011 M⊙ QGs. Black-rimmed symbols indicate luminosity-weighted ages, while un-rimmed ones show mass-weighted ages. The dark blue and cream rectangles show the age spread predicted from the empirical age − M⋆ relations of Thomas et al. (2005) and Zanella et al. (2016), respectively. |
In this analysis, we assumed that the cessation of star formation in galaxies can happen through either a “slow” (s) or a “fast” (f) channel, the latter of which we identified with major dissipative mergers (e.g., Schawinski et al. 2014). However, aside from the existence of these two channels, we did not posit any specific quenching mechanisms nor, for example, whether the transition from star formation to quiescence happened suddenly or in a more gradual way (e.g., Gutke et al. 2017). The model’s second main assumption is that all newly-quenched galaxies start their quiescent evolution with the same initial gas fraction, fg, 0, s or fg, 0, f, depending on their quenching channel. We assumed two hypothetical cases for this initial gas fraction: in the first “constant” case, fg, 0 does not depend on redshift; whereas in the second “fractional” case, it is a fixed percentage of the evolving molecular gas fraction of the MS fg, MS(M⋆, z). In this second case, we adopted the fg, MS parameterization of Sargent et al. (2014, hereafter S14). Thirdly, we let the remaining gas mass Mg be depleted (either consumed or expelled), without replenishment at a rate Ψ inversely proportional to a time tdep. The gas mass of a QG at time t after quenching is therefore
 (2)
(2)
which we solved numerically in time steps. The initial gas mass immediately after quenching is defined as Mg(0) = M⋆(0)fg, 0/(1 − fg, 0), while  is the gas mass lost within time t due an unspecified process with rate Ψ. The gas fraction at time t after quenching is then
  , with
  being the change in stellar mass within time t. If gas depletion is due to star formation,
  , where
  accounts for stellar death and depends on past star formation and the IMF. If gas is depleted by other processes,
  . Here we chose to keep
  , both for simplicity and so as to not make assumptions regarding the physical processes responsible for the gradual depletion of the remaining gas and dust in QGs. Furthermore, it is not known how much of the gas in high-redshift galaxies is in the molecular phase. In addition, whether or not Ψ arises from star formation makes little to no difference at our current level of precision, with either alternative yielding very similar fgas(t) values (see Sect. 4).
In the case of pSB galaxies, which are not age-composite populations, we only considered the aforementioned gas depletion, starting (somewhat arbitrarily) within t ≤ 500 Myr of the epoch of observation and assuming an initial gas fraction of fg, 0, s. For true QGs, on the other hand, gas depletion must be computed for every possible epoch from zmax to the redshift of observation, for both fg, 0, s and fg, 0, f, and combined with both the QG formation rate and major merger rate per descendant galaxy. To parameterize the latter, we used the fitting function of Rodriguez-Gomez et al. (2016):
![Mathematical equation: $$ \begin{aligned} \frac{\mathrm{d} n_{\mathrm{merg}}}{\mathrm{d} \mu \mathrm{d} t} = A(z)\left(\frac{M_{\star }}{10^{10}\,M_{\odot }}\right)^{\alpha (z)}\left[1+\left(\frac{M_{\star }}{M_0}\right)^{\delta (z)}\right]\mu ^{\beta (z)+\gamma \,\log \left(\frac{M_{\star }}{10^{10}\,M_{\odot }}\right)} \mathrm{,} \end{aligned} $$](/articles/aa/full_html/2020/12/aa39593-20/aa39593-20-eq10.gif) (3)
(3)
where μ is the mass ratio, for which we assumed that a cut-off value of μmin = 1/3, M⋆ is the descendant mass, M0 = 2 × 10¹¹ M⊙, and the redshift dependence of parameters α, β, and δ is of the kind X(z) = x0(1 + z)x1, using the values of xi given in that paper. The ⟨fgas⟩ of a population of QGs with stellar mass M⋆ at redshift z is then the weighted average (mean or median, depending on the data to which it is compared) of
 (4)
(4)
between z′ = z and z′ = zmax, as defined in Eq. (1). A schematic representation of the model is shown in Appendix A.
3. Gas samples
As in G18, we compiled existing constraints on the molecular gas fraction fgas of quiescent and pSB galaxies from recent literature, namely: local QGs consisting of the ATLAS3D (Young et al. 2011; Cappellari et al. 2013; Davis et al. 2014) and HRS (Boselli et al. 2014; Lianou et al. 2016) ETG samples as well as the samples of pSB galaxies (hereafter, the “low-z pSB” sample) of French et al. (2015) and Alatalo et al. (2016); at low and intermediate redshift, the ETG sample of Spilker et al. (2018) and the pSB sample of Suess et al. (2017); at intermediate and high redshift, constraints from Hayashi et al. (2018) on gas in z ∼ 1.46 cluster ETGs, as well as on individual galaxies from Sargent et al. (2015), Bezanson et al. (2019), and Rudnick et al. (2017). Given its size, we divided the ATLAS3D sample into high- and low-mass subsamples, choosing 5 × 10¹⁰ M⊙ as the cut-off mass. In addition, we also included fgas estimates derived from the (median) stacked FIR spectral energy distributions of ETGs at z ∼ 1.8 (G18; 977 galaxies), z ∼ 1.2, z ∼ 0.8, and z ∼ 0.5 (1394, 1536, and 563 galaxies, respectively; Magdis et al. 2020, hereafter M20). Finally, at higher redshift (z ∼ 3), we converted star formation rates (SFR) estimated from spectroscopy (Schreiber et al. 2018a; D’Eugenio et al. 2020) into gas masses assuming the star formation efficiency found by G18. As a consequence of our zmax = 3.5, we did not include higher-redshift quiescent galaxies (Glazebrook et al. 2017; Schreiber et al. 2018b; Tanaka et al. 2019; Valentino et al. 2020) in the analysis and considered z ∼ 3 galaxies as pSB. The dust-based estimates of G18 and M20 (and, by extension, the z ∼ 3 semi-constraints) assume a gas-to-dust ratio (G/D). It is dependent on metallicity, which is presumed to be solar or higher owing to both the relatively high gas-phase metallicity of MS galaxies at z ≲ 1 (e.g., Mannucci et al. 2010) and the already high stellar metallicities of QGs at z > 1 (Onodera et al. 2015; Estrada-Carpenter et al. 2019). Here we adopted an intermediate value between the solar and supersolar G/Ds used in M20, and we increased the error bars of these points to include both the solar and supersolar confidence estimates. These various samples, which are summarized with their selection criteria in Table B.1, combine into a nonhomogeneous dataset: some were specifically selected as ETGs, and others were based on varying degrees of quiescence. In particular, pSB galaxies are not necessarily truly quiescent and could, in principle, resume normal star formation. However, as a possible precursor of QGs, they provide useful, though not constraining (see Sect. 4), comparison samples for the model. Here we refer to all equally as either QGs or pSB galaxies, and we make the assumption that, on average, these different samples are not otherwise significantly biased with regard to their gas content compared to the full population, given each mass limit and type.
Model gas fractions were then computed, as described in Sect. 2, for each sample according to its median mass and redshift. All samples and subsamples were fit together with no distinction for their median mass, as there is currently not enough statistics for a mass-specific fit. We let fg, 0, s and fg, 0, f vary from 0 to 0.5 – that is to say about the MS value at z ∼ 2 – in steps of Δfg, 0 = 0.01. We also allowed tdep to vary from 0.1 to 8 Gyr with Δtdep = 100 Myr1. These values were then fit, via χ2 minimization, to the median fgas and scatter of each sample to mitigate the effect of outliers. In each case, the residuals were multiplied by the number of objects in the sample. Samples which contain both detections and non-detections were each split in two subsamples of detected and non-detected objects, respectively, using 3σ upper limits for the latter. In this case, and for galaxies explicitly selected or identified as pSB (i.e., with estimated ages ≤500 Myr), we adopted a data censoring approach where the model could take any value of fgas(t) within the 3σ limit and the t ≤ 500 Myr range, respectively.
4. Results and discussion
Both the constant and fractional models reproduce the apparent evolution of existing constraints within their uncertainties (Fig. 2). At z ≳ 1, the evolution of ⟨fgas⟩ is mostly driven by the QG formation rate and the gas fraction is kept relatively high by the steady emergence of newly quenched galaxies (see Appendix C). Some fluctuations are present, which are a consequence of the redshift binning of the MFs used to compute the model. At lower redshift, the high-mass end of the QG MF changes only slightly and the remaining gas gets steadily depleted. As a consequence of this difference in the formation rate between high- and lower-mass QGs, their respective ⟨fgas⟩ tracks start diverging which, at z ∼ 0, causes an anticorrelation between the gas and stellar masses of QGs, as seen in the data (Fig. 3).
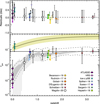 |
Fig. 2. Bottom panel: evolution of the ⟨fgas⟩ of quiescent galaxies as a function of redshift. The various symbols with error bars or upper-limit arrows show the median fgas of the QG and pSB samples. The solid and hatched light gray regions trace the envelope of the best-fit models with constant fg, 0, within the range of median stellar masses of the samples, and its predicted 1σ scatter, respectively. The dark dashed gray lines show the best-fit envelope for the fractional case model and the horizontal black line shows the best-fit fg, 0, s for the constant case model. For comparison, the evolution of fgas of 5 × 10¹⁰ M⊙ MS galaxies, as parameterized by S14, is shown as a tan line and its scatter envelope is shown as a solid cream region. Top panel: median residuals of the fits with constant and fractional fg, 0 (solid and clear symbols, respectively, the latter having been offset for clarity) for the same samples. The error bars show the dispersion of residuals. Smaller symbols (Sargent et al. 2015; Rudnick et al. 2017; Bezanson et al. 2019) indicate single objects. |
The model fit is relatively robust with respect to the samples used, with ⟨fgas⟩∼0.1 varying by less than 0.3 dex when only fitting part of the sample (e.g., only local galaxies or only intermediate-to-high redshift ones; see Appendix D). We also find that choosing different MFs does not appreciably affect the best-fit parameters (e.g., Ilbert et al. 2013, who derived them from a larger but shallower survey area). In all cases, the resulting models stay well within the uncertainties of the data. It is therefore interesting to note that the putative gas fractions of z ∼ 3 ETGs, which we have speculatively estimated here from emission-line SFRs, appear to be consistent with the predictions of the model. This suggests in turn that the star formation efficiency of quiescent galaxies might not have changed much between z ∼ 3 and z ∼ 1.8.
Table 1 shows the best-fit parameters in the constant and fractional cases for two different instances: one where the initial gas fraction of fast-quenched QGs was fixed to fg, 0, f = 0 and another where it was let to vary freely. Both models fall well within the uncertainties of the constraints, despite being based on different assumptions. This is likely a consequence of the evolution of fg, MS being rather shallow, compared to the trend seen in QGs, in particular at z > 1 where the majority of massive QGs formed. However, while the constant case is also consistent with the relatively large gas fractions seen in local pSB galaxies (French et al. 2015; Alatalo et al. 2016), the fractional model underpredicts them by a factor of ∼10. The depletion time suggested by the former is also similar to that estimated for intermediate-age pSB galaxies (Rowlands et al. 2015) and intermediate- to high-redshift ETGs (G18, M20), while being slightly higher than that of local gas-rich ETGs (Young et al. 2011; Davis et al. 2014). We note that, given the relatively low fg, 0 of QGs, their stellar mass at z ∼ 0 would not change much whether the gas were fully converted into stars or exhausted through other processes. Moreover, assuming that gas depletion is due to star formation would not change the fit or its parameters significantly (see Fig. D.1) since the depletion time is constrained by the evolution of fgas at z < 1, while the ratio between fg, 0 and tdep is constrained by the overall data. At the current level of precision of the data, the model is therefore not reliant on a specific depletion mechanism and our results do not change if gas, rather than being consumed, is expelled from galaxies on the same timescale for example. Indeed, the tdep we find for the constant case is comparable to the timescale of dust removal found in low-redshift ETGs (Michałowski et al. 2019), a process that does not necessarily involve star formation.
Best-fit parameters
On the other hand, local massive MS galaxies tend to have fgas ∼ 0.1 − 0.2, while not being ostensibly on the cusp of becoming quiescent (e.g., Leroy et al. 2009, 2013), hence a gas fraction of ≤fg, 0, s is not likely to be a sufficient condition for quenching. The cessation of star formation in a galaxy can clearly be mediated by a variety of mechanisms, some of which might not be adequately represented by either of the quenching channels that this intentionally simple model considers (e.g., environmentally-driven ones). Additionally, we did not account for post-quenching mergers, which can either somewhat increase a QG’s mass while keeping it quiescent or rejuvenate it via gas reaccretion, corresponding to dry and dry-wet mergers, respectively. At the end of each episode, the resulting object would be treated as newly quenched by our model. However, its gas content would likely be substantially different from that of pSB galaxies. In particular, we should expect dry merger remnants to be even more gas-depleted than noninteracting QGs (see, e.g., Bassett et al. 2017); while in its present state, our model would assign a higher fgas to them. This is illustrated by the different behavior at > 3 × 10¹¹ M⊙ of tracks with fixed and varying fg, 0, f (Fig. 3). Finally, even rejuvenated QGs are typically identified as sub-MS (Chauke et al. 2019; Mancini et al. 2019). Model predictions might therefore substantially deviate from observations for galaxy populations where these processes play a significant role.
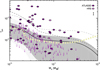 |
Fig. 3. Gas fraction of z ∼ 0 ETGs in the ATLAS3D and HRS samples, as a function of stellar mass. Colored ellipses indicate detections (a typical error bar is shown in the upper right corner), and downward-pointing arrows indicate the 3σ upper limits of non-detections. The solid light-gray and hatched dark-gray regions correspond to constant and fractional-case models with fg, 0, f = 0, respectively, within the 1σ confidence interval of their respective fits. The dashed lines show the 1σ scatter in fgas predicted by the models, with respect to the best fit, shown here as a solid line. On the other hand, the best-fit model for the constant case and varying fg, 0, f is shown as a thick cream dashed line. |
5. Conclusions
We have constructed a simple model to interpret the apparent evolution of the ISM in QGs. It assumes that galaxies can quench through two different channels, one of which is related to major merging events, and that no ISM replenishment takes place after quenching. On the other hand, we make no further suppositions otherwise as to the physical processes involved in either quenching the galaxies or keeping them quiescent. A comparison with recent constraints suggests that quiescent galaxies begin their passive evolution with non-negligible amounts of gas left, fgas, 0 ∼ 0.1, which is progressively depleted with a timescale of 1.5 − 2.5 Gyr. At early times, the average gas fraction of the QG population is kept relatively high by newly quenched galaxies. Below z ∼ 1, on the other hand, the formation rate of massive QGs drops dramatically and, as this population grows older, its average fgas decreases slowly.
However, conclusively distinguishing between different possible cases for the initial gas fraction would require more complete datasets than are currently available. Likewise, a more sophisticated treatment of quenching channels and their associated consumption might be warranted once the quiescent galaxy population has been more finely sampled in redshift, mass, and environment. Nevertheless, this present analysis shows that the emerging trends in the evolution of gas in quiescent galaxies can already be broadly explained using a minimal number of assumptions. This suggests that, as with star forming galaxies, the mechanisms regulating the ISM content of quiescent galaxies operate consistently over most of the history of the Universe.
The model grid is publicly available at www.georgiosmagdis.com/software/
Acknowledgments
We thank I. Davidzon for fruitful discussions and the anonymous referee for their help in improving this letter. GEM and FV acknowledge the Villum Fonden research grant 13160 “Gas to stars, stars to dust: tracing star formation across cosmic time” and the Cosmic Dawn Center of Excellence funded by the Danish National Research Foundation under then grant No. 140. FV acknowledges support from the Carlsberg Foundation research grant CF18-0388 “Galaxies: Rise And Death”.
References
- Alatalo, K., Lisenfeld, U., Lanz, L., et al. 2016, ApJ, 827, 106 [NASA ADS] [CrossRef] [Google Scholar]
- Bassett, R., Bekki, K., Cortese, L., et al. 2017, MNRAS, 470, 1991 [NASA ADS] [CrossRef] [Google Scholar]
- Bedregal, A. G., Scarlata, C., Henry, A. L., et al. 2013, ApJ, 778, 126 [NASA ADS] [CrossRef] [Google Scholar]
- Belli, S., Newman, A. B., & Ellis, R. S. 2019, ApJ, 874, 17 [CrossRef] [Google Scholar]
- Bezanson, R., Spilker, J., Williams, C. C., et al. 2019, ApJ, 873, L19 [NASA ADS] [CrossRef] [Google Scholar]
- Birnboim, Y., & Dekel, A. 2003, MNRAS, 345, 349 [NASA ADS] [CrossRef] [Google Scholar]
- Boselli, A., Cortese, L., Boquien, M., et al. 2014, A&A, 564, A66 [NASA ADS] [CrossRef] [EDP Sciences] [Google Scholar]
- Cappellari, M., McDermid, R. M., Alatalo, K., et al. 2013, MNRAS, 432, 1862 [NASA ADS] [CrossRef] [Google Scholar]
- Chauke, P., van der Wel, A., Pacifici, C., et al. 2019, ApJ, 877, 48 [NASA ADS] [CrossRef] [Google Scholar]
- Choi, J., Conroy, C., Moustakas, J., et al. 2014, ApJ, 792, 95 [NASA ADS] [CrossRef] [Google Scholar]
- Croton, D. J., Springel, V., Whilte, S. D. M., et al. 2006, MNRAS, 365, 11 [NASA ADS] [CrossRef] [Google Scholar]
- Davidzon, I., Ilbert, O., Laigle, C., et al. 2017, A&A, 605, A70 [NASA ADS] [CrossRef] [EDP Sciences] [Google Scholar]
- Davis, T. A., Young, L. M., Crocker, A. F., et al. 2014, MNRAS, 444, 3427 [NASA ADS] [CrossRef] [Google Scholar]
- D’Eugenio, C., Daddi, E., Gobat, R., et al. 2020, ApJ, 892, L2 [CrossRef] [Google Scholar]
- Domínguez Sánchez, H., Pérez-González, P. G., Esquej, P., et al. 2016, MNRAS, 457, 3743 [NASA ADS] [CrossRef] [Google Scholar]
- Estrada-Carpenter, V., Papovich, C., Momcheva, I., et al. 2019, ApJ, 870, 133 [NASA ADS] [CrossRef] [Google Scholar]
- French, K. D., Yang, Y., Zabludoff, A., et al. 2015, ApJ, 801, 1 [NASA ADS] [CrossRef] [Google Scholar]
- Gallazzi, A., Bell, E., Zibetti, S., Brinchmann, J., & Kelson, D. D. 2014, ApJ, 778, 72 [NASA ADS] [CrossRef] [Google Scholar]
- Glazebrook, K., Schreiber, C., Labbé, I., et al. 2017, Nature, 544, 71 [NASA ADS] [CrossRef] [Google Scholar]
- Gobat, R., Strazzullo, V., Daddi, E., et al. 2012, ApJ, 759, L44 [NASA ADS] [CrossRef] [Google Scholar]
- Gobat, R., Daddi, E., Strazzullo, V., et al. 2017, A&A, 599, A95 [NASA ADS] [CrossRef] [EDP Sciences] [Google Scholar]
- Gobat, R., Daddi, E., Magdis, G., et al. 2018, Nat. Astron., 2, 239 [NASA ADS] [CrossRef] [Google Scholar]
- Gutke, T. A., Macciò, A. V., Dutton, A. A., & Stinson, G. S. 2017, MNRAS, 466, 4614 [Google Scholar]
- Hayashi, M., Tadaki, K., Kodama, T., et al. 2018, ApJ, 856, 118 [NASA ADS] [CrossRef] [Google Scholar]
- Ilbert, O., McCracken, H. J., Le Fèvre, O., et al. 2013, A&A, 556, A55 [NASA ADS] [CrossRef] [EDP Sciences] [Google Scholar]
- Leroy, A. K., Walter, F., Bigiel, F., et al. 2009, AJ, 137, 4670 [NASA ADS] [CrossRef] [Google Scholar]
- Leroy, A. K., Walter, F., Sandstrom, K., et al. 2013, AJ, 146, 19 [Google Scholar]
- Lianou, S., Xilouris, E., Madden, S. C., & Barmby, P. 2016, MNRAS, 461, 2856 [NASA ADS] [CrossRef] [Google Scholar]
- Magdis, G., Gobat, R., Valentino, F., et al. 2020, A&A, submitted [Google Scholar]
- Mancini, C., Daddi, E., Juneau, S., et al. 2019, MNRAS, 489, 1265 [CrossRef] [Google Scholar]
- Mannucci, F., Cresci, G., Maiolino, R., Marconi, A., & Gnerucci, A. 2010, MNRAS, 408, 2115 [NASA ADS] [CrossRef] [Google Scholar]
- Martig, M., Bournaud, F., Teyssier, R., & Dekel, A. 2009, ApJ, 707, 250 [NASA ADS] [CrossRef] [Google Scholar]
- Mendel, J. T., Saglia, R. P., Bender, R., et al. 2015, ApJ, 804, L4 [NASA ADS] [CrossRef] [Google Scholar]
- Michałowski, M. J., Hjorth, J., Gall, C., et al. 2019, A&A, 632, A43 [CrossRef] [EDP Sciences] [Google Scholar]
- Onodera, M., Carollo, C. M., Renzini, A., et al. 2015, ApJ, 808, 161 [NASA ADS] [CrossRef] [Google Scholar]
- Rodriguez-Gomez, V., Pillepich, A., Sales, L. V., et al. 2016, MNRAS, 458, 2371 [NASA ADS] [CrossRef] [Google Scholar]
- Rowlands, K., Wild, V., Nesvadba, N., et al. 2015, MNRAS, 448, 258 [NASA ADS] [CrossRef] [Google Scholar]
- Rudnick, G., Hodge, J., Walter, F., et al. 2017, ApJ, 849, 27 [NASA ADS] [CrossRef] [Google Scholar]
- Salpeter, E. E. 1955, ApJ, 121, 161 [Google Scholar]
- Sargent, M. T., Daddi, E., Béthermin, M., et al. 2014, ApJ, 793, 19 [NASA ADS] [CrossRef] [Google Scholar]
- Sargent, M. T., Daddi, E., Bournaud, F., et al. 2015, ApJ, 806, L20 [NASA ADS] [CrossRef] [Google Scholar]
- Schawinski, K., Urry, C. M., Simmons, B. D., et al. 2014, MNRAS, 440, 889 [NASA ADS] [CrossRef] [Google Scholar]
- Schreiber, C., Glazebrook, K., Nanayakkara, T., et al. 2018a, A&A, 618, A85 [NASA ADS] [CrossRef] [EDP Sciences] [Google Scholar]
- Schreiber, C., Labbé, I., Glazebrook, K., et al. 2018b, A&A, 611, A22 [NASA ADS] [CrossRef] [EDP Sciences] [Google Scholar]
- Spilker, J., Bezanson, R., & Bariić, I. 2018, ApJ, 860, 103 [NASA ADS] [CrossRef] [Google Scholar]
- Suess, K. A., Bezanson, R., Spilker, J., et al. 2017, ApJ, 846, L14 [NASA ADS] [CrossRef] [Google Scholar]
- Tacchella, S., Carollo, C. M., Renzini, A., et al. 2015, Science, 348, 314 [NASA ADS] [CrossRef] [Google Scholar]
- Tanaka, M., Valentino, F., Toft, S., et al. 2019, ApJ, 885, L34 [Google Scholar]
- Thomas, D., Maraston, C., Bender, R., & de Mens Oliveira, C. 2005, ApJ, 621, 673 [NASA ADS] [CrossRef] [Google Scholar]
- Valentino, F., Tanaka, M., Davidzon, I., et al. 2020, ApJ, 889, 93 [Google Scholar]
- Young, L. M., Bureau, M., Davis, T. A., et al. 2011, MNRAS, 414, 940 [NASA ADS] [CrossRef] [Google Scholar]
- Zanella, A., Scarlata, C., Corsini, E. M., et al. 2016, ApJ, 824, 68 [CrossRef] [Google Scholar]
Appendix A: Scheme of the model
In Fig. A.1 we show a schematic representation of our model, with its two conditional paths. For pSB samples, we assume that quenching occurred within the last 500 Myr and allow for any gas fraction predicted by Eq. (2) within that time; on the other hand, the fgas of a general QG population is a composite weighted by the QG formation rate and the major merger rate.
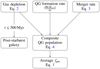 |
Fig. A.1. Schematic representation of the QG gas evolution model. |
Appendix B: Quiescent galaxy samples
In Table B.1 we list the various QG and pSB samples used in this analysis. We include the following information: the number of objects in each sample or subsample (N), its redshift range, median stellar mass, median fgas, the type of objects it contains (whether quiescent or post-starburst), and the principal selection criterion. For the latter, we consider selection on the basis of early-type morphology (“morphology”), absorption or emission features in their spectra (“spectrum”), their distance to the MS (“sSFR”), or color-color criteria (“color”). However, this does not include additional refinements to the selection criterion, such as mid-IR non-detection for color-selected QGs (e.g., G18 and M20). As described in Sect. 3, samples have been split into detections and 3σ upper limits when appropriate.
Quiescent and post-starburst galaxy samples.
Appendix C: Quiescent galaxy formation rate
In Fig. C.1 we show the fraction of pSB galaxies (i.e., galaxies quenched within the last 500 Myr) predicted by the Davidzon et al. (2017) MFs, as a function of redshift and for a stellar mass of 2 × 10¹¹ M⊙. Most of the QG population at z > 1 is therefore expected to be newly-quenched, while at z ≲ 0.5 the fraction of 2 × 10¹¹ M⊙ pSB is expected to be negligible.
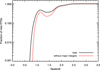 |
Fig. C.1. Smoothed evolution of the fraction of ≤500 Myr 2 × 10¹¹ M⊙ QGs as a function of redshift (dark curve). The red dotted curve shows the pSB fraction after subtracting the descendants of major mergers (i.e., with mass ratios μ ≥ 1/3). |
Appendix D: Subsample fits
To test the dependency of our modeling to the various QG and pSB samples, we performed a series of tests where the model was fit to only part of the full set of constraints. We considered the following subsets: one that only contains local QGs (i.e., the ATLAS3D and HRS samples); one with only intermediate-to-high redshift samples, ignoring the local QG and pSB samples; one which excludes pSB galaxies (i.e., which contains only QG samples); one with only “direct” detections and constraints, excluding the constraints derived from FIR SED fitting (i.e., G18, M20, and higher-z QGs). Finally, we also carried out a fit of the full sample assuming that gas depletion in QGs is due to star formation. We find that the model tracks stay within a factor of 2–3 of each other, with the largest deviation occurring at z = 0 between the full-set fit and the nonlocal one, the latter predicting slightly higher fgas; although, it is still consistent with local QG values.
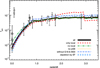 |
Fig. D.1. ⟨fgas⟩ evolution when fitting all data points, as in Fig. 2 (thick black curve), only local objects (dashed red curve), only intermediate-to-high redshift galaxies (green dash-dot-dotted curve), or ignoring either pSB galaxies (dotted yellow curve) or dust-derived constraints (G18 and M20; dash-dotted blue curve). For comparison, the best-fit model with SF gas depletion is shown as a thick dashed light-blue line. The tracks shown here are for a 1.5 × 10¹¹ M⊙ QG, while the gray points show the various samples used, as in Fig. 2. |
All Tables
All Figures
|
Fig. 1. Average mass-weighted age and time since quenching (gray and dotted regions, respectively) of QGs with log(M/M⊙) = 10.5 − 11.5 predicted by the QG formation rate, compared to various field samples of ∼1011 M⊙ QGs. Black-rimmed symbols indicate luminosity-weighted ages, while un-rimmed ones show mass-weighted ages. The dark blue and cream rectangles show the age spread predicted from the empirical age − M⋆ relations of Thomas et al. (2005) and Zanella et al. (2016), respectively. |
| In the text | |
|
Fig. 2. Bottom panel: evolution of the ⟨fgas⟩ of quiescent galaxies as a function of redshift. The various symbols with error bars or upper-limit arrows show the median fgas of the QG and pSB samples. The solid and hatched light gray regions trace the envelope of the best-fit models with constant fg, 0, within the range of median stellar masses of the samples, and its predicted 1σ scatter, respectively. The dark dashed gray lines show the best-fit envelope for the fractional case model and the horizontal black line shows the best-fit fg, 0, s for the constant case model. For comparison, the evolution of fgas of 5 × 10¹⁰ M⊙ MS galaxies, as parameterized by S14, is shown as a tan line and its scatter envelope is shown as a solid cream region. Top panel: median residuals of the fits with constant and fractional fg, 0 (solid and clear symbols, respectively, the latter having been offset for clarity) for the same samples. The error bars show the dispersion of residuals. Smaller symbols (Sargent et al. 2015; Rudnick et al. 2017; Bezanson et al. 2019) indicate single objects. |
| In the text | |
|
Fig. 3. Gas fraction of z ∼ 0 ETGs in the ATLAS3D and HRS samples, as a function of stellar mass. Colored ellipses indicate detections (a typical error bar is shown in the upper right corner), and downward-pointing arrows indicate the 3σ upper limits of non-detections. The solid light-gray and hatched dark-gray regions correspond to constant and fractional-case models with fg, 0, f = 0, respectively, within the 1σ confidence interval of their respective fits. The dashed lines show the 1σ scatter in fgas predicted by the models, with respect to the best fit, shown here as a solid line. On the other hand, the best-fit model for the constant case and varying fg, 0, f is shown as a thick cream dashed line. |
| In the text | |
|
Fig. A.1. Schematic representation of the QG gas evolution model. |
| In the text | |
|
Fig. C.1. Smoothed evolution of the fraction of ≤500 Myr 2 × 10¹¹ M⊙ QGs as a function of redshift (dark curve). The red dotted curve shows the pSB fraction after subtracting the descendants of major mergers (i.e., with mass ratios μ ≥ 1/3). |
| In the text | |
|
Fig. D.1. ⟨fgas⟩ evolution when fitting all data points, as in Fig. 2 (thick black curve), only local objects (dashed red curve), only intermediate-to-high redshift galaxies (green dash-dot-dotted curve), or ignoring either pSB galaxies (dotted yellow curve) or dust-derived constraints (G18 and M20; dash-dotted blue curve). For comparison, the best-fit model with SF gas depletion is shown as a thick dashed light-blue line. The tracks shown here are for a 1.5 × 10¹¹ M⊙ QG, while the gray points show the various samples used, as in Fig. 2. |
| In the text | |
Current usage metrics show cumulative count of Article Views (full-text article views including HTML views, PDF and ePub downloads, according to the available data) and Abstracts Views on Vision4Press platform.
Data correspond to usage on the plateform after 2015. The current usage metrics is available 48-96 hours after online publication and is updated daily on week days.
Initial download of the metrics may take a while.