Fig. 1.
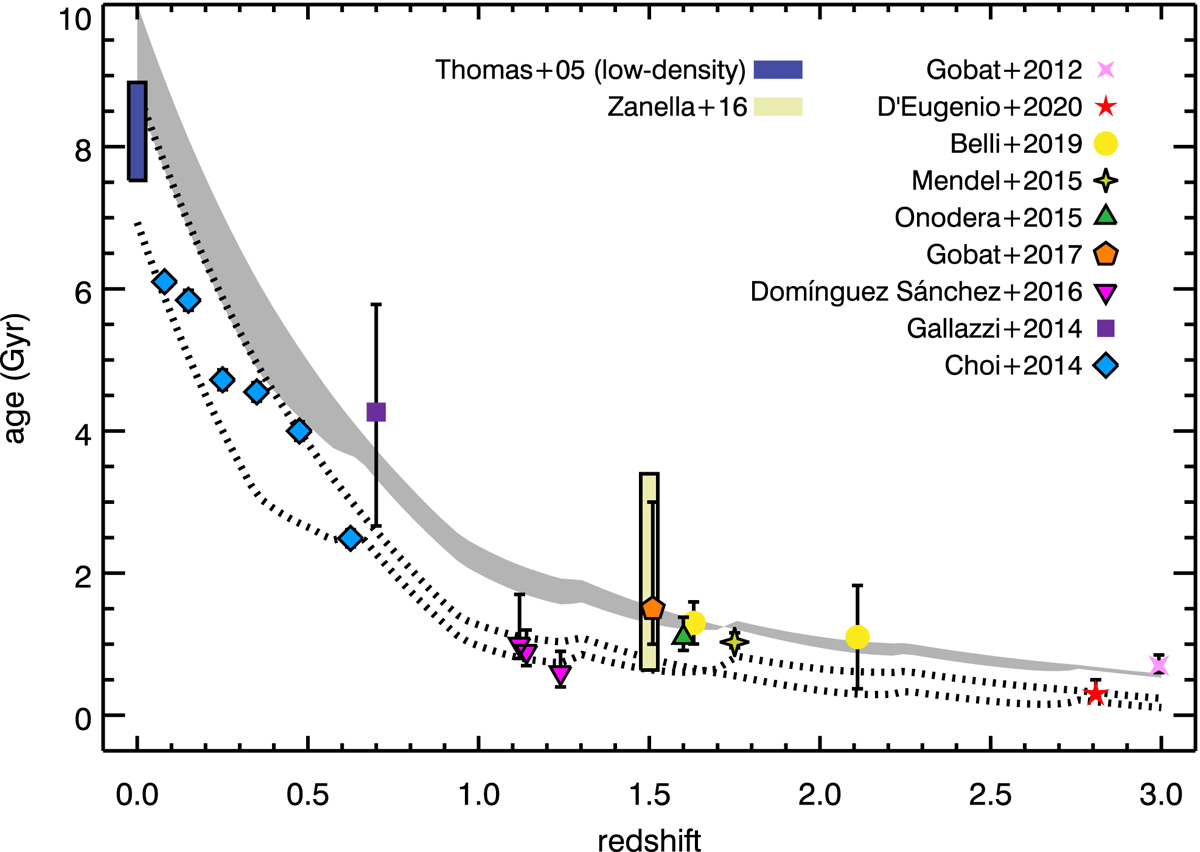
Average mass-weighted age and time since quenching (gray and dotted regions, respectively) of QGs with log(M/M⊙) = 10.5 − 11.5 predicted by the QG formation rate, compared to various field samples of ∼1011 M⊙ QGs. Black-rimmed symbols indicate luminosity-weighted ages, while un-rimmed ones show mass-weighted ages. The dark blue and cream rectangles show the age spread predicted from the empirical age − M⋆ relations of Thomas et al. (2005) and Zanella et al. (2016), respectively.
Current usage metrics show cumulative count of Article Views (full-text article views including HTML views, PDF and ePub downloads, according to the available data) and Abstracts Views on Vision4Press platform.
Data correspond to usage on the plateform after 2015. The current usage metrics is available 48-96 hours after online publication and is updated daily on week days.
Initial download of the metrics may take a while.