Fig. 2.
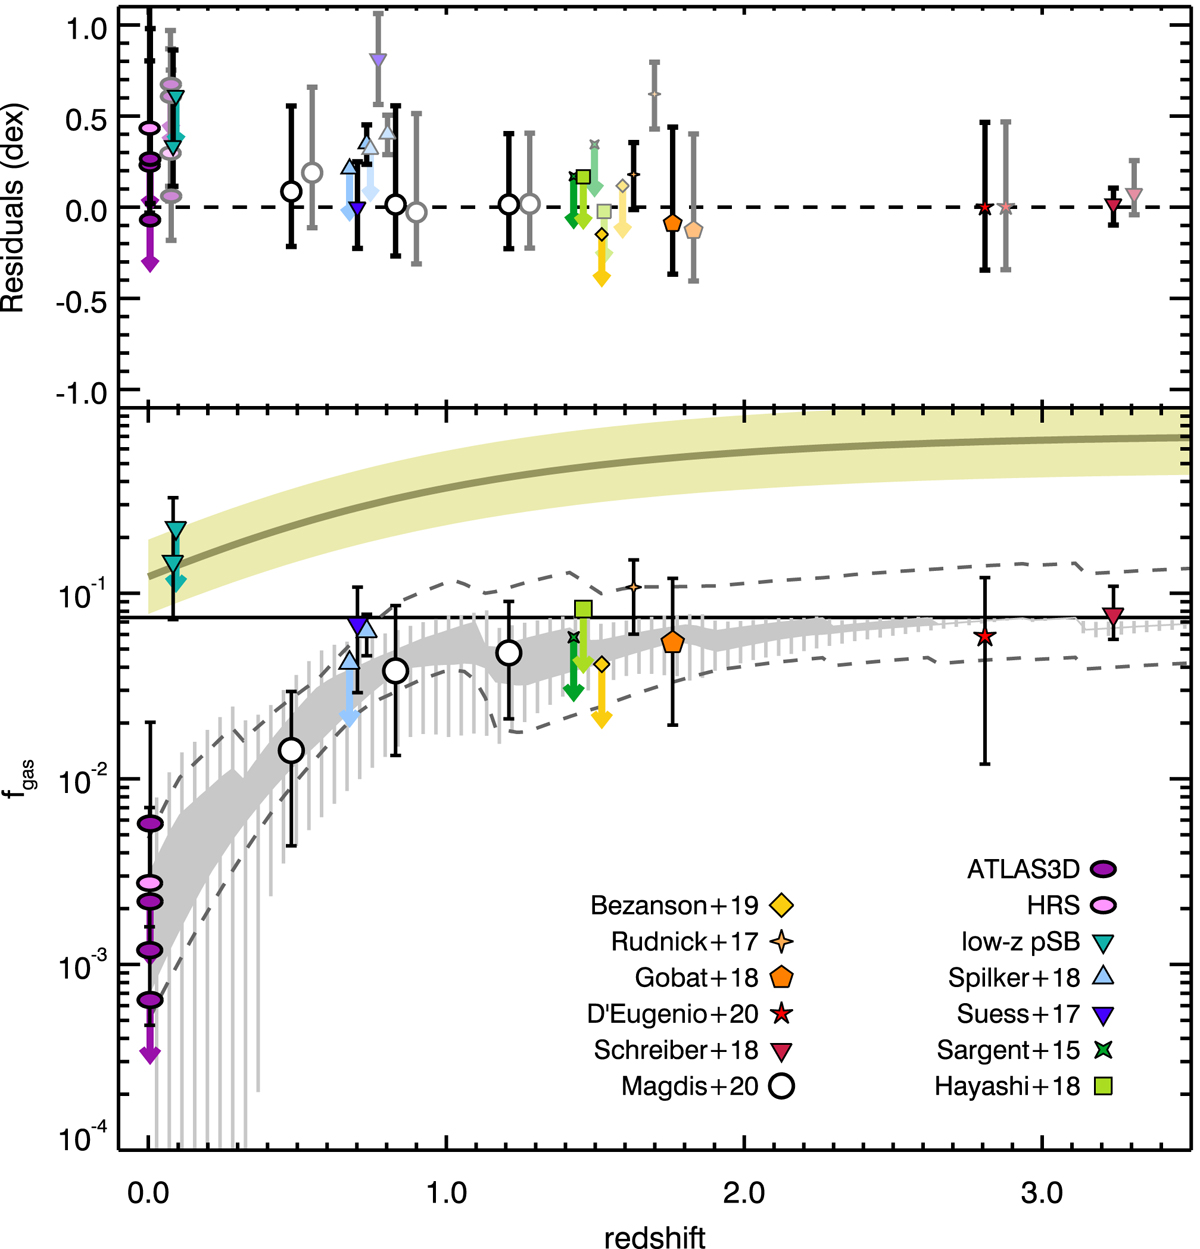
Bottom panel: evolution of the ⟨fgas⟩ of quiescent galaxies as a function of redshift. The various symbols with error bars or upper-limit arrows show the median fgas of the QG and pSB samples. The solid and hatched light gray regions trace the envelope of the best-fit models with constant fg, 0, within the range of median stellar masses of the samples, and its predicted 1σ scatter, respectively. The dark dashed gray lines show the best-fit envelope for the fractional case model and the horizontal black line shows the best-fit fg, 0, s for the constant case model. For comparison, the evolution of fgas of 5 × 10¹⁰ M⊙ MS galaxies, as parameterized by S14, is shown as a tan line and its scatter envelope is shown as a solid cream region. Top panel: median residuals of the fits with constant and fractional fg, 0 (solid and clear symbols, respectively, the latter having been offset for clarity) for the same samples. The error bars show the dispersion of residuals. Smaller symbols (Sargent et al. 2015; Rudnick et al. 2017; Bezanson et al. 2019) indicate single objects.
Current usage metrics show cumulative count of Article Views (full-text article views including HTML views, PDF and ePub downloads, according to the available data) and Abstracts Views on Vision4Press platform.
Data correspond to usage on the plateform after 2015. The current usage metrics is available 48-96 hours after online publication and is updated daily on week days.
Initial download of the metrics may take a while.